Conformal-Maps: Code for interactive conformal mapping with SymPy
229 views
Skip to first unread message

Zoufiné Lauer-Baré
Sep 8, 2021, 6:25:53 AM9/8/21
to sympy
Hello together,
I work a as simulation engineer and studied math, inclusively phd in applied math. I teach Python for Data Science students as external lecturer.
Recently I gave a talk about conformal mappings with SymPy on th 20. Scipy:
Based on that work, I joined a community project which helped me to visualize my research:
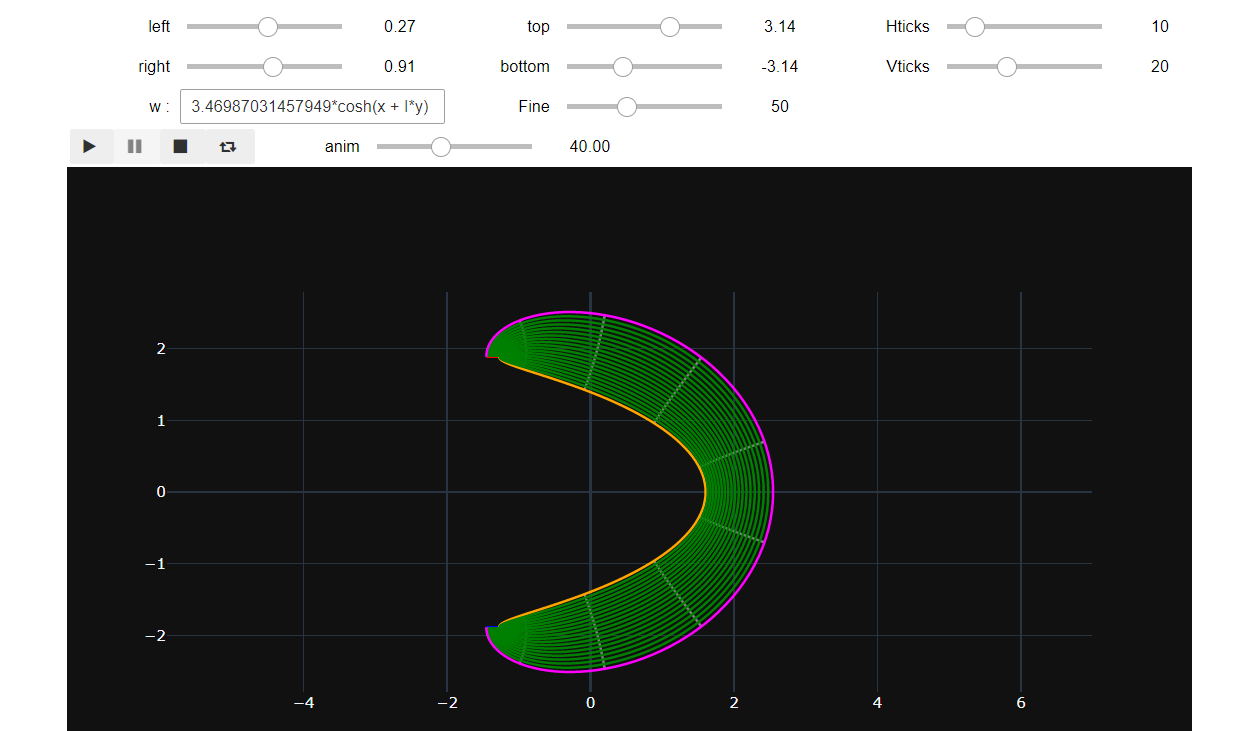
This project permits to interactively transform circles, annuli, rectangles, squares to corresponding domains, when function of a comlpex variable are applied on them, see attachement. This project is based on SymPy, NumPy, Plotly and Jupyter Notebook.
It would great, if this project (https://github.com/im-AMS/Conformal-Maps) could be listed on the SymPy webpage.
In my opinion, this is one of the best codes to interactively see how functions of a complex variable change geometries, also compared to Maple and Mathematica.
I am looking forward to hearing feedback from the SymPy commuity on this project.
Regards,
Zoufiné Lauer-Baré

Aaron Meurer
Sep 8, 2021, 3:02:49 PM9/8/21
to sympy
I saw your SciPy talk. It was a very nice use of SymPy.
By the way, I wonder if SymPy shouldn't have some convenience
functions somewhere for working with conformal mappings and Mobius
functions. I've noticed that dealing with complex infinity in
particular can be a little annoying. For instance, simply substituting
zoo in an expression for a mobius transformation doesn't give you the
correct value.
Aaron Meurer
> --
> You received this message because you are subscribed to the Google Groups "sympy" group.
> To unsubscribe from this group and stop receiving emails from it, send an email to sympy+un...@googlegroups.com.
> To view this discussion on the web visit https://groups.google.com/d/msgid/sympy/caab83fe-faab-4e62-b0f2-4943bdb5fbfcn%40googlegroups.com.
By the way, I wonder if SymPy shouldn't have some convenience
functions somewhere for working with conformal mappings and Mobius
functions. I've noticed that dealing with complex infinity in
particular can be a little annoying. For instance, simply substituting
zoo in an expression for a mobius transformation doesn't give you the
correct value.
Aaron Meurer
> You received this message because you are subscribed to the Google Groups "sympy" group.
> To unsubscribe from this group and stop receiving emails from it, send an email to sympy+un...@googlegroups.com.
> To view this discussion on the web visit https://groups.google.com/d/msgid/sympy/caab83fe-faab-4e62-b0f2-4943bdb5fbfcn%40googlegroups.com.
Zoufiné Lauer-Baré
Sep 11, 2021, 5:14:37 AM9/11/21
to sy...@googlegroups.com
Hello Aaron,
Thank you for the reply and the feedback on my Scipy talk.
1.) In what part of sympy could conformal mappings be implemented in sympy?
2.) I did not understand the moebius mapping problem you mentioned, is there already an issue in github on that?
3.) I think, that for the usage of conformal mappings with sympy a separation of real and imaginary parts of more complicated functions as artan(z) or artan2(z) should be supported, I may write an issue on this topic, if there is none already.
Regards!
Zoufiné
> Am 08.09.2021 um 21:02 schrieb Aaron Meurer <asme...@gmail.com>:
>
> I saw your SciPy talk. It was a very nice use of SymPy.
> You received this message because you are subscribed to a topic in the Google Groups "sympy" group.
> To unsubscribe from this topic, visit https://groups.google.com/d/topic/sympy/H3c2yBzm8ds/unsubscribe.
> To unsubscribe from this group and all its topics, send an email to sympy+un...@googlegroups.com.
> To view this discussion on the web visit https://groups.google.com/d/msgid/sympy/CAKgW%3D6JA2%3DBh75M30CkFGUE2aOAj5Byyq8yu%3DPO4KoTAa1b0kw%40mail.gmail.com.
Thank you for the reply and the feedback on my Scipy talk.
1.) In what part of sympy could conformal mappings be implemented in sympy?
2.) I did not understand the moebius mapping problem you mentioned, is there already an issue in github on that?
3.) I think, that for the usage of conformal mappings with sympy a separation of real and imaginary parts of more complicated functions as artan(z) or artan2(z) should be supported, I may write an issue on this topic, if there is none already.
Regards!
Zoufiné
> Am 08.09.2021 um 21:02 schrieb Aaron Meurer <asme...@gmail.com>:
>
> I saw your SciPy talk. It was a very nice use of SymPy.
> To unsubscribe from this topic, visit https://groups.google.com/d/topic/sympy/H3c2yBzm8ds/unsubscribe.
> To unsubscribe from this group and all its topics, send an email to sympy+un...@googlegroups.com.
> To view this discussion on the web visit https://groups.google.com/d/msgid/sympy/CAKgW%3D6JA2%3DBh75M30CkFGUE2aOAj5Byyq8yu%3DPO4KoTAa1b0kw%40mail.gmail.com.
Reply all
Reply to author
Forward
0 new messages