Display of scale multiplier in scientific notation (the e notation for powers of ten) is missing for plots starting with 0
3,022 views
Skip to first unread message

Niranjana K M
Jul 26, 2022, 5:15:11 AM7/26/22
to sage-devel
Dear all,
"2D plotting" doc says,
"Another thing to be aware of with axis labeling is that when
the labels have quite different orders of magnitude or are very
large, scientific notation (the e notation for powers of ten) is used."
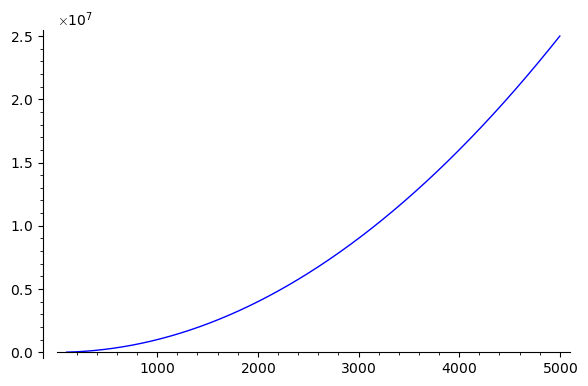
But display of this multiplier power for the scaled y-axis is missing if the plot starts with x=0 or at most will be missing till the x-axis detaches from the origin. Following examples illustrates it,
sage: plot(x^2,(x,0,5000)) # missing display of 1e7 above y-axis
sage: plot(x^2,(x,50,5000)) # missing display of 1e7 above y-axissage: plot(x^2,(x,100,5000)) # display of 1e7 above y-axis is visible
On the other side matplotlib natively always displays the scale multiplier (if any) whenever numbers are large. For example:
sage: import matplotlib.pyplot as plt
sage: import numpy as np
sage: z = np.linspace(0, 5000, 100)
sage: plt.plot(z, z**2)
sage: plt.show()
sage: import numpy as np
sage: z = np.linspace(0, 5000, 100)
sage: plt.plot(z, z**2)
sage: plt.show()
My other plots involved electric field calculations which had magnitudes around 1/epsilon_0 which is 1/(8.85E-12) =~ 10^11. For those plots starting with x=0 the display of multiplier used for y-axis were missing.
With regards
Niranjana

kcrisman
Jul 27, 2022, 9:35:51 AM7/27/22
to sage-devel
This is a good question, and one that has been around for a while in some form, unfortunately; see https://trac.sagemath.org/ticket/7964 for a related ticket. See https://trac.sagemath.org/ticket/30983 for a ticket that complains instead about something else but which is closely related.
We would be grateful for any additional insight you might provide. Here are some pieces of info about where we use matplotlib that you might find useful in that regard.
We use some specific matplotlib ticker and formatter options which don't always play well here. See https://github.com/sagemath/sage/blob/develop/src/sage/plot/graphics.py#L2326 for _matplotlib_tick_formatter in sage/plot/graphics.py
In particular, note that, under ordinary circumstances,
y_locator = MaxNLocator(**locator_options)
y_formatter = ScalarFormatter()
y_formatter = ScalarFormatter()
That is very close to the defaults for matplotlib, but maybe we are using things in an antiquated way. See e.g. https://matplotlib.org/stable/api/ticker_api.html#matplotlib.ticker.ScalarFormatter
On the other hand, if (as I suspect) that isn't the root issue, it probably is in the save method (https://github.com/sagemath/sage/blob/develop/src/sage/plot/graphics.py#L3198). My first thought was that somehow fig_tight played a role, but
sage: plot(x^2,(x,0,5000),fig_tight=False)
doesn't seem to be any different than the one you pointed out. Another possibility is tight_layout (https://matplotlib.org/stable/api/tight_layout_api.html) which we do use, but which a little experimentation doesn't seem to indicate is the problem either.
Niranjana K M
Jul 27, 2022, 10:53:39 AM7/27/22
to sage-devel
Dear Kcrisman,
I will look into it if you promise me to review and close my another ticket https://trac.sagemath.org/ticket/34038
based on the thread https://groups.google.com/g/sage-devel/c/tMH1RZNyC9s/m/DRwexGpzAwAJ
😀
With regards
Niranjana

Emmanuel Charpentier
Jul 27, 2022, 4:15:18 PM7/27/22
to sage-devel
Le mercredi 27 juillet 2022 à 16:53:39 UTC+2, niran…@gmail.com a écrit :
Dear Kcrisman,I will look into it if you promise me to review and close my another ticket https://trac.sagemath.org/ticket/34038based on the thread https://groups.google.com/g/sage-devel/c/tMH1RZNyC9s/m/DRwexGpzAwAJ
This ticket contains suggestion, is marked needs_review, but proposes no branch to review. Could you propose a patch implementing your suggestions ? The Developer’s guide will guide you on the road to proposing such a patch as a branch of the Sage source git tree…
Niranjana K M
Jul 27, 2022, 5:45:10 PM7/27/22
to sage-devel
Very sorry. I am new to git and that was my first trac ticket ever. If somebody can take it up patching i would be happy.
Niranjana K M
Jul 27, 2022, 5:55:41 PM7/27/22
to sage-devel
Regarding axes Formatter, inserting
rcParams['axes.formatter.use_mathtext'] = True
just after
from matplotlib import rcParams
in graphics.py makes the scientific notation to be typeset as x 10^7 (for example). This looks nicer than 1e7. See the figure. Though it does not solve the current problem, aesthetically it looks nice whenever the scaling is displayed.
On Thursday, July 28, 2022 at 1:45:18 AM UTC+5:30 emanuel.c...@gmail.com wrote:
Niranjana K M
Jul 28, 2022, 5:25:12 AM7/28/22
to sage-devel
I found it ! The problem is in use of SelectiveFormatter to get rid of 0 tick label if the axes cross. Commenting out lines
to
from sage.plot.plot import SelectiveFormatter
subplot.yaxis.set_major_formatter(SelectiveFormatter(
subplot.yaxis.get_major_formatter(), skip_values=[0]))
subplot.xaxis.set_major_formatter(SelectiveFormatter(
subplot.xaxis.get_major_formatter(), skip_values=[0]))
subplot.yaxis.set_major_formatter(SelectiveFormatter(
subplot.yaxis.get_major_formatter(), skip_values=[0]))
subplot.xaxis.set_major_formatter(SelectiveFormatter(
subplot.xaxis.get_major_formatter(), skip_values=[0]))
will bring back the scaling factor in scientific notation. But on the downside it will print the origin 0.
SelectiveFormatter use itself has this issue. A modified version of usage example of SelectiveFormatter in Sage reference >> 2D Plotting
from sage.plot.plot import SelectiveFormatter
import matplotlib.pyplot as plt
import numpy
fig=plt.figure()
ax=fig.add_subplot(111)
t = numpy.arange(10000000, 10100000, 100)
s = t
p = ax.plot(t, s)
formatter=SelectiveFormatter(ax.xaxis.get_major_formatter(),skip_values=[0,1])
formatter=SelectiveFormatter(ax.yaxis.get_major_formatter(),skip_values=[0,1])
ax.xaxis.set_major_formatter(formatter)
ax.yaxis.set_major_formatter(formatter)
show(p)
Any idea to fix it?
kcrisman
Jul 28, 2022, 9:52:34 AM7/28/22
to sage-devel
Thanks for the continued conversation. I hope it was clear that "we would be grateful" implied that there was no compulsion on your part, as well as on the part of any other contributor.
I did notice the mathtext option, but since our previous version had used the e notation, changing that would be a separate ticket, and probably need some discussion.
I found it ! The problem is in use of SelectiveFormatter to get rid of 0 tick label if the axes cross. Commenting out lines
Great! That is half the battle, good detective work..
However, I couldn't replicate the example you gave - among other thing, show(p) gave me something that wasn't plottable (I had to use savefig etc. on the figure itself). Also, what is your modified version trying to show - the missing part, or a potential solution? Thanks!
kcrisman
Jul 28, 2022, 9:52:53 AM7/28/22
to sage-devel
This is now https://trac.sagemath.org/ticket/34233
Niranjana K M
Jul 28, 2022, 10:36:17 AM7/28/22
to sage-devel
@kcrisman
Thanks for the continued conversation. I hope it was clear that "we would be grateful" implied that there was no compulsion on your part, as well as on the part of any other contributor.
There is no such compulsion, indeed I like working with SAGE. My reply about my other ticket was just with light heart to make you to look into my first ticket.
However, I couldn't replicate the example you gave - among other thing, show(p) gave me something that wasn't plottable (I had to use savefig etc. on the figure itself).
savefig was the one given in doc and the right one. I just tried in
shortcut and somehow the plot appeared in my notebook with a error
string
[𝙻𝚒𝚗𝚎𝟸𝙳(⎯𝚌𝚑𝚒𝚕𝚍𝟶)]
[𝙻𝚒𝚗𝚎𝟸𝙳(⎯𝚌𝚑𝚒𝚕𝚍𝟶)]
Also, what is your modified version trying to show - the missing part, or a potential solution? Thanks!
First we have to try natively matplotlib formatter to have similar selective formatting and confirm whether it is a matplotlib issue which is to be reported to upstream.
Then try to do something similar to
ax.xaxis.get_major_formatter().set_scientific(True)
ax.yaxis.get_major_formatter().set_scientific(True)
to re-enable scientific notation for axis.
I have to first study matplotlib formatter.
Also I noticed that,
sage: plot(x^2,(x,100,5000), tick_formatter="latex")
altogether dropped formatting in scientific notation and instead started printing like 25000000.0. But typeset="latex"
sage: plot(x^2,(x,100,5000), typeset="latex")
does retain scientific notation
Time being solution would be to drop use of SelectiveFormatter to get rid of 0 tick label if the axes cross. Let the origin be visible for some time.
With regards
Niranjana
kcrisman
Jul 29, 2022, 2:35:24 PM7/29/22
to sage-devel
Time being solution would be to drop use of SelectiveFormatter to get rid of 0 tick label if the axes cross. Let the origin be visible for some time.
My guess is that this would not be seen as a great fix, but let's put images and other followup on the ticket.
Niranjana K M
Jul 29, 2022, 4:31:02 PM7/29/22
to sage-devel
Wait, i just solved it!
It is not the issue with matplotlib but with the construction of SelectiveFormatter. This formatter construction is incomplete. I have created two new customized ScalarFormatters (default formatters used by matplotlib), the second one would be a good new addition to sage along with the first one. We can have both. I have worked out same situation but in native python with matplotlib. Only thing is to adapt it to sage. It won't be hard to do that, just need slight adjustments. Please look into the attached two example python files.
Inspired from:
https://stackoverflow.com/questions/11244514/modify-tick-label-text <-- Discusses similar issue (see second answer from last)
kcrisman
Aug 1, 2022, 10:41:51 AM8/1/22
to sage-devel
This looks likely, thanks! The next step for you (and all of us) would be as follows:
1) Neither of these codes are so long that you couldn't put them as formatted text in comments on the relevant ticket. Use {{{ code }}} to format them.
2) If you could (on the ticket) attach or link to images of the before/after, that would be very helpful. Particularly the `use_mathtext` option being different would need discussion and comparison.
Thanks! I hope others look at this issue too, as I may not have margin for a full review at this time.
Reply all
Reply to author
Forward
0 new messages