Skip to first unread message

Sachia
Mar 9, 2016, 9:23:55 AM3/9/16
to Qiime 1 Forum
Dear QIIME people,
I Have 16S data (515-806 region) from two separate runs on two different Illumina MiSeq machines. It is the same experiment, characterizing the microbial community over time targeting the 16S rRNA gene and 16S rRNA (DNA and RNA).
I wish to merge the two runs into one during the split_libraries_fastq.py step, however, I ran into the problem that one run had a lower quality than the other (the DNA is the bad egg here).
The command:
split_libraries_fastq.py -i seqs_DNA.fastq,seqs_RNA.fastq -b barcodes_DNA,fastq,barcodes_RNA.fastq -m map_DNA_corr.txt,map_RNA.txt -o slout20/ --barcode_type 16 --store_qual_scores -q 19
Checking the log for the split_libraries_fastq.py step, it became evident that the entire DNA dataset failed and was too short after quality truncation (43 passed out of +500 000). The RNA data ran fine. Playing around with just the DNA, I found that adjusting the --min_per_read_length_fraction to 68% would get me almost all reads successfully through. ( 69% only left me with a couple of thousands successful reads out of +500 000). (adjusting --min_per_read_length_fraction I got from another thread with a similar issue, but for whole dataset).
Now to my question:
1. Should I run split_libraries separately and with different quality settings, and merge later? Maybe with the add_qiime_labels.py.
2. Or should I still merge both runs but with the lower quality setting?
I want to cluster at 97% and compare the communities when characterized using the gene and the rRNA. Can I compare if I use different quality settings?
2. In general, should the reads be trimmed to equal length at some stage? (although both end up at median length 252)
I found some other threads helpful, but not directly answering this dilemma, hope its OK.
Thank you for your time.
Sachia
PS. don't be alarmed of the small fraction out of the total dataset is being pulled, there's unrelated projects in the raw files ^^

Colin Brislawn
Mar 9, 2016, 2:09:16 PM3/9/16
to Qiime 1 Forum
Hello Sachia,
Thanks for getting in touch with us. This sounds like a very interesting experiment. Most people only sequence the 16S gene from DNA, so your processing of DNA and rRNA is very novel.
Given the nature of these two different data types, I would suggest a third option:
3: Analyze these two runs totally separately. (two split_libraries, two pick_otus, two .biom tables, two beta_diversity, etc)
Not only is the quality difference between runs, I'm guessing the biology will be pretty different too, and keeping them separate will let you capture all the differences you see.
Let me know what you think!
Colin Brislawn

TonyWalters
Mar 9, 2016, 2:15:15 PM3/9/16
to Qiime 1 Forum
Hello,
1. I would run them together as a single split_libraries_fastq.py command with the same quality filtering settings. I would recommend adding a column to your mapping file to indicate the run it came from, so later, for instance, you can colorize the data in beta diversity plots by the run to see how much separation there is due to the DNA/RNA/quality differences. Since some of the samples started from RNA, the effective copy number of the 16S gene could vary widely, so they probably would be different even with equivalent quality reads, but you can test this by running them a second time separately with different quality filtering settings, and using a cat command to merge the separate seqs.fna files. You shouldn't need add_qiime_labels.py-make sure all of your SampleIDs are unique between the runs though. If you feel save merging paired samples later, you can use the collapse_samples.py script to do so (http://qiime.org/scripts/collapse_samples.html).
2. It's not necessary to trim the reads to the same length (the clustering and taxonomy assignments could change slightly unless there are some reads that are very long present), but again, you could try it the demultiplexed output from split_libraries_fastq.py and compare the results to non-trimmed data. There's a custom script you could use for trimming here: https://gist.github.com/walterst/7306794
Just saw Colin's reply as I was typing this.
Sachia
Mar 9, 2016, 2:43:45 PM3/9/16
to Qiime 1 Forum
Hello Colin and Tony,
thank you for the prompt suggestions!
If I understand correctly you both correctly you suggest:
a. run together from the beginning with the lower quality setting (Tony)
b. run separately up until BIOM tables, merge BIOM tables and run diversity metrics on them to evaluate? (Both Colin and Tony)
and then compare the two, approaches and see if it makes a difference?
Tony, thanks for clearing up my confusion regarding the read length and trimming!
Additionally, Colin I'm interested in your thoughts behind your suggestion as to the biology argument. I have had a similar type dataset (another project), of microbial communities both targeting the 16S gene and rRNA. However, here I ran it all together from start to end, as the samples were all sequenced on the same lane anyways. You're right, there was a large difference between the two community "types".
On a complete off tangent - thank you for this wonderful forum! I really cannot fully express how amazing and gratifying it is to be able to come here and discuss and get so valuable feedback.
Cheers,
Sachia
Colin Brislawn
Mar 9, 2016, 2:59:40 PM3/9/16
to Qiime 1 Forum
Hello Sashia,
On a complete off tangent - thank you for this wonderful forum! I really cannot fully express how amazing and gratifying it is to be able to come here and discuss and get so valuable feedback.
I'm glad you are having a good experience here. I really value the qiime community and am grateful for it too. btw, anyone can help answer questions so you can chime-in (get it!?) if you see a question you want to answer.
I think Tony and I are suggesting totally conflicting things.
- I'm suggesting splitting up these data types and processing them fully independently of each other. The data in these two .biom tables would never see each other, until they are presented side by side in a figure (Fig 1a PCoA of 16S DNA, Fig 1b PCoA of 16S rRNA).
- Tony is suggesting processing the data types together (same settings) and annotate their different sources in your mapping file.
That's the other cool thing about this field: reasonable scientists disagree. Do what you want (as long as you describe it in the methods section).
Keep in touch,
Colin
Sachia
Mar 9, 2016, 3:12:00 PM3/9/16
to Qiime 1 Forum
hehe, yep get it. I'm still such a novice that extending my help to others here is still limited (that and time-pressure since I'm finishing up my phd now). However, hope to chime along in the future :)
Ah well, I did get that Tony start out with suggesting to run together from the start. I just understood the text further down, that he is talking about something something "...but you can test this by running them a second time separately with different quality filtering settings, and using a cat command to merge the separate seqs.fna files. You shouldn't need add_qiime_labels.py-make sure all of your SampleIDs are unique between the runs though. If you feel save merging paired samples later, you can use the collapse_samples.py script to do so (http://qiime.org/scripts/collapse_samples.html)." (Sorry, couldn´t figure out how to quote directly from Tony's reply to your reply).
Maybe it wasn't obvious in the original post. All DNA samples were run in the same lane on machine 1, all RNA samples in a different run on machine 2. Just in case that was confusing (e.g. the run multiple times together but annotate run source).
I might have misunderstood that part though. Anyhow, I will attempt both separate and merged and compare at the end, I'll let you know how it went, and thanks for making it clear that you never intended to merge BIOM tables. Might take some days before I have news though :)
Cheers,
Sachia
Sachia
Mar 21, 2016, 1:48:01 PM3/21/16
to Qiime 1 Forum
Hi again,
I am back with an update. I ran both suggestions so
a) DNA and RNA together at lowered qual setting (ie. --min_per_read_length_fraction 0.68)
b) DNA separate, again using 0.68
c) RNA separate at default settings (0.75)
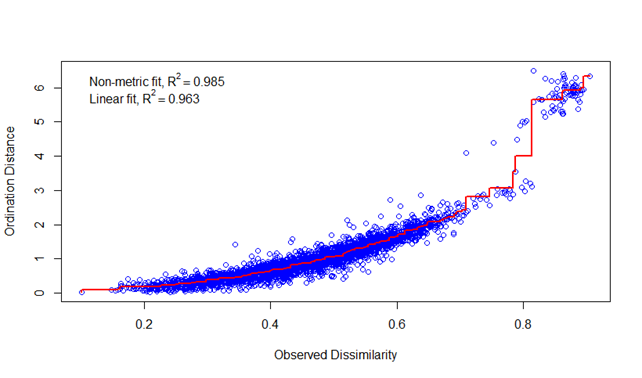
checking for possible effects it was plotted in a MDS plot.
I'll just show the RNA samples here (they were rarefied to smallest sample size and this was the same in a), b), c). Nothing else was done).
This is from option a)

this is from option c)
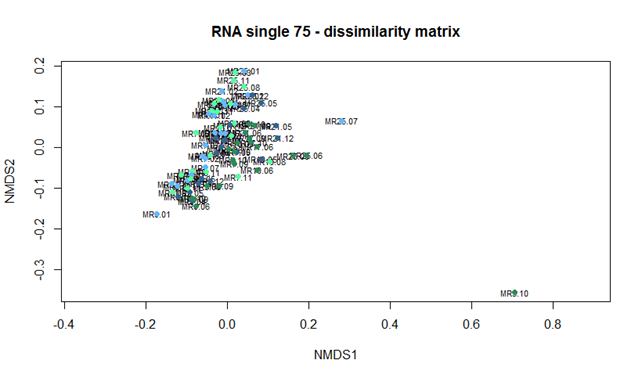

To us it looks the same, and the DNA distributes differently from the RNA, but between QIIME-runs it seems like the same.
in the end it was decided to go with option a), as it was very few reads in difference between RNA at 0.68 and 0.75 (the fear could be to open up for alot of "bad" reads), and that it might be easier to justify with a uniform strategy. But again, now we tested it.
If you have any additional comments they're welcome :)
Thank you for all the help.
Cheers,
Sachia
I am back with an update. I ran both suggestions so
a) DNA and RNA together at lowered qual setting (ie. --min_per_read_length_fraction 0.68)
b) DNA separate, again using 0.68
c) RNA separate at default settings (0.75)
checking for possible effects it was plotted in a MDS plot.
I'll just show the RNA samples here (they were rarefied to smallest sample size and this was the same in a), b), c). Nothing else was done).
This is from option a)
this is from option c)
To us it looks the same, and the DNA distributes differently from the RNA, but between QIIME-runs it seems like the same.
in the end it was decided to go with option a), as it was very few reads in difference between RNA at 0.68 and 0.75 (the fear could be to open up for alot of "bad" reads), and that it might be easier to justify with a uniform strategy. But again, now we tested it.
If you have any additional comments they're welcome :)
Thank you for all the help.
Cheers,
Sachia
Colin Brislawn
Mar 21, 2016, 4:19:41 PM3/21/16
to Qiime 1 Forum
Thanks for the update Sachia,
These results look good to me, and your rationale for choosing this method seems reasonable to me.
Let us know if you have any other questions,
Colin
Reply all
Reply to author
Forward
0 new messages