[llvm-dev] [InstrProfiling] Lightweight Instrumentation

Ellis Hoag via llvm-dev
Our team at Facebook would like to propose a lightweight variant of IR instrumentation PGO for use in the mobile space. IRPGO is a proven technology in LLVM that can boost performance for server workloads. However, the larger binary resulting from instrumentation significantly limits its use for mobile applications. In this proposal, we introduce a few changes to IRPGO to reduce the instrumented binary size, making it suitable for PGO on mobile devices.
This proposal is driven by the same need behind the earlier MIP (machine IR profile) prototype. But unlike MIP where there is significant divergence from IRPGO, this proposed lightweight instrumentation fits into the existing IRPGO framework with a few extensions to achieve a smaller instrumented binary.
We’d like to share the new design and results from our prototype and get feedback.
Best,
Ellis, Kyungwoo, and Wenlei
Motivation
In the mobile space, profile guided optimization can also have an outsized impact on performance just like PGO for server workloads, but conventional instrumentation comes with a large binary size and code size increase as high as 50%, which limits its use for mobile application for two reasons: - Mobile applications are very sensitive to total binary size as larger binaries take longer to download and use more space on devices. There could be a hard size limit for over-the-air (OTA) updates for this reason.
- When code (.text) size increases, it takes longer for applications to start up and could also degrade runtime performance due to more page faults on devices with limited RAM.
Overview
The size overhead from IRPGO mainly comes from two things: 1) metadata for mapping raw counts back to IR/CFG, which has to stay with the binary. 2) the increased .text size due to insertion of instrumented code and less effective optimization after instrumentation. Two extensions are proposed to reduce the size overhead from each of the above:- We allow the use of debug info / dwarf as alternative metadata for mapping counts to IR, aka profile correlation. Debug info is extractable from the binary, therefore such metadata doesn’t need to be shipped to mobile devices. Debug info has been used extensively for sampling based PGO in LLVM, so it has reasonable quality to support profile correlation.
- We add the flexibility to allow coarse grained instrumentation that: 1) only insert probes at function entry instead of each block (or blocks decided by MST placement); 2) optional coverage mode using one byte booleans in addition to today’s counting mode using 8 byte counters.
Extractable Metadata
With today’s IRPGO, the instrumentation runtime dumps out aprofraw profile at the end of training. The runtime creates a header and appends data from the __llvm_prf_data, __llvm_prf_cnts, and __llvm_prf_names sections to create a profraw profile. The __llvm_prf_data section contains references to each function’s profile data (in __llvm_prf_cnts) and name (in __llvm_prf_names) so they are needed to correlate profile data to the functions they instrument.Some kind of metadata to correlate counts back to IR (specifically CFG blocks) is unavoidable. One way to reduce binary size is to make such metadata extractable so they don’t have to be shipped to mobile devices. We could make
__llvm_prf_data and __llvm_prf_names extractable, but the cost will be non-trivial and it will be a breaking change. On the other hand, debug info is extractable from binary and it already does a very good job of maintaining mapping between address and source location / symbols. Sample PGO depends entirely on debug info for profile correlation. So we picked debug info as the alternative for extractable metadata.In our proposed instrumentation, we create a special global struct, e.g.,
__profc__Z3foov, to hold counters for a particular function. The __llvm_prf_cnts data section holds all of these structs and serves as placeholder for raw profile counters. In our final instrumented binary, we only have probe instructions and raw profile data without any instrumentation metadata, i.e., there are no __llvm_prf_names or __llvm_prf_data sections but we still have a __llvm_prf_cnts section. At runtime, we dump the __llvm_prf_cnts section to a file without any processing after profiling. To differentiate from IRPGO, the output from runtime is called proflite and we can add another VARIANT_MASK_ flag to the Version field of the profile header. At llvm-profdata post-processing time, we use debug info to correlate our raw profile data as follows. First we identify an instrumented function and look for its special global struct that holds counters (__profc__Z3foov) in the debug info. The debug info can tell us the address of that symbol in the binary and we can compute its offset from the __llvm_prof_cnts section. Then we can use that offset to read the function entry and block counters from the proflite file. Finally we populate profdata output for each function following the existing format. Value profile is not going to be supported with extractable metadata right now, though we believe it can also be added following a similar scheme.
To improve debug info quality for profile correlation,
-fdebug-info-for-profiling from AutoFDO can be used. Additionally, we could also use pseudo-probe from CSSPGO as the alternative metadata which is also fully extractable. We propose a new flag
-fprofile-generate-correlate=[profdata|debug-info|pseudo-probe] to choose what metadata to use for profile correlation. Either we correlate with today’s IRPGO metadata and keep them in their own sections (__llvm_prf_data and __llvm_prf_names), with debug info, or with pseudo-probe.Coarse-grained Instrumentation
In addition to reducing metadata size (__llvm_prf_names and __llvm_prf_data), we can also tune down .text size and __llvm_prf_cnts size. We do this by 1) only instrumenting function entries instead of each block and 2) lowering precision by tracking single byte coverage data rather than 8 byte counters. This is a trade-off between profile quality and binary size.Function profile vs block profile and counting mode vs coverage mode can all be selected independently using our proposed flag
-fprofile-generate-mode=[func-cov|block-cov|func-cnt|block-cnt], and they can work with both extractable metadata as well as IRPGO‘s correlation method. func-cov and block-cov use single byte booleans for coverage data while func-cnt and block-cnt use 8 byte counters. block-cnt represents today’s IRPGO which is the default.When using a profile generated from modes other than
block-cnt, additional profile inference is needed before the counts can be consumed by optimizations. Such inference is done during profile loading and so it’s transparent to optimizations.- For block coverage mode, we will use coverage info to seed block count inference, and leverage static branch probability at the same time to produce a CFG profile that honors zero count blocks and converts live block coverage data into synthetic counts.
- For function count mode, we will derived a CFG profile entirely from static branch probability, then scale the CFG profile based on function entry count.
- Function coverage mode is handled similar to function count mode. For covered/live functions, we will derived a CFG profile entirely from static branch probability first, then scale that CFG profile by a constant.
Workflow
Since these are extensions that share the same underlying PGO framework, the workflow for lightweight PGO is very similar to existing IRPGO.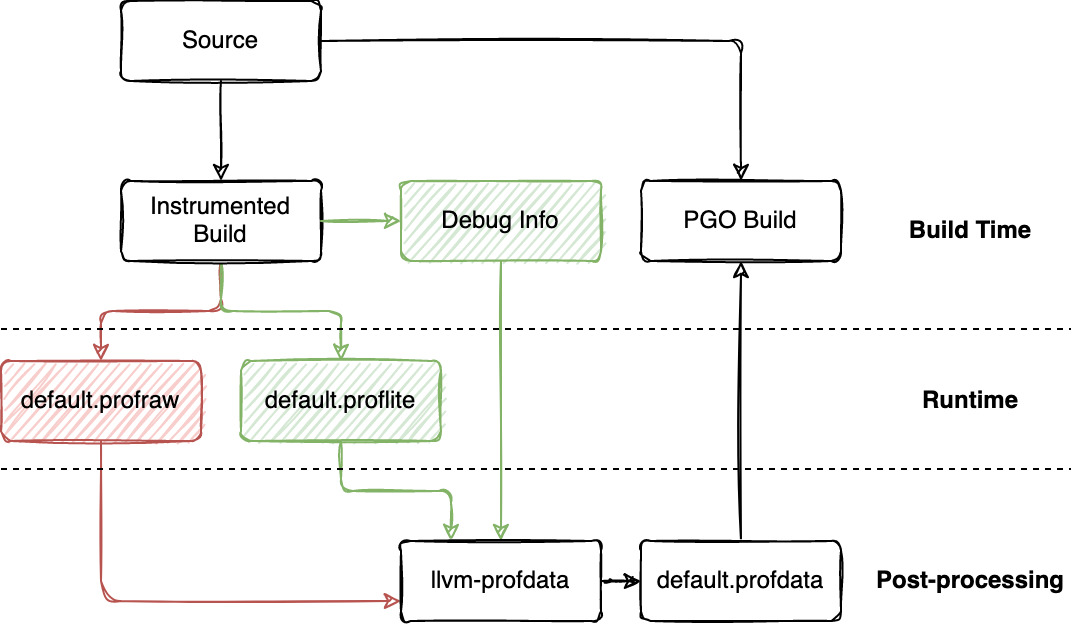
Prototype & Results
Phipps, Alan via llvm-dev
Hi Ellis,
I support this proposal -- we’ve implemented some of these in our downstream compiler in order to support code coverage with embedded use cases. See the lightning talk slides from last year’s developers’ meeting: https://llvm.org/devmtg/2020-09/slides/PhippsAlan_EmbeddedCodeCoverage_LLVM_Conf_Talk_final.pdf
Specifically, we keep all of the mapping data in the binary file and limit allocatable memory to raw profile counters only. We extend llvm-profdata to extract data from the binary file and combine it with the raw profile data when producing an indexed profile.
And we very recently implemented function-entry-only coverage as well as support for variable size counters. We would like to upstream some or all of this in the future, so perhaps we can work with you on doing that. However, none of our work is productized for general PGO – only code coverage (so no support for reading data back in, for example).
Alan Phipps
MCU Compiler Team
Texas Instruments, Inc.
Ellis Hoag via llvm-dev
Xinliang David Li via llvm-dev
Xinliang David Li via llvm-dev
Ellis Hoag via llvm-dev
Xinliang David Li via llvm-dev
Thanks for the feedback, David.
You’re right that most of the savings comes from coarse-grained instrumentation. However, the situation we’re facing for mobile (and also embedded systems) comes with very tight size constraints. Some components are already built with -Oz, and we’re constantly on the lookout for extra MiB to save so more “features” can get into the components.
For clang self-build example, 7M overhead is much better than 50M+, and 50M->7M indeed look close to 50M->4M as improvements. But comparing to non-PGO, this is still +7M vs +4M. The extra 3M is considered quite significant, and could potentially be a deal breaker for some cases.
In short, this is “close” as you mentioned, but not good enough still. Using dwarf as metadata also has a few benefits over tweaking existing metadata to be extractable: it’s less intrusive, and it’s also a more standardized metadata comparing to PGO’s own metadata.
Thanks,
Wenlei
Wenlei He via llvm-dev
Thanks for the feedback, David.
You’re right that most of the savings comes from coarse-grained instrumentation. However, the situation we’re facing for mobile (and also embedded systems) comes with very tight size constraints. Some components are already built with -Oz, and we’re constantly on the lookout for extra MiB to save so more “features” can get into the components.
For clang self-build example, 7M overhead is much better than 50M+, and 50M->7M indeed look close to 50M->4M as improvements. But comparing to non-PGO, this is still +7M vs +4M. The extra 3M is considered quite significant, and could potentially be a deal breaker for some cases.
In short, this is “close” as you mentioned, but not good enough still. Using dwarf as metadata also has a few benefits over tweaking existing metadata to be extractable: it’s less intrusive, and it’s also a more standardized metadata comparing to PGO’s own metadata.
Thanks,
Wenlei
From:
llvm-dev <llvm-dev...@lists.llvm.org> on behalf of Xinliang David Li via llvm-dev <llvm...@lists.llvm.org>
Date: Monday, October 18, 2021 at 1:14 PM
To: Ellis Hoag <ellis.sp...@gmail.com>
Cc: llvm-dev <llvm...@lists.llvm.org>
Subject: Re: [llvm-dev] [InstrProfiling] Lightweight Instrumentation

Prototype & Results
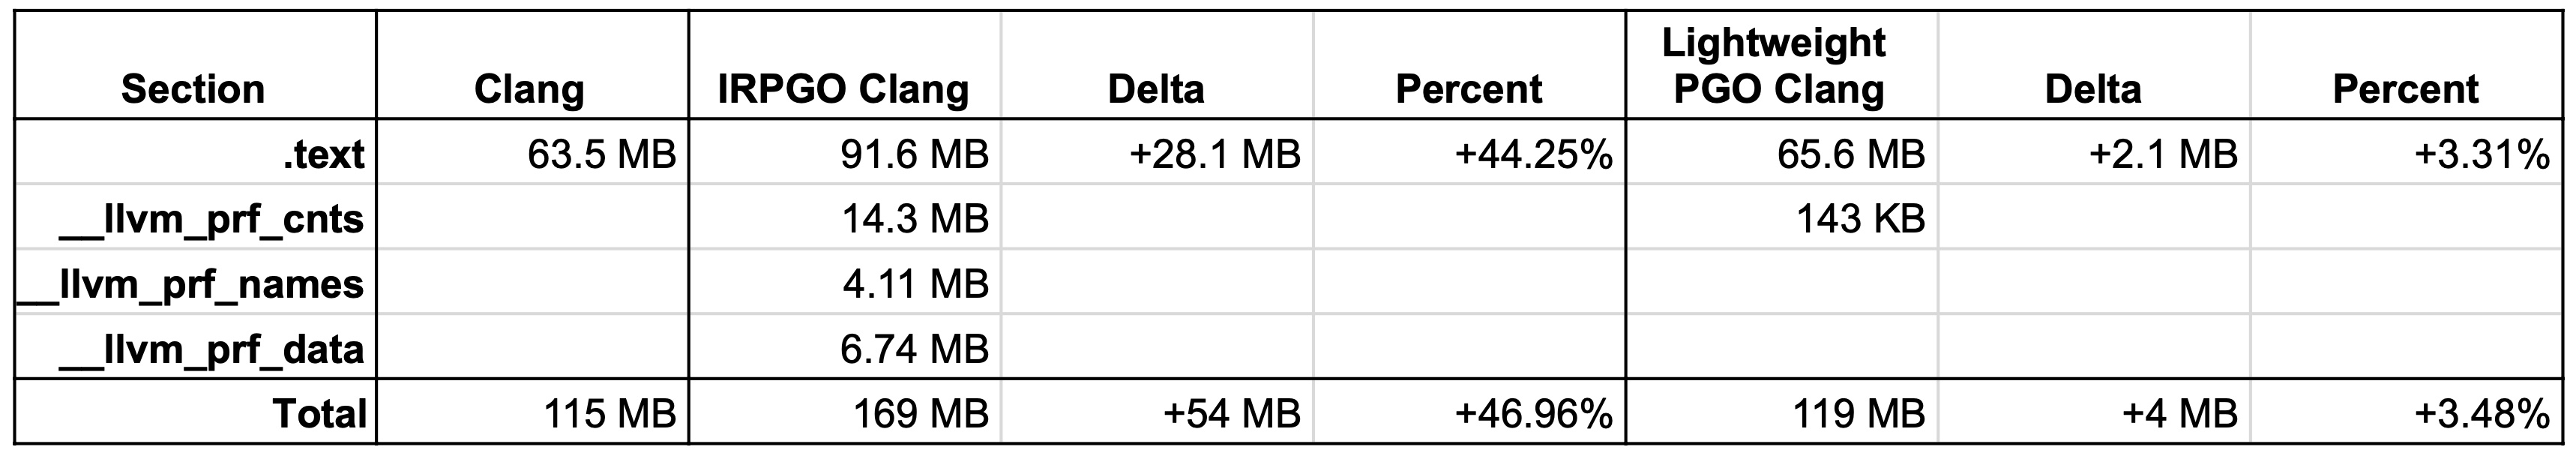
We have a proof of concept using dwarf as the extractable metadata and single byte function coverage instrumentation. We measured code size by building Clang with and without instrumentation using -Oz and no value profiling. Our lightweight instrumented Clang binary is only +4 MB (+3.48%) larger than a non-instrumented binary. We compare this with today’s PGO instrumentation Clang binary which is +54 MB (+46.96%) larger. If we used debug info to correlate normal instrumentation (without value profiling) instead of just function coverage then we would expect to see an overhead of +43.2 MB (+37.5%). We don’t have performance data on clang experiments using the prototype since not all components are implemented. However, an alternative implementation earlier (similar to MIP) delivered good performance boost for mobile applications.

Wenlei He via llvm-dev
> While dwarf is a standard way of program annotation, using it for instrumentation PGO does mean an additional dependency (instead of being self contained).
I think your point on having debug info as dependency is fair. But given most release builds need to generate debug info anyways, this dependency seems to be a minor downside. Hence the tradeoff between extra dependency and minimum binary size can be worthwhile. In the end, this does not “regress” an existing feature by adding extra dependency – i.e. it doesn’t affect today’s IRPGO; and the actual dependency, the debug info is already commonly used. Hope this is an acceptable trade-off.
> This proposal requires debug_type info to be emitted, right? What is the object size and compile time overhead? If this can be trimmed, it is a reasonable way to emit the profile data mapping information at compile time.
We don’t really require debug_type, so yes it can be trimmed as a dependency. However, in practice whether we should trim it also depends on whether it makes sense from dwarf perspective, and if it’s worth a new mode/variant for dwarf info. I tend it view the trimming of debug_type as orthogonal to this proposal – as long as we keep the lightweight PGO technically independent of debug types, the trimming can be done later if it’s appropriate from debug info perspective and when the actual use case arises.
Thanks,
Wenlei
Xinliang David Li via llvm-dev
> While dwarf is a standard way of program annotation, using it for instrumentation PGO does mean an additional dependency (instead of being self contained).
I think your point on having debug info as dependency is fair. But given most release builds need to generate debug info anyways, this dependency seems to be a minor downside. Hence the tradeoff between extra dependency and minimum binary size can be worthwhile. In the end, this does not “regress” an existing feature by adding extra dependency – i.e. it doesn’t affect today’s IRPGO; and the actual dependency, the debug info is already commonly used. Hope this is an acceptable trade-off.
> This proposal requires debug_type info to be emitted, right? What is the object size and compile time overhead? If this can be trimmed, it is a reasonable way to emit the profile data mapping information at compile time.
We don’t really require debug_type, so yes it can be trimmed as a dependency. However, in practice whether we should trim it also depends on whether it makes sense from dwarf perspective, and if it’s worth a new mode/variant for dwarf info. I tend it view the trimming of debug_type as orthogonal to this proposal – as long as we keep the lightweight PGO technically independent of debug types, the trimming can be done later if it’s appropriate from debug info perspective and when the actual use case arises.