Kernel density (50% core area and 95% home range) using QGis
8,349 views
Skip to first unread message

Thibaut Bouveroux
Nov 18, 2016, 5:58:06 AM11/18/16
to GIS In Ecology Forum
Hi all,
Is someone know how to set up in QGis the 50% and 95% kernel density? I can only get a heat map (kernel density analysis) but, don't know how to set up the options to get the 50% (core area) and 95% (home range) density.
Thanks for the help!

GIS in Ecology
Nov 23, 2016, 5:55:13 AM11/23/16
to GIS In Ecology Forum
Hi Thibaut,
It looks like the best way to do extract 50% and 95% percentage volume contours from a KDE in QGIS is to use the following procedure:
1. Use the POINT SAMPLING TOOL (you will need to enable this as a plug in) to extract values from your kernel density estimate raster data layer to your original point data layer used to create it.
2. Open the attribute table of your point data layer and sort the data descending based on the extracted values from your KDE.
3. Take the total number of points in your data set and multiply it by 0.5. This will give you the 50% threshold value.
4. Use the GRASS RECLASS tool to relcassify your KDE raster data layer based on this threshold value. Reclassify any cells with a value under the threshold as 0 and any cells with a value equal to or greater than the threshold value as 1. You can find more information about how to use this tool here: http://gis.stackexchange.com/questions/121532/how-to-reclass-a-raster-with-reclassify-grid-values-in-qgis
5. Use the POLYGONIZE tool (on the main menu bar select RASTER> CONVERSION> POLYGONIZE (RASTER TO VECTOR)) to turn your reclassified raster data layer into a polygon data layer.
6. Edit the resulting polygon data layer to remove the polygons with a reclass value 0.
7. Repeat step 3, but multiplying the total number of points by 0.95 (to give you the 95% threshold value), and then repeat steps 4 - 6.
This is also the approach I'd recommend in ArcGIS, but you may also find tools in Geospatial Modelling Environment (GME) and in R. You may also find this post useful when converting your reclassified raster data layer into polygons: http://gis.stackexchange.com/questions/193233/convert-raster-to-smooth-contour-polygons-in-qgis.
I hope this helps.
All the best,
Colin

leopar...@gmail.com
Sep 15, 2017, 12:28:02 PM9/15/17
to GIS In Ecology Forum
Hi. I have tried this method and it worked well for the 50% KDE but when I try the 95% KDE there are no zero calues in the attributes table of my polygon to delete. Which means I am basically getting the same result as a 100% KDE? Or ami missing something. I am very new to QGIS!
Thanks in advance for any help.
Regards
Maxine
Thanks in advance for any help.
Regards
Maxine
leopar...@gmail.com
Sep 15, 2017, 12:28:51 PM9/15/17
to GIS In Ecology Forum
Sorry previous post of mine should have read zero values not zero clues
Regards
Maxine
Regards
Maxine
GIS in Ecology
Sep 18, 2017, 6:01:31 AM9/18/17
to GIS In Ecology Forum
Hi Maxine,
There's two probable reasons for this. The first is down to the sample size that you are using to generate your KDE. If yo have a relatively small sample size, then this can make it difficult to correctly identify the threshold for the 95% PVC (which is another name for the 95% KDE). What sample size are you using for making your KDEs?
The second issue may be down to the values you have used to create your KDE in the first place. For example, if the smoothing parameter (also known as h, the bandwidth and the search radius) is too big, you will be smoothing your data out too much and this may mean that yo don't have enough variation to accurately find the edges of the home range or the 95% KDE. Similarly, if your extent is too small, you may find that you don't have any areas that fall outside the range of your individual animal.
The extent is relatively easy to sort out as you can simply set it to cover a larger area. If you need to choose a more appropriate smoothing parameter, this can be more difficult, but I would recommend the approach outlined by Kie 2013 (which you can find here: https://animalbiotelemetry.biomedcentral.com/articles/10.1186/2050-3385-1-13).
I hope this helps, and if it doesn't, feel free to post back on this thread and I'll see what else I can suggest.
All the best,
Colin
Maxine Gaines
Sep 19, 2017, 4:49:20 AM9/19/17
to gis-in-eco...@googlegroups.com
Hello Colin
Thank you for your help with this!!
My data comes from GPS locations of sightings of individual Black Rhino, not from collared animals so the number of locations per individual animal are relatively low I would imagine. Between 100 to 300 locations per animal but mostly between 100 and 200 locations. Is this too few sightings for this type of analysis? I have not had much luck with the animove plugin in QGIS, keep getting an error report that I can't get to the bottom of, so I am stuck with using Heatmap, thus was so happy to come accross your explanation of how to work out the 50% and 95% KDE.
In the meantime I will play with the bandwidth and have a read of the article that you suggested. I really appreciate your input on this as GIS in general is quite new to me
Regards
Maxine
--
-- ======================================================================
You received this message because you are subscribed to the "GIS In Ecology Forum" discussion group (http://www.gisinecology.com/GIS_in_Ecology_forum.htm).
To control how often you get emails from this group, go to http://groups.google.com/group/gis-in-ecology-forum/subscribe (you will need to log on to get to this page).
To post to this group, either log onto the group's home page or send an email to
gis-in-ecology-forum@googlegroups.com.
The rules for posting to this group can be found here: http://groups.google.com/group/gis-in-ecology-forum/browse_thread/thread/df31a0822742203f#.
To unsubscribe from this group, email:
gis-in-ecology-forum+unsub...@googlegroups.com
All information on this forum is provided on an 'as is' basis. GIS In Ecology is not responsible for checking the accuracy or suitability of any posting or response.
======================================================================
---
You received this message because you are subscribed to a topic in the Google Groups "GIS In Ecology Forum" group.
To unsubscribe from this topic, visit https://groups.google.com/d/topic/gis-in-ecology-forum/-k6fHpJfcRQ/unsubscribe.
To unsubscribe from this group and all its topics, send an email to gis-in-ecology-forum+unsub...@googlegroups.com.
For more options, visit https://groups.google.com/d/optout.
GIS in Ecology
Sep 19, 2017, 5:01:53 AM9/19/17
to GIS In Ecology Forum
Hi Maxine,
100+ records should be more than enough to calculate a home range using a KDE (generally the minimum recommended sample size is somewhere around 30 so you're way over that). So, I would concentrate on the settings used to generate the KDE, and particularly the cell size (generally smaller is better), the extent (make sure it's quite a bit bigger than the maximum spread of your data) and the smoothing parameter (as mentioned previously). It's also worth checking all your projection/coordinate systems for your project and your data layers just to make sure there isn't an issue there.
In terms of the tool to use in QGIS, the Heatmap tool should work just fine and give you similar results to other similar tools, like Animove.
If you are still getting problems with identifying the 95% PVC and can't work otu what's going on, then feel free to post back on this thread and I'll see what else I can suggest.
All the best,
Colin
PS If you need a citation for the method of working out the 50% and 95% PVCs, its MacLeod, C.D. 2014. An Introduction To Using GIS In Marine Biology: Supplementary Workbook Four:Investigating Home Ranges Of Individual Animals.
The instructions in that workbook are for ArcGIS, but it's exactly the same method that I recommend for QGIS for calculating 50% and 95% PVCs, and when i was writing it, I couldn't find any other references that explicitly stated how to do this.

James Grecian
Sep 20, 2017, 12:11:13 PM9/20/17
to gis-in-eco...@googlegroups.com
Hi Maxine,
We had a paper talking about rhino home ranges published last year and I did a bit of work on assessing KDEs with small numbers of fixes. You can access the papers here, happy to answer any questions if you have them.
Best,
James
-------------------------------------
Dr James Grecian
Dr James Grecian
Sea Mammal Research Unit
Scottish Oceans Institute
University of St Andrews
KY16 8LB
Twitter: @JamesGrecian
Web: jamesgrecian.com
--
-- ======================================================================
You received this message because you are subscribed to the "GIS In Ecology Forum" discussion group (http://www.gisinecology.com/GIS_in_Ecology_forum.htm).
To control how often you get emails from this group, go to http://groups.google.com/group/gis-in-ecology-forum/subscribe (you will need to log on to get to this page).
To post to this group, either log onto the group's home page or send an email to
The rules for posting to this group can be found here: http://groups.google.com/group/gis-in-ecology-forum/browse_thread/thread/df31a0822742203f#.
To unsubscribe from this group, email:
All information on this forum is provided on an 'as is' basis. GIS In Ecology is not responsible for checking the accuracy or suitability of any posting or response.
======================================================================
---
You received this message because you are subscribed to the Google Groups "GIS In Ecology Forum" group.
To unsubscribe from this group and stop receiving emails from it, send an email to gis-in-ecology-f...@googlegroups.com.
Maxine Gaines
Sep 23, 2017, 5:36:20 AM9/23/17
to gis-in-eco...@googlegroups.com
Thank you Colin and James for your help.
James I had read your excellent paper previously and found it very helpful. Thank you. My area of research is the Mun-ya-wana Game Reserve which is a Private Game Reserve very close to Hluhluwe-iMfolozi. So similar climate and habitat in areas. The data for each Black Rhino were not collected annually, but is actually an accumulation of a few years of sightings. This may have an influence on home range size and make it appear larger than other comparative studies. I will try look at smaller sample sizes that correspond to a year of sightings, but suspect that my sample sizes may then indeed be too small for kernel density estimation.
Colin thank you for the citation for the method that you suggested. All help is much appreciated. I will be experimenting with larger bandwidths and will let you know if this helps. My bandwidth was chosen by referencing work done in a similar area on black rhino, but I see now that it is far too small and is producing multiple contours around individual points. I will work on this over the next few days and will be in contact again if I run into further problems.
Once again thank you for all the advice and input. It is invaluable and really much appreciated.
Regards
Maxine
Sent from my iPhone
You received this message because you are subscribed to a topic in the Google Groups "GIS In Ecology Forum" group.
To unsubscribe from this topic, visit https://groups.google.com/d/topic/gis-in-ecology-forum/-k6fHpJfcRQ/unsubscribe.
To unsubscribe from this group and all its topics, send an email to gis-in-ecology-f...@googlegroups.com.

Andreia T. Pereira
Feb 2, 2018, 6:00:48 AM2/2/18
to GIS In Ecology Forum
Hi!
I already read and tried to do the procedure described in the previous post but but I got stuck on task 5. When i did the polygonize it did not seem to me that it was well done because when I open the attribute table it only appears a column with 9 total points with values of 0 and 1.
I also do not know how i can to remove the zero values in task 5
someone can help me?
Sorry I'm pretty new at QGIS but I'm trying to do my best
Thank you
Andreia Pereira
GIS in Ecology
Feb 2, 2018, 6:10:43 AM2/2/18
to GIS In Ecology Forum
Hi Andreia,
It is okay if you still have polygons with a zero value in the attribute table at the end of step 5. These are deleted in step 6. To do this, open the attribute table of your polygon data layer,and the click the TOGGLE EDITING button (it as a picture of a pencil on it). Next, select all the lines in the attribute table with a value of zero, and then delete them using the DELETE button. Once you have done this, save the edits and then click on the TOGGLE EDITING button again. This should leave you with just the polygons with a value of 1 (which are those with a KDE value above the threshold you set in step 4).
Note: In the original instructions, step three wasn't particularly clear. To get the threshold value for use in step 4, after you have sorted the points descendingly, scroll down to find the point in the table that has a row number equal to the total number of points times 0.5. You can then read off the KDE value for this point, and that is your 50% threshold value.
I hope this helps and solves the problem you are having with this, If not, just post back on this thread.
All the best,
Colin

lisagr...@gmail.com
Aug 27, 2018, 4:56:12 AM8/27/18
to GIS In Ecology Forum
Hi all,
I've found this post incredibly useful so thank you all for your input. I too am a novice with QGIS and am working to try and get MCPs and 50% and 90% KDEs for a load of individual animals within a reserve.
For the KDE, I've followed the steps described in the initial response and I have two problems (so far!)
1. When I perform step 3 my value of 50% threshold is 74.21. Does that sound reasonable? My issues are A) I have no idea what the units are for this, and B) with regards to units, I'm using WGS84 so my map units are going to be in degrees, which I assume is the units for this value. If so, must I change the project to UTM (I'm in South Africa) in order to be working in metres? I'm not sure how to do that in QGIS.
2. I'm working in QGIS 2.18.20 and GRASS RECLASS does not want to work (something to do with GRASS 7 not being properly installed) and my Plugin Repository status is "unavailable". I've looked at various forums and it seems to be a common problem and not really as solvable one. Any solutions you know of? Do I need to upgrade to QGIS 3, and if I do this will my current projects be functional?
One consideration I had is whether I can use CONTOUR function to create the 50% and 90% KDEs?
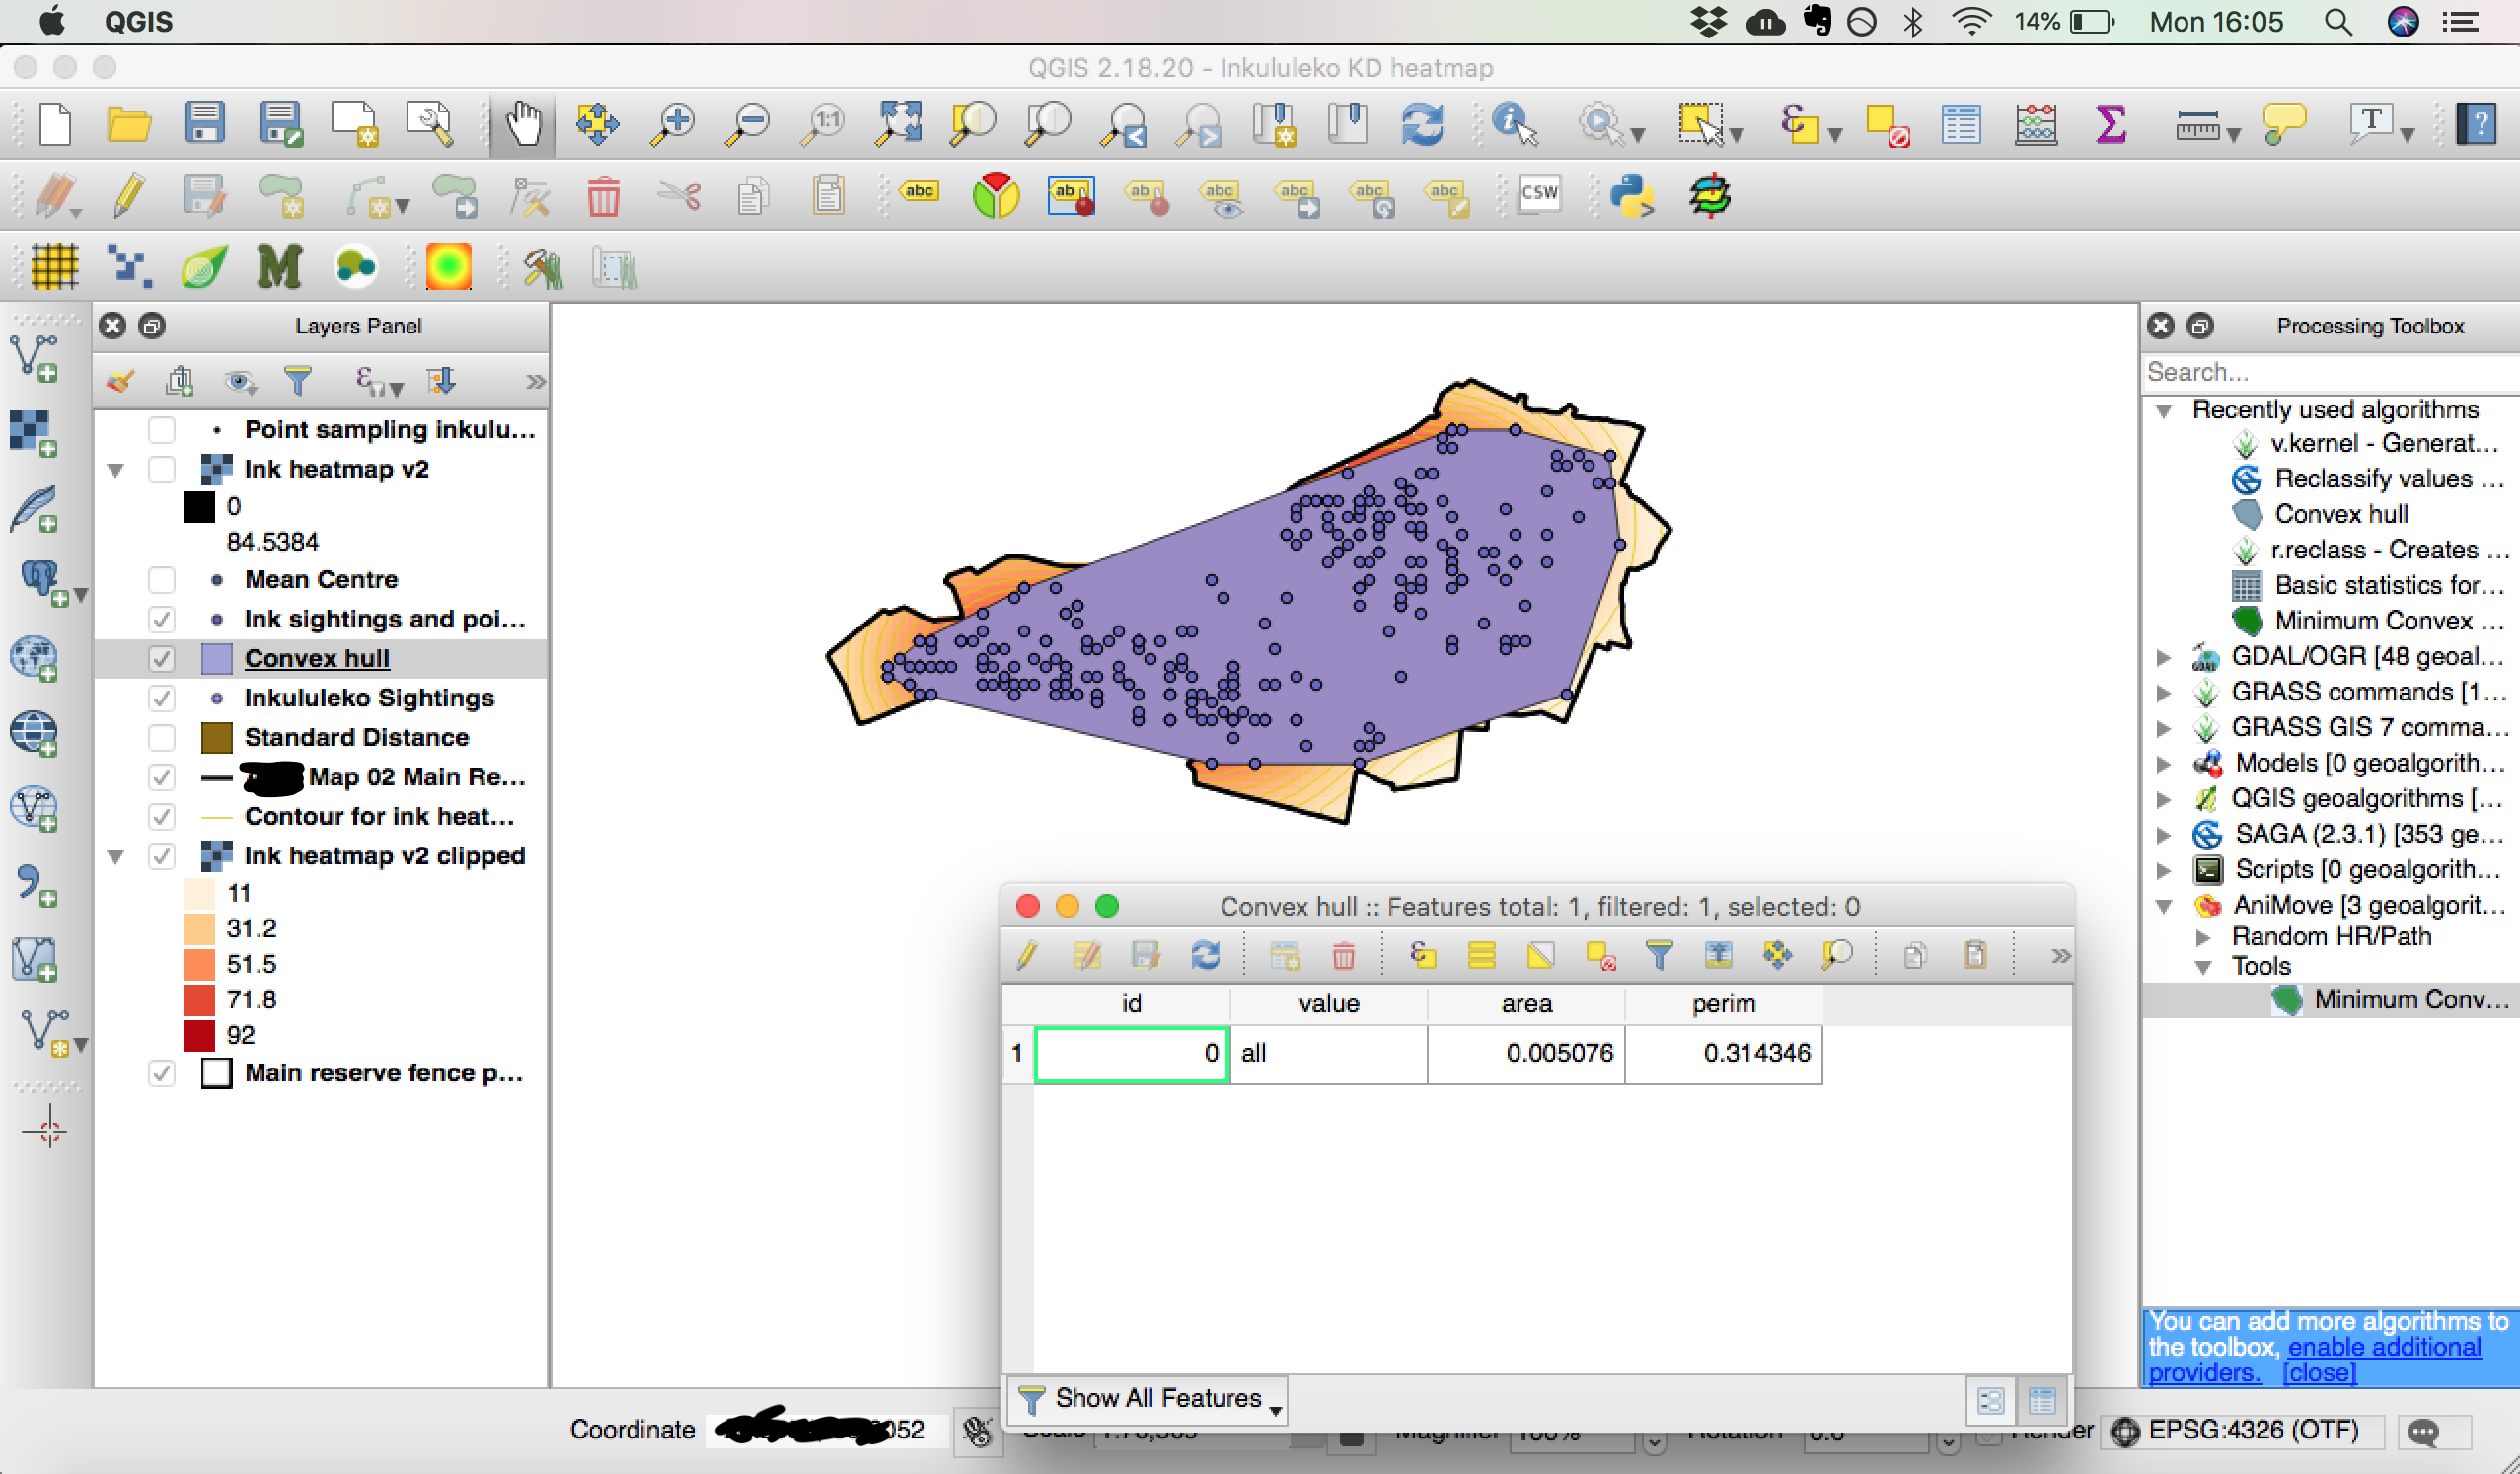
I also created a MCP using initially the Animove plugin, but also with the Vector>Geoprocessing tools>Convex hull, and the values are coming out as area: 0.005076, perimeter: 0.314346 (see screenshot of purple MCP with attribute table included). Surely this can't be right. I'm assuming its the same issue as above with regards to units of my map. The other problem I have with this is that the polygon created goes outside of the perimeter fence/study area, where the animals can't actually go obviously. I managed to clip my heat map according to the fenceline but is it possible to set barriers for the MCP?
Apologies if these are all showing my utter ignorance with QGIS!
I'm on a tight time deadline now because of all sorts of problems with data collection so I would be hugely grateful for any help with this.
Best,
Lisa

Chavoux Luyt
Sep 3, 2018, 5:53:29 AM9/3/18
to gis-in-eco...@googlegroups.com
1. When I perform step 3 my value of 50% threshold is 74.21. Does that sound reasonable? My issues are A) I have no idea what the units are for this, and B) with regards to units, I'm using WGS84 so my map units are going to be in degrees, which I assume is the units for this value. If so, must I change the project to UTM (I'm in South Africa) in order to be working in metres? I'm not sure how to do that in QGIS.
You are absolutely correct. On a single reserve UTM is probably the best choice and will give you useful results in meters. What I do to convert my layers, is to rightclick on the layers (one by one), Click "Save as", choose the CRS (projection = UTM in your case) in which you want to save it, and then save it with a new name (either in a different directory or with the projection included as part of the file name, so I don't get confused later). Then I create a new project with the correct CRS (e.g. UTM) and add the layers again one by one. There might be a shorter way, especially since qGIS has improved a lot in recent years doing re-projections "on-the-fly", but I prefer this way since I know it works.
2. I'm working in QGIS 2.18.20 and GRASS RECLASS does not want to work (something to do with GRASS 7 not being properly installed) and my Plugin Repository status is "unavailable". I've looked at various forums and it seems to be a common problem and not really as solvable one. Any solutions you know of? Do I need to upgrade to QGIS 3, and if I do this will my current projects be functional?
I cannot help you with the qGIS 3, since I am still on 2.18.11 myself. However, I am not sure how stable GRASS is on Windows (I assume you are using Windows and not Linux)? When I first used it, the only way to get the full functionality of GRASS was to run it on Linux/UNIX. It will also depend on how you installed qGIS. I think there are Window "bundles" (QGIS-OSGeo4W-*) that include most/all the plugins for qGIS and will probably include GRASS as well. Otherwise, just switch to Linux (Ubuntu is popular at Stellenbosch University, but OpenSUSE was the easiest Linux version for me to get going with - Debian is my current distro of choice) and you can install it all from the package manager when online.
One consideration I had is whether I can use CONTOUR function to create the 50% and 90% KDEs?I also created a MCP using initially the Animove plugin, but also with the Vector>Geoprocessing tools>Convex hull, and the values are coming out as area: 0.005076, perimeter: 0.314346 (see screenshot of purple MCP with attribute table included). Surely this can't be right. I'm assuming its the same issue as above with regards to units of my map.
Yes.
The other problem I have with this is that the polygon created goes outside of the perimeter fence/study area, where the animals can't actually go obviously. I managed to clip my heat map according to the fenceline but is it possible to set barriers for the MCP?
I am not sure if you can actually set barriers beforehand, but you should be able to clip it afterwards to the park area using intersection (Vector->Geoprocessing Tools->Intersection).
Hope this helps (HTH).
Regards,
Chavoux
GIS in Ecology
Sep 3, 2018, 8:04:31 AM9/3/18
to GIS In Ecology Forum
Hi Lisa,
>>1. When I perform step 3 my value of 50% threshold is 74.21. Does that sound reasonable? My issues are A) I have no idea what the units are for this, and B) with regards to units, I'm using WGS84 so my map units are going to be in degrees, which I assume is the units for this value. If so, must I change the project to UTM (I'm in South Africa) in order to be working in metres? I'm not sure how to do that in QGIS.
Firstly, you will need to transform all your data into a true projection, such as an appropriate UTM before you do any of your home range analysis and data processing. Secondly, the threshold value is an estimated density of individuals per grid cell from the KDE, and not a distance measure. Whether 74.2 is appropriate for your data will depend on your specific analysis and it's not something that someone else can tell you. This is because it is the density value from your KDE that contains 50% of your observations.
2. I'm working in QGIS 2.18.20 and GRASS RECLASS does not want to work (something to do with GRASS 7 not being properly installed) and my Plugin Repository status is "unavailable". I've looked at various forums and it seems to be a common problem and not really as solvable one. Any solutions you know of? Do I need to upgrade to QGIS 3, and if I do this will my current projects be functional?
You could try upgrading to QGIS 3, but his might not solve the issue. The other alternative is to downgrade to an earlier version where these tools are known to work. Either way, you will probably need to rebuild your project, but remember that all your data layers exist independently of your project, so you can just load these in again, rather than having to re-make them.
One consideration I had is whether I can use CONTOUR function to create the 50% and 90% KDEs?
You probably shouldn't as this would give you lines rather than he polygons you need to work with home ranges.
I also created a MCP using initially the Animove plugin, but also with the Vector>Geoprocessing tools>Convex hull, and the values are coming out as area: 0.005076, perimeter: 0.314346 (see screenshot of purple MCP with attribute table included). Surely this can't be right. I'm assuming its the same issue as above with regards to units of my map. The other problem I have with this is that the polygon created goes outside of the perimeter fence/study area, where the animals can't actually go obviously. I managed to clip my heat map according to the fenceline but is it possible to set barriers for the MCP?
Again, only you can tell if the numbers you are getting are appropriate for your specific project. However if you are wishing to incorporate barriers when creating your MCPs, you might be better of using Alpha Hulls rather than Convex hulls to estimate your MCP. Alternatively, as long as the barriers are enclosing your entire study area, rather tan representing barriers to movement within it, you could probably get away with the clipping approach you have used so far.
I hope this helps.
All the best,
Colin

JOHN CHAN
Feb 26, 2019, 5:57:06 AM2/26/19
to GIS In Ecology Forum
Recently, I am looking on a package called AniMov in QGIS 2.X.
The way to get the 95% or 50% home range is by normalising the z value (density) by the maximum value of z. So, the 95% home range will be z >= 0.05, and 50% home range will be z>=0.5

Kateřina Gašparova
Sep 20, 2019, 5:10:01 AM9/20/19
to GIS In Ecology Forum
Dear Colin
thank you for your manual. Same as most of people here I need to estimate the Home range. I got lost in point 3. I do not understand what total number I should multiply by 0.5. Please can you explain it in detail?
Thank you,
Kateřina
Dne středa 23. listopadu 2016 11:55:13 UTC+1 GIS in Ecology napsal(a):Message has been deleted
GIS in Ecology
Sep 20, 2019, 5:27:54 AM9/20/19
to GIS In Ecology Forum
Hi Katerina,
Thanks for your post. In terms of step 3 of this method, the idea here is that you use your original point data layer to generate the threshold value for your 50% PVC.
To do this, once you have completed steps 1 and 2 (which involve linking your KDE values to your the original data set used to built it), if you then open the attribute table, you can work out the appropriate threshold value.
To do this, find the total number of data points you used to create your KDE (these will be the locations of your individual or species). This will be give at the top of your attribute table window, if you are using QGIS, or at the bottom, if you are using ArcGIS. Once you have this number, multiply it by 0.5. This will give you the record number you are looking for. However, before you can look at the KDE value for this record number in your attribute table, you need to sort the data based on the KDE so it goes from the highest KDE value to the lowest. Once yo have done this, you can scroll down to the record number given by multiplying the total number of data points and read off the KDE value for this point. This will give you the threshold value for calculating the 50% PVC.
I hope this explains this step in sufficient detail for you. If not, just reply back to this message and I can try explaining it in a different way.
All the best,
Colin
Reply all
Reply to author
Forward
0 new messages