Fwd: Informal spectrum survey
21 views
Skip to first unread message

David Bern
Oct 31, 2014, 5:47:00 AM10/31/14
to Mark Braunstein WA4KFZ, BOAR-net
Mark:
I am sharing your informal spectrum survey with others on the BOAR-net Google Group
Thank you for doing this professional microwave spectrum survey in the Washington, DC area. It shows that the spectrum at 3.4 GHz is much cleaner than at 5.8 GHz. For your convenience, I've attached plots in the ham bands at 2.4 GHz, 3.4 GHz and at 5.8 GHz -- see attached.
Thank you,
David, W2LNX
-------- Forwarded Message --------
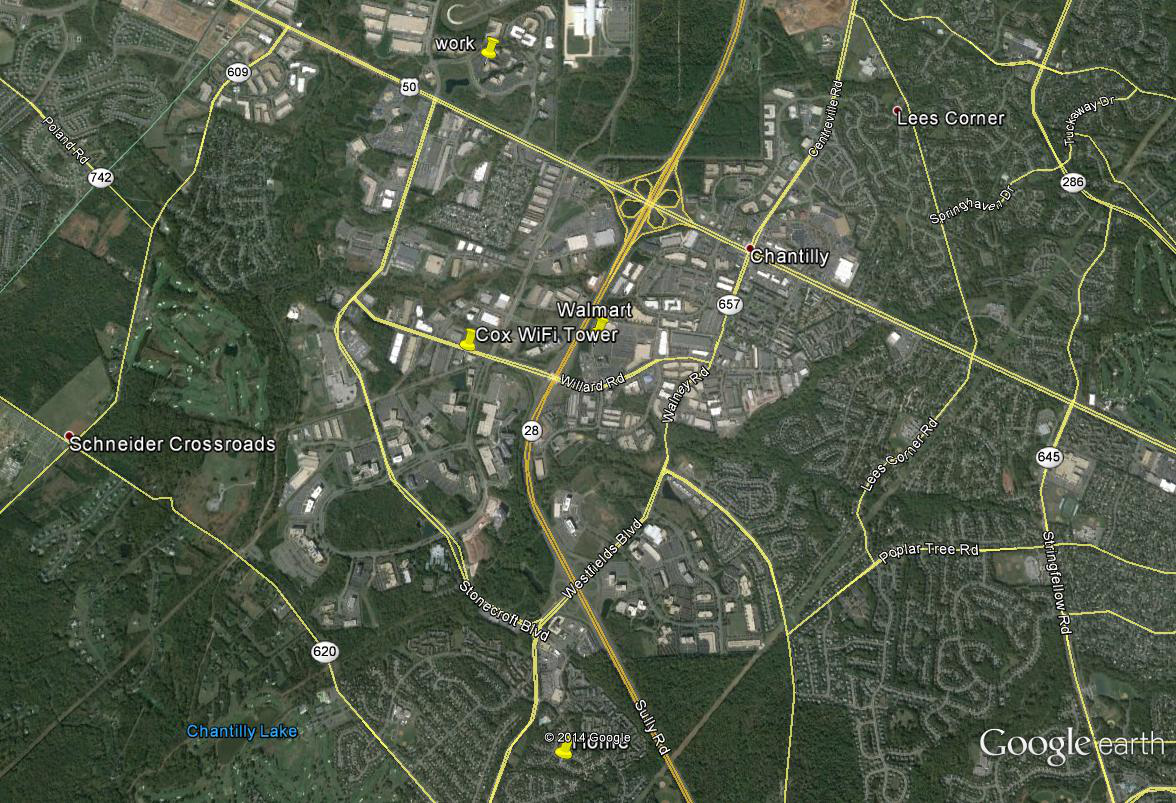
Earlier this week, I borrowed a spectrum analzyer and wideband discone antenna (1-6GHz) from work and drove to three locations in order to get a sense of what the interference environment looks like. The measurements were made in the 2.4GHz, 3.4GHz and 5.8GHz bands. The sweeps extended 100 MHz below, and 100MHz above, the amateur allocations for each band. The allocations pertain to all three ITU regions. The spectrum analyzer was set to "max hold" and I recorded at least 3 minutes of environmental activity. The analyzer's displayed average noise level was around -90dBm, which encompasses the minimum levels that BBHN equipment typically see. The Home measurements were conducted on my deck. The Work and Walmart measurements were conducted with the analyzer on the trunk of my car.
Needless to say, the 2.4GHz spectrum is heavily occupied!On top of that, Cox Communications has setup a high-power WiFi distribution system nearby, further contaminating the environment. The signals at 2.4GHz were so strong that, in actuality, they extended past the reference level of the spectrum analyzer (i.e., at least 40-50dB above the displayed noise level).
The Excel spreadsheets contain 550 measurement points, so each measurement is just over 1 MHz apart. You can re-plot the data to see how things look inside any particular portion of the spectrum.

We definitely need to get out of the conventional 2.4GHz allocations!
I am sharing your informal spectrum survey with others on the BOAR-net Google Group
http://groups.google.com/group/boar-netwhich you are welcome to join.
Thank you for doing this professional microwave spectrum survey in the Washington, DC area. It shows that the spectrum at 3.4 GHz is much cleaner than at 5.8 GHz. For your convenience, I've attached plots in the ham bands at 2.4 GHz, 3.4 GHz and at 5.8 GHz -- see attached.
Thank you,
David, W2LNX
-------- Forwarded Message --------
| Subject: | Informal spectrum survey |
|---|---|
| Date: | Thu, 18 Sep 2014 23:35:47 -0400 |
| From: | Mark Braunstein WA4KFZ <wa4...@cox.net> |
| To: | ... |
| CC: | ... |
Earlier this week, I borrowed a spectrum analzyer and wideband discone antenna (1-6GHz) from work and drove to three locations in order to get a sense of what the interference environment looks like. The measurements were made in the 2.4GHz, 3.4GHz and 5.8GHz bands. The sweeps extended 100 MHz below, and 100MHz above, the amateur allocations for each band. The allocations pertain to all three ITU regions. The spectrum analyzer was set to "max hold" and I recorded at least 3 minutes of environmental activity. The analyzer's displayed average noise level was around -90dBm, which encompasses the minimum levels that BBHN equipment typically see. The Home measurements were conducted on my deck. The Work and Walmart measurements were conducted with the analyzer on the trunk of my car.
Needless to say, the 2.4GHz spectrum is heavily occupied!On top of that, Cox Communications has setup a high-power WiFi distribution system nearby, further contaminating the environment. The signals at 2.4GHz were so strong that, in actuality, they extended past the reference level of the spectrum analyzer (i.e., at least 40-50dB above the displayed noise level).
The Excel spreadsheets contain 550 measurement points, so each measurement is just over 1 MHz apart. You can re-plot the data to see how things look inside any particular portion of the spectrum.
We definitely need to get out of the conventional 2.4GHz allocations!
--
73,

Mark D. Braunstein WA4KFZ
Ole Virginia Hams

Keith
Oct 31, 2014, 5:59:55 AM10/31/14
to boar...@googlegroups.com
David,
It is unusual, since your vacation, I have not gotten the calls and email from you I have become accustom to, will you be coming up on Saturday for the work on Dick's equipment?
Keith
It is unusual, since your vacation, I have not gotten the calls and email from you I have become accustom to, will you be coming up on Saturday for the work on Dick's equipment?
Keith
--
The next generation of communications technology in the Amateur Radio service!
Broadband Over Amateur Radio Networks
---
You received this message because you are subscribed to the Google Groups "BOAR-Net" group.
To unsubscribe from this group and stop receiving emails from it, send an email to boar-net+u...@googlegroups.com.
To post to this group, send email to boar...@googlegroups.com.
Visit this group at http://groups.google.com/group/boar-net.
For more options, visit https://groups.google.com/d/optout.
0 new messages