QtGraphicsPathItem Auto Range problems
436 views
Skip to first unread message

Will Parkin
Aug 14, 2013, 4:59:13 PM8/14/13
to pyqt...@googlegroups.com
Hello,
Thank you for pyqtgraph, it's nice!
I have a rather large pyside gui with several PlotWidgets embedded. These PlotWidgets receive new data frequently from a worker thread, and the only way to keep my gui responsive was to use this fast plot method, which you posted in an earlier topic.
The only problem, when I add QtGui.QGraphicsPathItem, the plot auto scale is not useful for small y values. When I run the below code, the plot looks fine for yscale=0.8. However, when yscale=0.8e-9 the image below is produced. Is there any way around this?
import PySide
import pyqtgraph as pg
from pyqtgraph.Qt import QtCore, QtGui
import numpy as np

app = pg.mkQApp()
plt = pg.PlotWidget()

app.processEvents()

## Putting this at the beginning or end does not have much effect
plt.show()

def fastPlot():
    ## Different approach:  generate a single item with all data points.
    ## This runs about 20x faster.
    pg.setConfigOption('leftButtonPan', False)
    start = pg.ptime.time()
    n = 1
    pts = 10000
    x = np.linspace(0, 0.8, pts)
    yscale = 0.8
    # yscale = 0.8e-9
    y = np.random.random(size=pts)*yscale
    xdata = np.empty((n, n, pts))
    xdata[:] = x.reshape(1,1,pts) + np.arange(n).reshape(n,1,1)
    ydata = np.empty((n, n, pts))
    ydata[:] = y.reshape(1,1,pts) + np.arange(n).reshape(1,n,1)
    conn = np.ones((n*n,pts))
    conn[:,-1] = False # make sure plots are disconnected
    path = pg.arrayToQPath(xdata.flatten(), ydata.flatten(), conn.flatten())
    item = QtGui.QGraphicsPathItem(path)
    item.setPen(pg.mkPen('w'))
    plt.addItem(item)

    dt = pg.ptime.time() - start
    print "Create fast plots took: %0.3fms" % (dt*1000)

## Plot and clear 5 times, printing the time it took
if hasattr(pg, 'arrayToQPath'):
    n = 1000
    start = pg.ptime.time()
    for i in range(20000):
        plt.clear()
        fastPlot()
        plt.autoRange()
        app.processEvents()
        print (i/(pg.ptime.time()-start))

else:
    print "Skipping fast tests--arrayToQPath function is missing."


plt.autoRange()


## Start Qt event loop unless running in interactive mode or using pyside.
if __name__ == '__main__':
    import sys
    if (sys.flags.interactive != 1) or not hasattr(QtCore, 'PYQT_VERSION'):
        QtGui.QApplication.instance().exec_()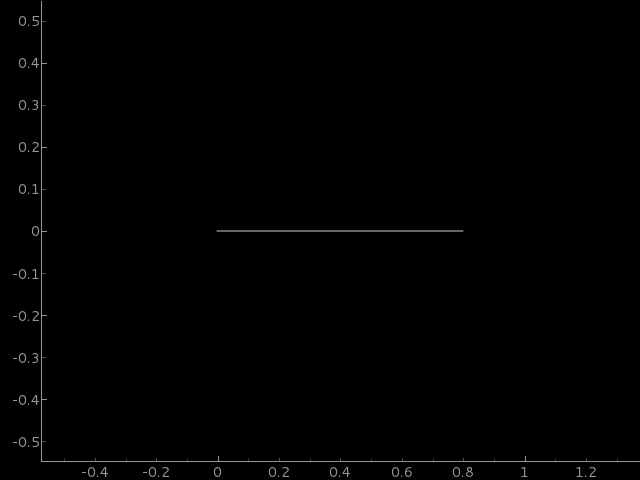

Luke Campagnola
Aug 15, 2013, 3:16:16 AM8/15/13
to pyqt...@googlegroups.com
The problem is that that QGraphicsPathItem.boundingRect() is returning a rect with no height, presumably because Qt has decided that 1e-9 is unnecessary precision. An easy fix is to make your own class that implements the dataBounds method (when determining auto range, ViewBox first tries this method, followed by boundingRect):
class PathItem(QtGui.QGraphicsPathItem):def __init__(self, x, y, conn):self._range = [[x.min(), x.max()], [y.min(), y.max()]]
self.path = pg.arrayToQPath(x.flatten(), y.flatten(), conn.flatten())QtGui.QGraphicsPathItem.__init__(self, self.path)def dataBounds(self, ax, frac=1.0, orthoRange=False):return self._range[ax]
Luke
--
-- [ You are subscribed to pyqt...@googlegroups.com. To unsubscribe, send email to pyqtgraph+...@googlegroups.com ]
---
You received this message because you are subscribed to the Google Groups "pyqtgraph" group.
To unsubscribe from this group and stop receiving emails from it, send an email to pyqtgraph+...@googlegroups.com.
For more options, visit https://groups.google.com/groups/opt_out.
Will Parkin
Aug 15, 2013, 4:29:58 AM8/15/13
to pyqt...@googlegroups.com
Hmm, almost there. Now after the script has executed, there seems to be an image of an older plot covering up the current plot. I've attached a screenshot of me left-click-dragging a rectangle, exposing the correct data underneath the image. Any idea why this image lingers?
Thanks for the quick response!
import PySide
import pyqtgraph as pg
from pyqtgraph.Qt import QtCore, QtGui
import numpy as np


app = pg.mkQApp()
pg.setConfigOption('leftButtonPan', False)
plt = pg.PlotWidget()


app.processEvents()


## Putting this at the beginning or end does not have much effect
plt.show()
## The auto-range is recomputed after each item is added,
## so disabling it before plotting helps
plt.enableAutoRange(False, False)


class PathItem(QtGui.QGraphicsPathItem):
    def __init__(self, x, y):
self._range = [[x.min(), x.max()], [y.min(), y.max()]]
self.path = pg.arrayToQPath(x, y)
        QtGui.QGraphicsPathItem.__init__(self, self.path)

    def dataBounds(self, ax, frac=1.0, orthoRange=False):
        return self._range[ax]
def fastPlot(s):
    ## Different approach:  generate a single item with all data points.
    ## This runs about 20x faster.
    start = pg.ptime.time()
    n = 1
    pts = 100
    r = 0.8
    x = np.linspace(0, r, pts) + r*s # plot next to the previous plot
    y = np.random.random(size=pts)*0.8e-9
    xdata = np.empty((n, n, pts))
    xdata[:] = x.reshape(1,1,pts) + np.arange(n).reshape(n,1,1)
    ydata = np.empty((n, n, pts))
    ydata[:] = y.reshape(1,1,pts) + np.arange(n).reshape(1,n,1)
    conn = np.ones((n*n,pts))
    conn[:,-1] = False # make sure plots are disconnected
item = PathItem(x,y)
    item.setPen(pg.mkPen('w'))
    plt.addItem(item)

    dt = pg.ptime.time() -
start
print "Create fast plots " + str(s) + " took: %0.3fms" % (dt*1000)
## Plot and clear 5 times, printing the time it took
if hasattr(pg, 'arrayToQPath'):
    for i in range(50):
#         plt.clear()
        fastPlot(i)
        app.processEvents()
else:
    print "Skipping fast tests--arrayToQPath function is missing."


plt.autoRange()


## Start Qt event loop unless running in interactive mode or using pyside.
if __name__ == '__main__':
    import sys
    if (sys.flags.interactive != 1) or not hasattr(QtCore, 'PYQT_VERSION'):
        QtGui.QApplication.instance().exec_()

Luke Campagnola
Aug 16, 2013, 12:04:25 AM8/16/13
to pyqt...@googlegroups.com
On Thu, Aug 15, 2013 at 4:29 AM, Will Parkin <wmpa...@gmail.com> wrote:
Hmm, almost there. Now after the script has executed, there seems to be an image of an older plot covering up the current plot. I've attached a screenshot of me left-click-dragging a rectangle, exposing the correct data underneath the image. Any idea why this image lingers?
Aha, of course I should have predicted this because Qt relies on having a proper boundingRect to determine what part of the scene needs to be redrawn. Here is a better solution:
class PathItem(QtGui.QGraphicsPathItem):def __init__(self, x, y):
xr = x.min(), x.max()yr = y.min(), y.max()self._bounds = pg.QtCore.QRectF(xr[0], yr[0], xr[1]-xr[0], yr[1]-yr[0])
self.path = pg.arrayToQPath(x, y)QtGui.QGraphicsPathItem.__init__(self, self.path)
If you keep having performance issues, I'm happy to discuss other options. Often the best way to optimize depends on the details of how the program operates, so there may be a better solution for your case.def boundingRect(self):return self._bounds
Luke
Will Parkin
Aug 16, 2013, 9:06:52 AM8/16/13
to pyqt...@googlegroups.com
That worked perfectly, thanks for your help!
--
-- [ You are subscribed to pyqt...@googlegroups.com. To unsubscribe, send email to pyqtgraph+...@googlegroups.com ]
---
You received this message because you are subscribed to a topic in the Google Groups "pyqtgraph" group.
To unsubscribe from this topic, visit https://groups.google.com/d/topic/pyqtgraph/gK9xwkmZpTQ/unsubscribe.
To unsubscribe from this group and all its topics, send an email to pyqtgraph+...@googlegroups.com.
Reply all
Reply to author
Forward
0 new messages