Re: [PLOTS] New version of NDVI plugins on GitHub
102 views
Skip to first unread message

Jeffrey Warren
May 24, 2013, 3:14:54 PM5/24/13
to publicla...@googlegroups.com, plots-i...@googlegroups.com, grassroo...@googlegroups.com
Great news, Ned, especially with the Infragram project launching. Can you add a little more info to the near infrared camera page? There's a section under:
http://publiclab.org/wiki/near-infrared-camera#How+to+process+your+images:
Would you consider posting a short wiki page about the PhotoMonitoringPlugin, so that it shows up in searches on the Public Lab site? It could be just a couple sentences and a link to the Github page. I'm happy to help flesh it out.
Jeff
On Fri, May 24, 2013 at 2:49 PM, Ned Horning <ne...@lightlink.com> wrote:
Hi ---
I wanted to let folks know that I just updated the ImageJ NDVI plugin on GitHub: https://github.com/nedhorning/PhotoMonitoringPlugin
I added the following functionality and updated the user guide accordingly.
Add parameter setting to the log file created when running the dual-image plugin
Capability to save settings between run with an option to restore default values
An option to clip or not clip the dual-image plugin output images
Two new plugins to work with single vis/nir images like those created using a superBlue filter
I did some simple testing but it is quite possible that I broke something as I was adding functionality. Please let me know if you notice any problems or if you have suggestions for improvements.
All the best,
Ned
-- Post to this group at publicla...@googlegroups.com. To unsubscribe, email publiclaborato...@googlegroups.com. Options at https://groups.google.com/d/forum/publiclaboratory?hl=en
---
You received this message because you are subscribed to the Google Groups "The Public Laboratory for Open Technology and Science" group.
To unsubscribe from this group and stop receiving emails from it, send an email to publiclaborato...@googlegroups.com.
For more options, visit https://groups.google.com/groups/opt_out.

Chris Fastie
May 24, 2013, 6:29:46 PM5/24/13
to plots-i...@googlegroups.com
The new plugin is terrific. I just ran it through its paces and it performed perfectly. I tried all three options with no problems or hiccups.
Thanks very much Ned for adding all the new features. This tool allows very efficient experimentation, troubleshooting, and documentation. The log file now records all the parameters for each run. Here are the parameters for the last run I just did:
Use backup registration method if primary fails? true
Select primary registration method: SIFT/Landmark correspondences
Select secondary registration method: SIFT/Landmark correspondences using last valid set of points
Select transformation type if using SIFT: Affine
Number of tries for SIFT to find correspondence points: 1
Method to improve SIFT point selection: none
Output image type: jpeg
Output NRG image? true
Clip images? true
Output clipped visible image? true
Output Color NDVI image? true
Minimum NDVI value for scaling color NDVI image: -1.0
Maximum NDVI value for scaling color NDVI image: 1.0
Output floating point NDVI image? true
Stretch the visible band before creating NDVI? true
Stretch the NIR band before creating NDVI? true
Saturation value for stretch: 2.0
Channel from visible image to use for Red band to create NDVI: 3
Channel from IR image to use for IR band to create NDVI: 1
Select output color table for color NDVI image: NDVIBlu2Mag.lut
I also learned that Fiji has a nice graphical tool for editing lookup tables. So I made this one for NDVI:
Everything below zero (to the left) can be distinguished from positive values where the plants should be. The magenta at the right allows troubleshooting of values too high to be plants. This serendipitously seems to flag a lot of the deep shadows that get anomalously high NDVI values.
So I now have the NDVI and NRG aerial images of some of Dorn's new silvapasture manipulation. Research note coming soon (or as soon as I can align lots of images into maps).
Thanks again Ned.

Ned Horning
May 25, 2013, 9:21:19 PM5/25/13
to plots-i...@googlegroups.com
Chris,
If you send me the lut file I can include it on the github site.
Ned
If you send me the lut file I can include it on the github site.
Ned
--
You received this message because you are subscribed to the Google Groups "plots-infrared" group.
To unsubscribe from this group and stop receiving emails from it, send an email to plots-infrare...@googlegroups.com.
To post to this group, send email to plots-i...@googlegroups.com.
Visit this group at http://groups.google.com/group/plots-infrared?hl=en.
Chris Fastie
May 25, 2013, 9:35:31 PM5/25/13
to plots-i...@googlegroups.com
Ned, Do you think it makes sense to extend the blue part of that lut over to +0.1? In other words, should the "values too low to be plants" region include -1 to +0.1?

Ned Horning
May 26, 2013, 9:01:20 AM5/26/13
to plots-i...@googlegroups.com
Chris,
That's pretty much a judgment call. It really depends on the image and what features you want to see. You can also clip off at the high end if it looks like the highest pixel values look like anomalies. Keep in mind that if you stretch the pixel values the NDVI values will change depending on the scene so the NDVI range where you expect to find vegetation will also change.
Ned
--
Jeffrey Warren
May 27, 2013, 11:59:54 AM5/27/13
to Chris Fastie, plots-i...@googlegroups.com
I link to the Github page from here: http://publiclab.org/wiki/near-infrared-camera#How+to+process+your+images:
but it could use a one-line description and perhaps a link to a new page at http://publiclab.org/wiki/photo-monitoring-plugin or however you choose to name the page. That'd be a great place to put the video tutorial we talked about on a recent dev call.
Thanks!
--
Jeffrey Warren
Jun 2, 2013, 10:58:50 AM6/2/13
to Chris Fastie, plots-i...@googlegroups.com
I went ahead and made that page: http://publiclab.org/wiki/photo-monitoring-plugin, and added a graphic. But it's a little sparse, and since GitHub's down right now, i couldn't copy in a line or two from the guide. But this will be a nice, user-friendly place to direct people to who are interested in using the photo monitoring plugin... also a great place to post a video to when the time comes, although the lead image pretty much shows it all!
I wasn't able to figure out where to put plugins for Fiji, so I'm just using ImageJ... any advice? Fiji ships as a single packaged application, without the extra folders that ImageJ has.
Ned Horning
Jun 2, 2013, 4:29:38 PM6/2/13
to plots-i...@googlegroups.com
Hi Jeff,
I'll take a shot at editing the Wiki. Feel free to edit what ever I write
Fiji is basically the same as ImageJ and you should be able to find the same directories unless something changed recently.
Ned
I'll take a shot at editing the Wiki. Feel free to edit what ever I write
Fiji is basically the same as ImageJ and you should be able to find the same directories unless something changed recently.
Ned
Jeffrey Warren
Jun 2, 2013, 6:02:56 PM6/2/13
to Ned Horning, plots-i...@googlegroups.com
Well, when i download Fiji, i only get a binary, no folders. So I wasn't sure where to put plugins...
Ned Horning
Jun 2, 2013, 6:14:36 PM6/2/13
to Jeffrey Warren, plots-i...@googlegroups.com
Jeff,
I'll see if I can figure out what's going on. There must be some way to install plugins. Which OS are you using?
Ned
I'll see if I can figure out what's going on. There must be some way to install plugins. Which OS are you using?
Ned
Jeffrey Warren
Jun 3, 2013, 10:38:24 AM6/3/13
to Ned Horning, plots-i...@googlegroups.com
I figured it out -- it's pretty obscure: http://fiji.sc/wiki/index.php/Installing_3rd_party_plugins
> Note: On MacOSX, you need to Ctrl+click on the Fiji icon in the Finder and select Show package contents to see the plugins/ folder.
Jeff
Ned Horning
Jun 3, 2013, 10:57:07 AM6/3/13
to Jeffrey Warren, plots-i...@googlegroups.com
Jeff,
Thanks. I didn't realize the plugins directory was hidden from Mac users. I wonder if that's a recent change. I'll update the user guide to provide the option of dragging the .jar file to the Fiji menu to copy it to the plugin directory. I'll also add the link to the Fiji instructions.
Ned
Thanks. I didn't realize the plugins directory was hidden from Mac users. I wonder if that's a recent change. I'll update the user guide to provide the option of dragging the .jar file to the Fiji menu to copy it to the plugin directory. I'll also add the link to the Fiji instructions.
Ned
Chris Fastie
Dec 15, 2015, 7:12:10 AM12/15/15
to The Public Laboratory for Open Technology and Science, plots-i...@googlegroups.com
Switching to plots-infrared Google Group...
Chris
On Monday, December 14, 2015 at 9:20:23 AM UTC-5, Nischay Gupta wrote:
On Monday, December 14, 2015 at 9:20:23 AM UTC-5, Nischay Gupta wrote:
Hello Ned,
On using the Photo monitoring plugin in ImageJ and creating NDVI using single Image, i am getting black NDVI image and greyscale color map image as output even after trying different luts including NDVI-.VGYRM.lut. I have attached the screenshot too.
I am not getting green color for plants. Please help !! :(

Nischay Gupta
Dec 15, 2015, 9:15:08 AM12/15/15
to publicla...@googlegroups.com, plots-i...@googlegroups.com
Hi,
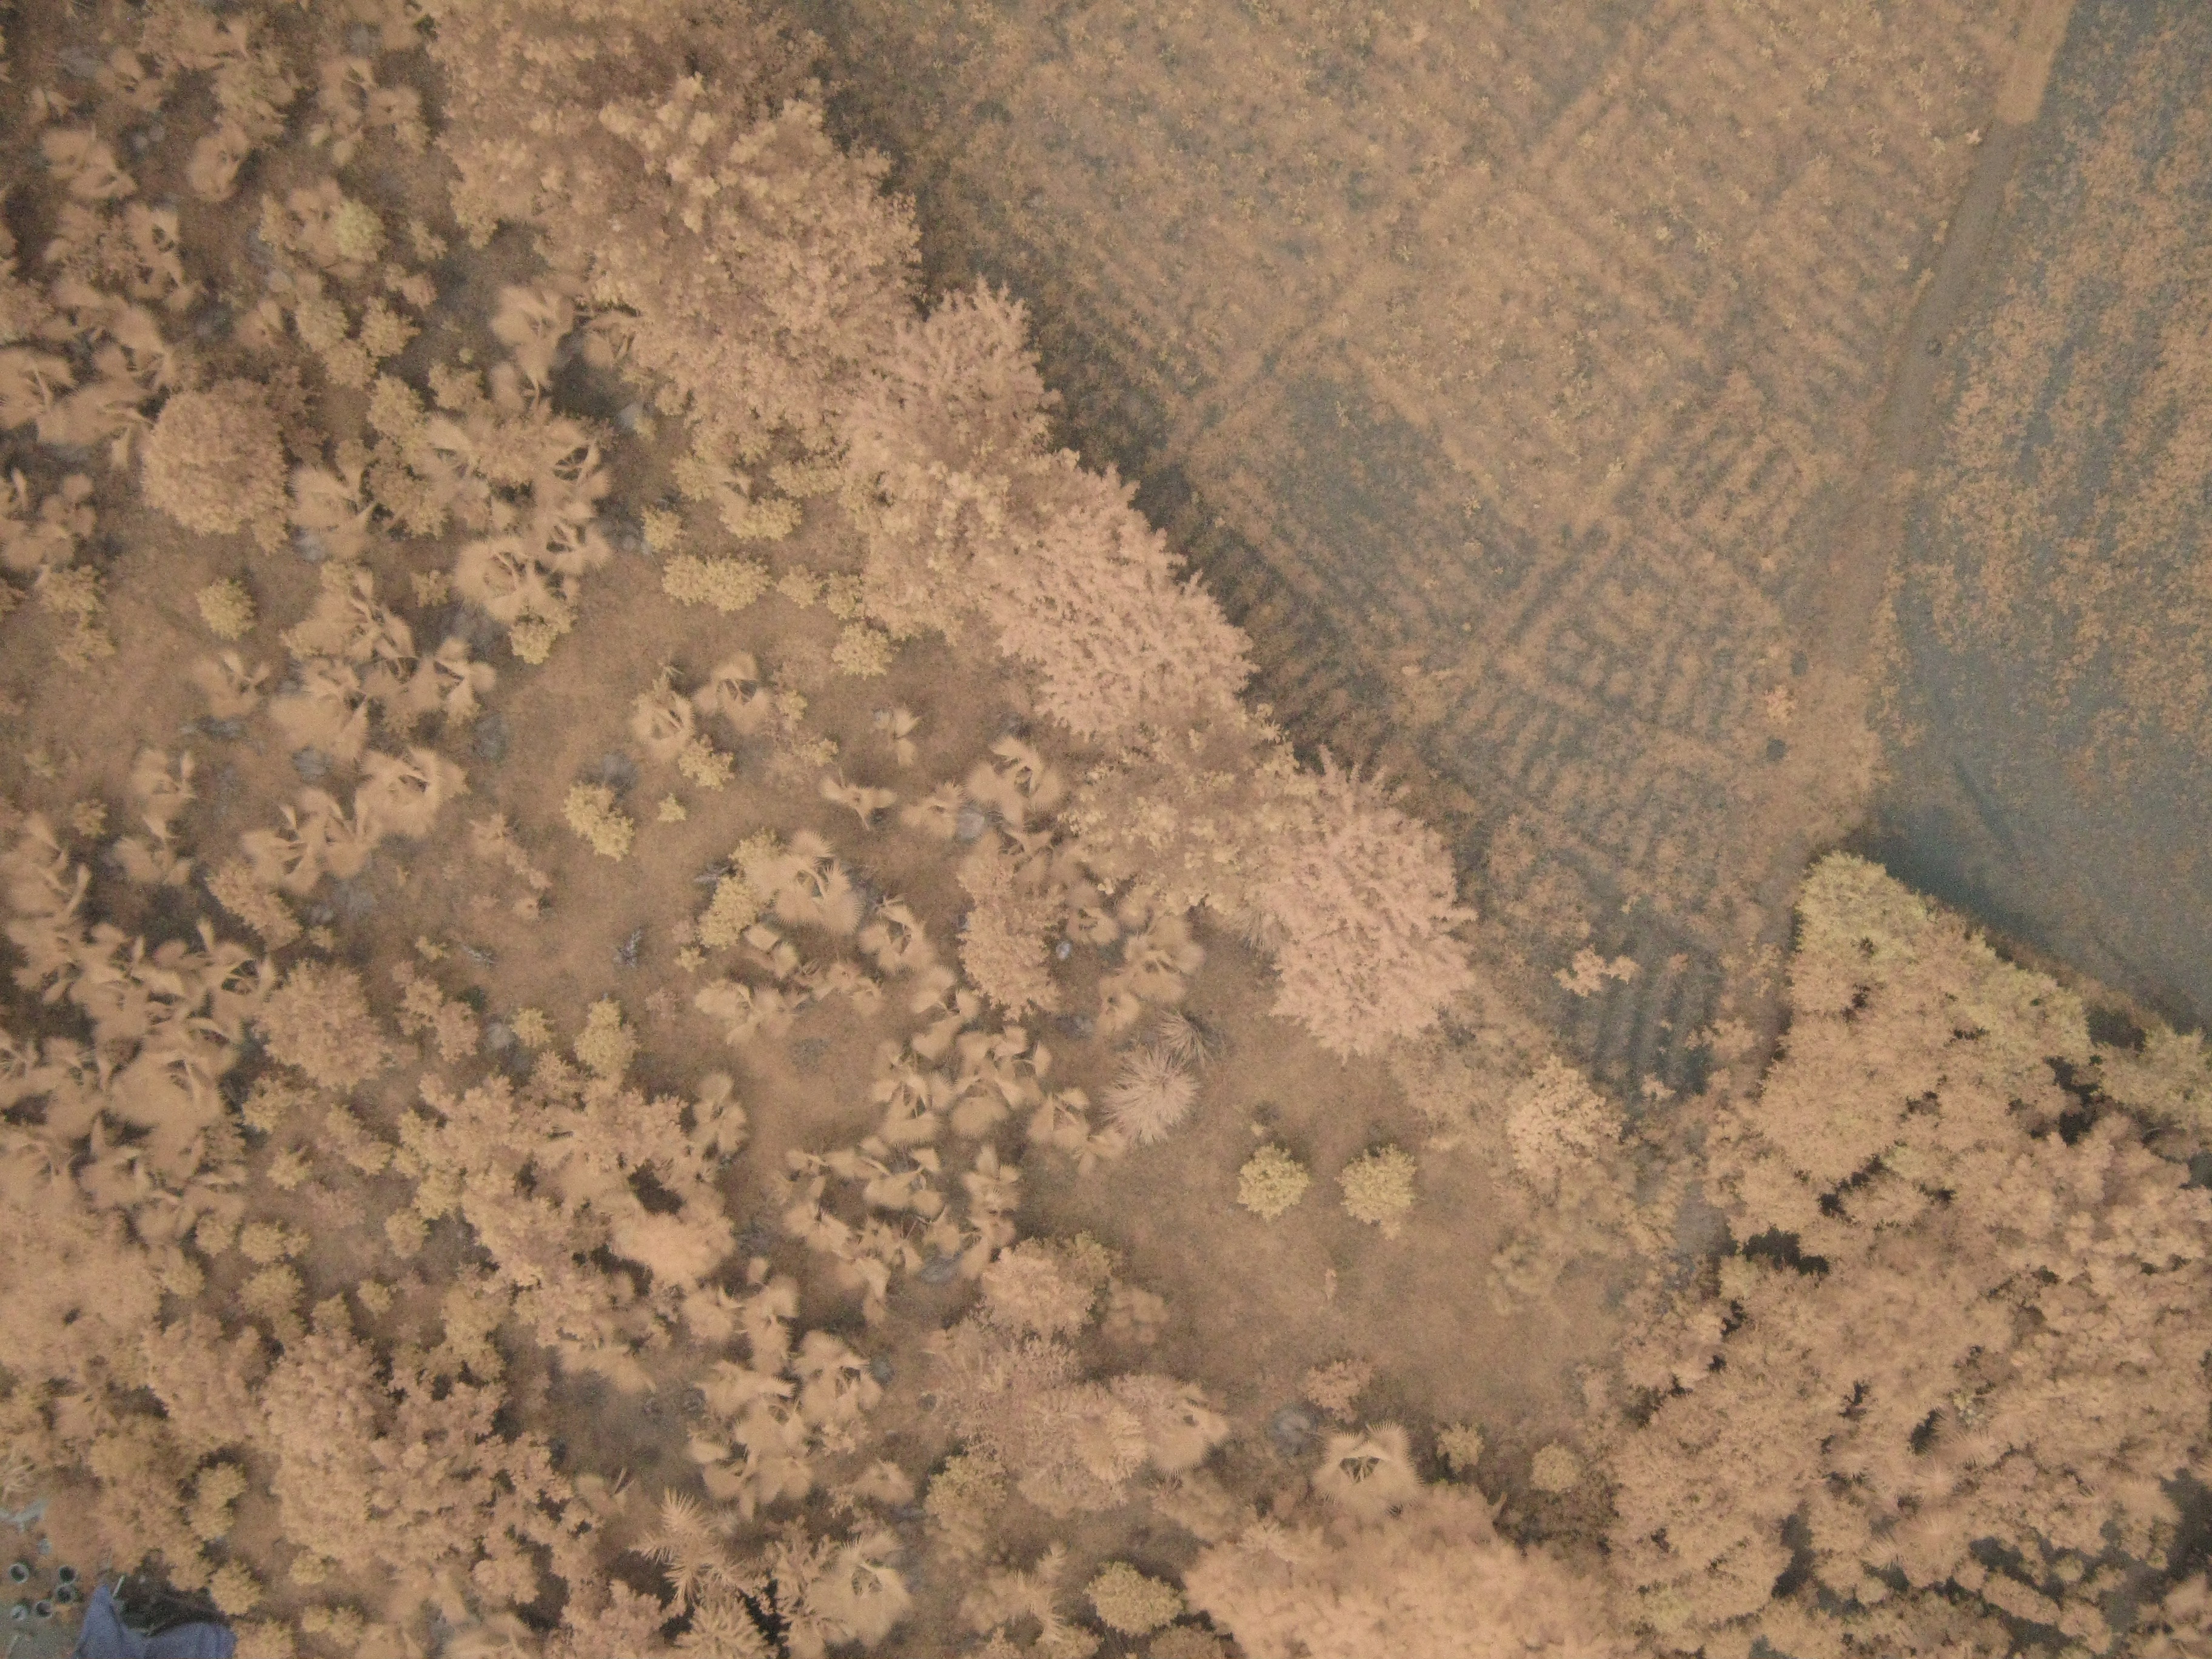
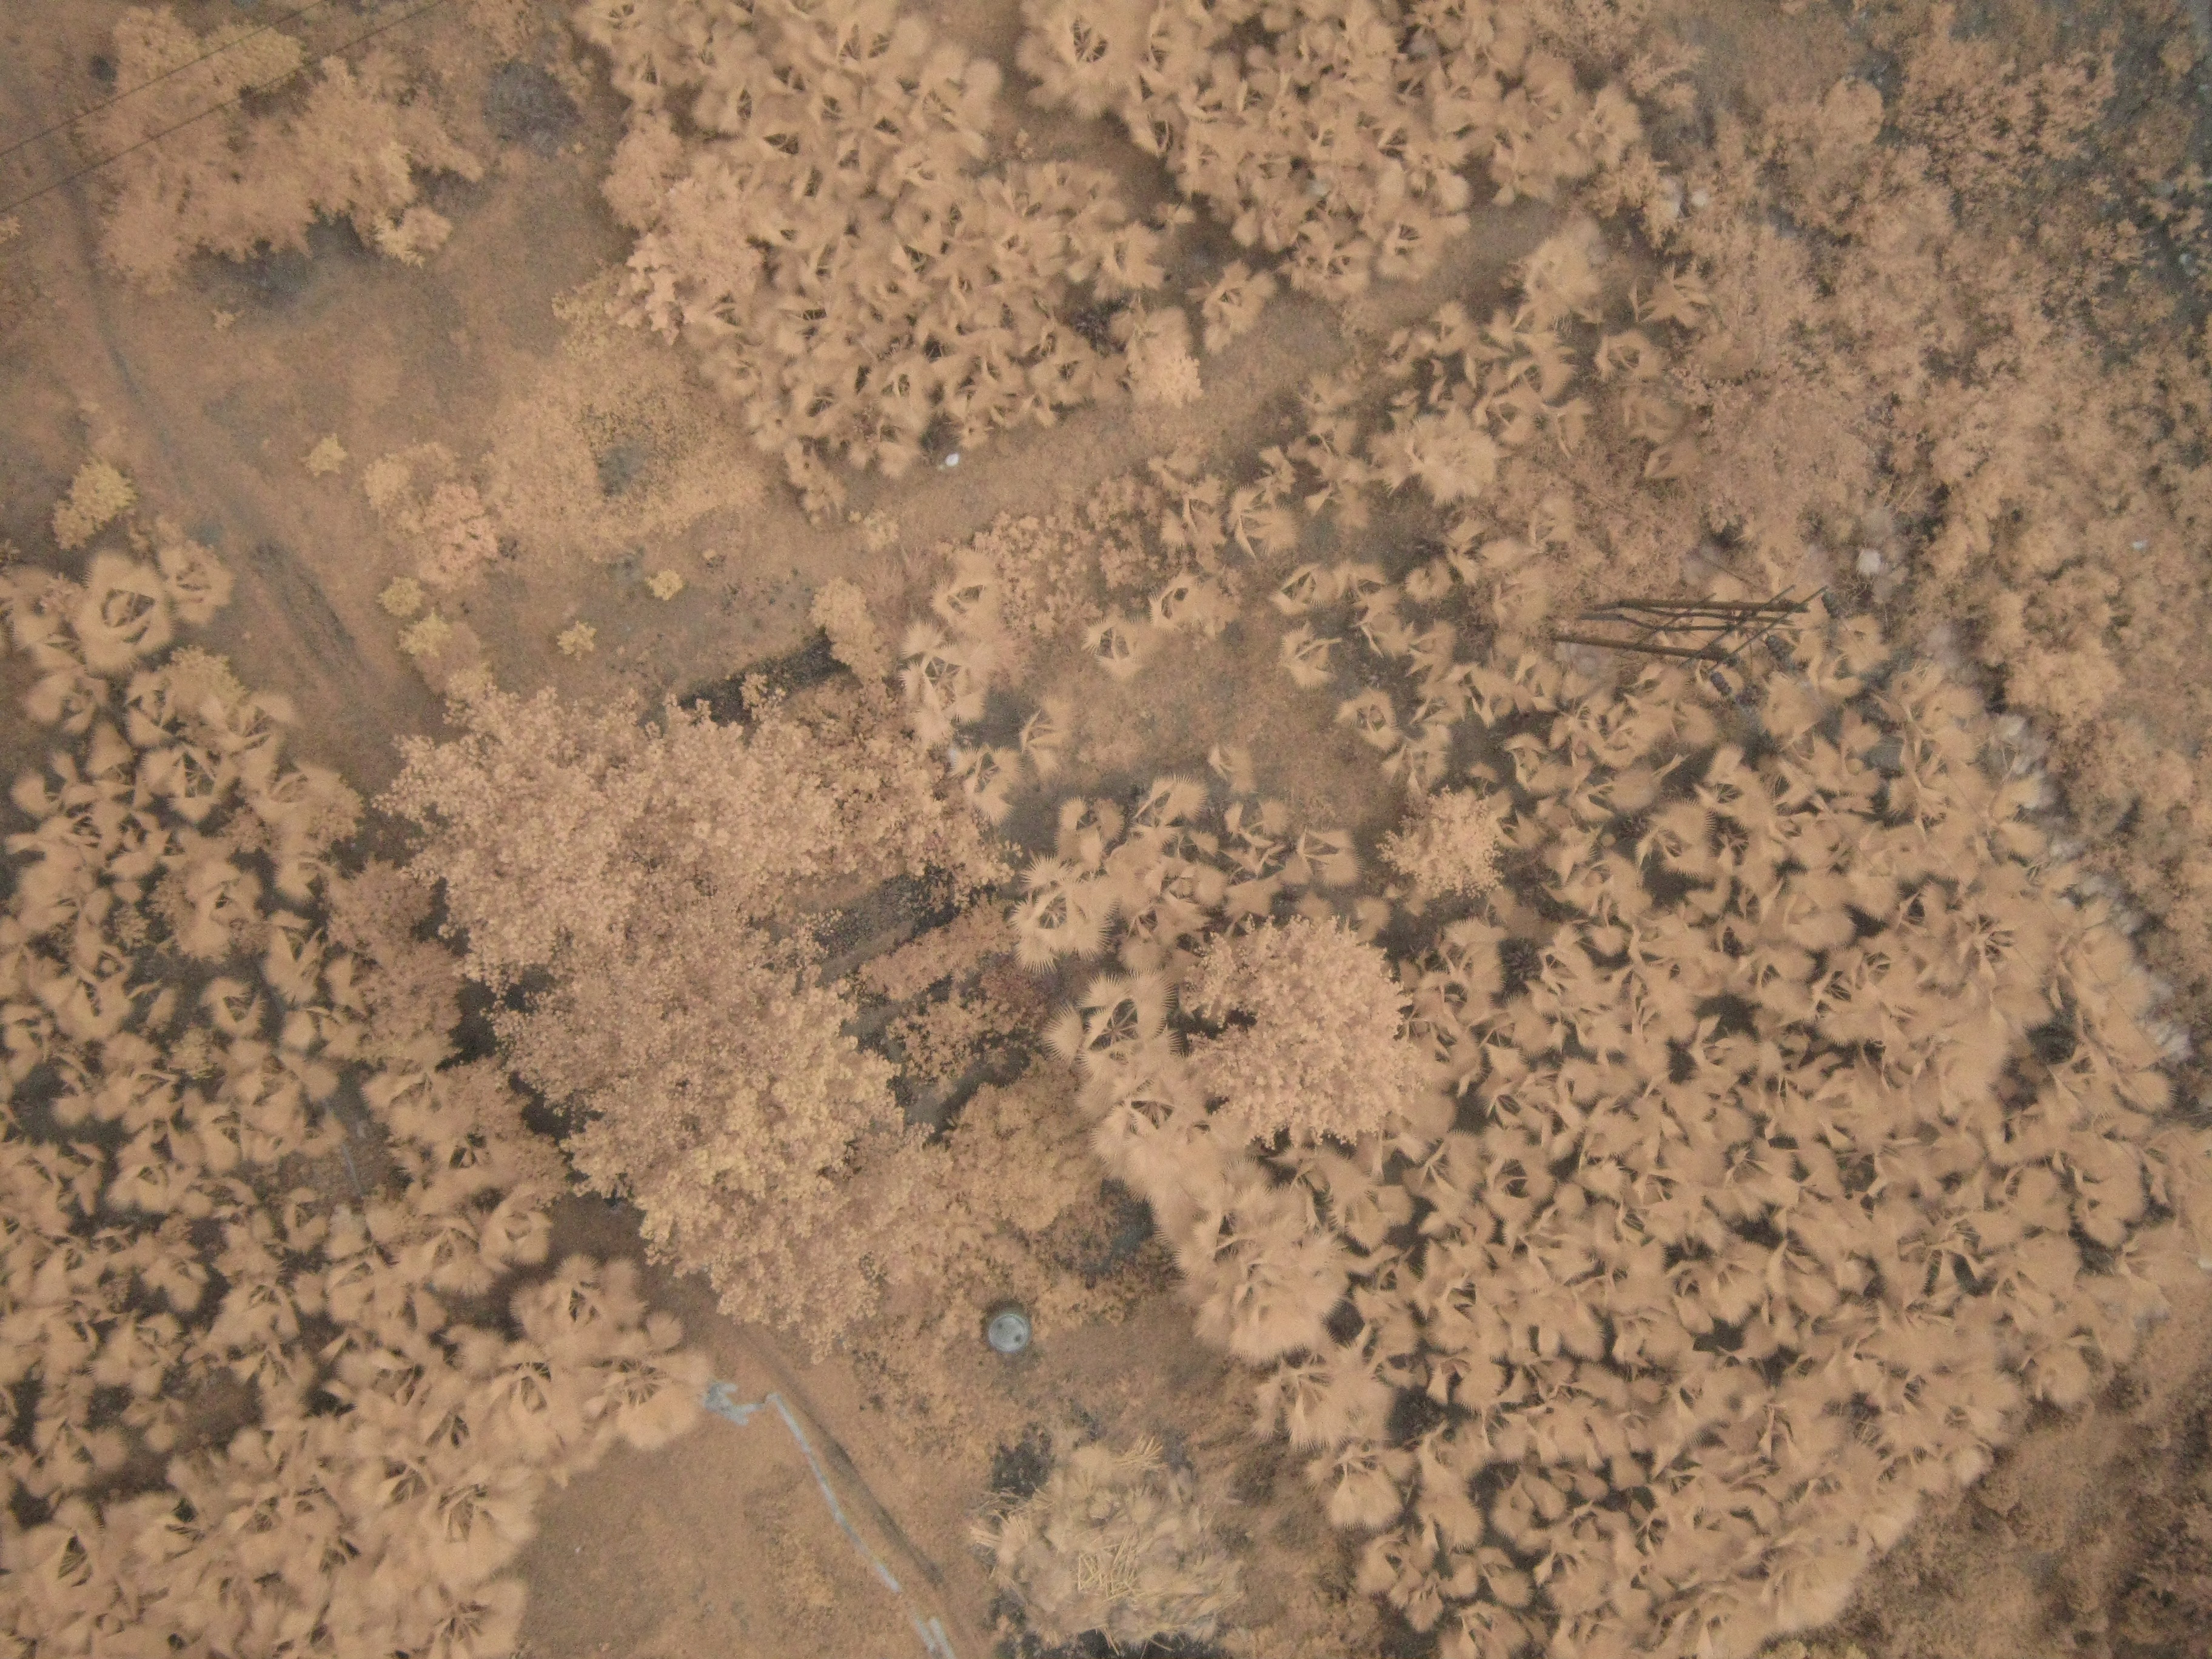
Here are the original photos. I used various luts including NDVI-VGYRM
but with every image, i am
getting only black NDVI image and greyscale colormap image.
Please let me know if i could get colored images showing green, yellow stuff.
Thanks !!
> Public Lab mailing lists (http://publiclab.org/lists) are great for
> discussion, but to get attribution, open source your work, and make it easy
> for others to find and cite your contributions, please publish your work at
> http://publiclab.org
> ---
> You received this message because you are subscribed to a topic in the
> https://groups.google.com/d/topic/publiclaboratory/PoybNwHHGoY/unsubscribe.
> To unsubscribe from this group and all its topics, send an email to
> publiclaborato...@googlegroups.com.
> For more options, visit https://groups.google.com/d/optout.
--
Warm Regards !!
Nischay Gupta.
+91-9560072360
Here are the original photos. I used various luts including NDVI-VGYRM
but with every image, i am
getting only black NDVI image and greyscale colormap image.
Please let me know if i could get colored images showing green, yellow stuff.
Thanks !!
> discussion, but to get attribution, open source your work, and make it easy
> for others to find and cite your contributions, please publish your work at
> http://publiclab.org
> ---
> You received this message because you are subscribed to a topic in the
> Google Groups "The Public Laboratory for Open Technology and Science" group.
> To unsubscribe from this topic, visit
> https://groups.google.com/d/topic/publiclaboratory/PoybNwHHGoY/unsubscribe.
> To unsubscribe from this group and all its topics, send an email to
> publiclaborato...@googlegroups.com.
> For more options, visit https://groups.google.com/d/optout.
--
Warm Regards !!
Nischay Gupta.
+91-9560072360
Chris Fastie
Dec 15, 2015, 9:52:02 AM12/15/15
to plots-infrared
Hi Nischay,
I don't have any problem getting color NDVI images from your photos. Somebody else had this problem a week or two ago and apparently fixed it by reinstalling all or part of the ImageJ/Fiji/plugin stuff (I think).
Your photo produces NDVI images with NDVI values below the typical range for healthy plants because the color balance is not right. Photos with brighter and oranger foliage generally produce more meaningful NDVI values. For the color NDVI image below, I stretched the NIR histogram (red channel) and then added 15 to the color value (that slides the colors to the right along the lut). For the grayscale NDVI image, I added 0.3 to all NDVI values.

If the original photos have more color, the NDVI values will be higher and their dynamic range will be greater.
Chris
gnis...@gmail.com
Dec 17, 2015, 2:19:45 PM12/17/15
to plots-infrared
Hi,
Thanks a lot for your reply. Can you let me know the proper way of white balancing the images before the Aerial Shoot. I used an Rosco #2007 Blue Filter and clicked at the orgami paper before the shoot for custom White Balance. Still, as you told, the color in the images was low and i am getting low NDVI value in images. I also obtained images using Automatic white balancing but they too are not giving proper results.
Please help !
Chris Fastie
Dec 17, 2015, 2:34:26 PM12/17/15
to plots-infrared, gnis...@gmail.com
Nischay,
To trick the camera into exaggerating the red channel, you need to flood the sensor with blue light while doing the custom white balance procedure. For a nice deep blue paper, if you put it in the shade on a sunny day so that it is illuminated by blue sky but not direct sun, then fill the frame with the paper, you should get higher NDVI values for healthy leaves.
Chris
Nischay Gupta
Dec 17, 2015, 5:31:32 PM12/17/15
to Chris Fastie, plots-infrared, Ned Horning
Thank you Chris. :)
One more thing, http://flightriot.com/vegetation-mapping-ndvi/ This
link shows around 12-14 of post processed images, NDVI Float images
and images with various LUT's etc.
Please let me know the importance / use / application of these images.
Also, if a particular area of the farm / agricultural field is
stressed, what are the steps that should be taken to overcome it.
Chris Fastie
Dec 18, 2015, 11:12:20 AM12/18/15
to plots-infrared
Nischay,
The FlightRiot images are a good example of NDVI results you can get using a Rosco #2007 filter. There are many other results possible with different combinations of camera, filter, white balance, exposure, processing, and color presentation. The goal is to refine and replicate a particular set of those variables so the variable of interest, plant health, can be monitored.
There is no reason to expect that every acre of cropland will have equally healthy plants. Spatial variation in soil, hydrology, slope, aspect, animal interaction, and past management will cause some areas to support better plant growth. If poor growth is detected, the cause must be determined before management decisions are made.
Several people have reported that the Photo Monitoring plugin or Fiji does not work properly with the latest version of ImageJ. So for the time being, versions before v. 1.50 must be used with the plugin. More here: https://github.com/nedhorning/PhotoMonitoringPlugin/issues/8
Chris
Nischay Gupta
Dec 20, 2015, 4:00:24 AM12/20/15
to Chris Fastie, plots-infrared
Hi,
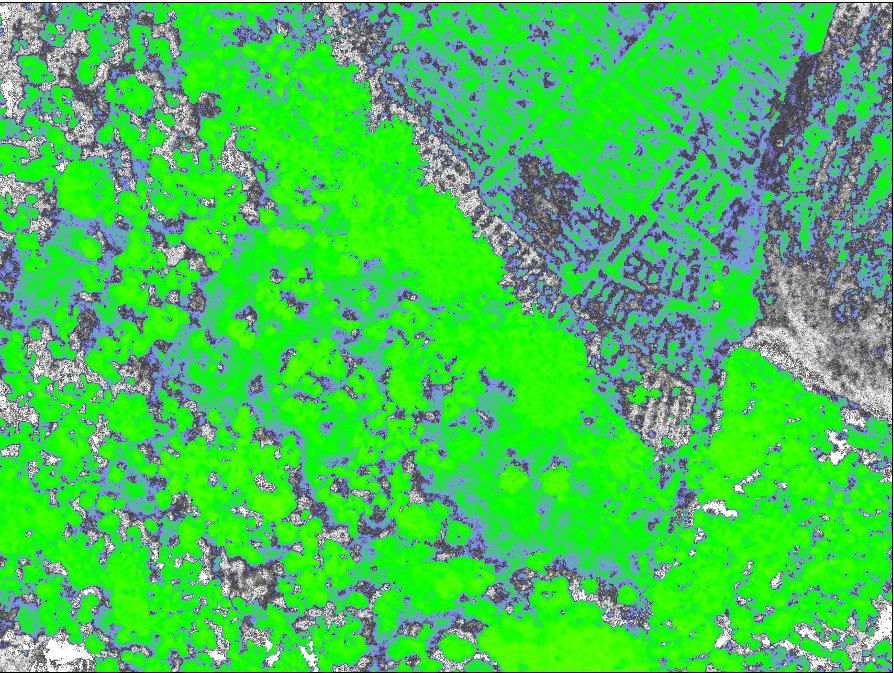
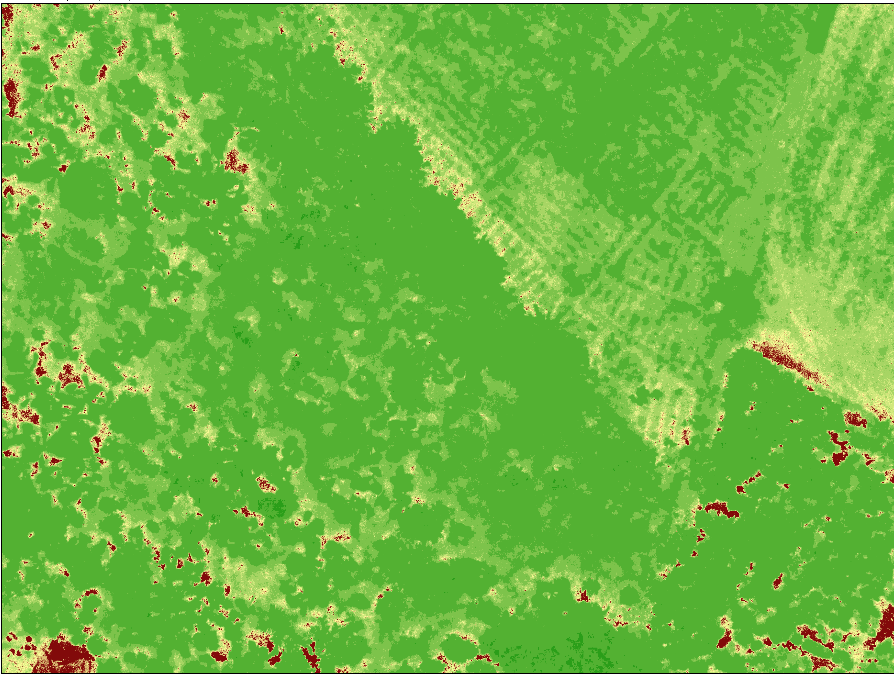
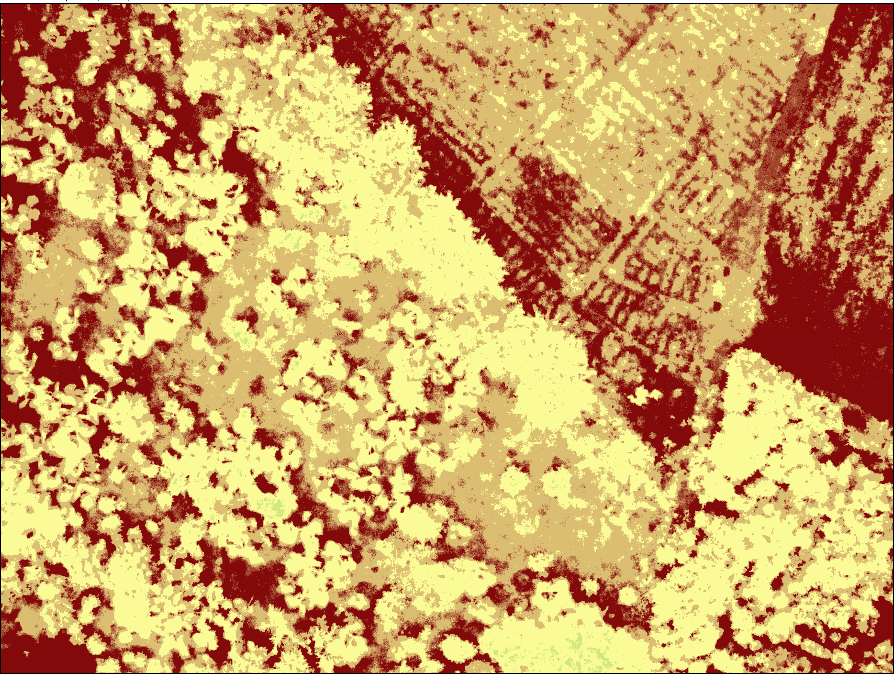
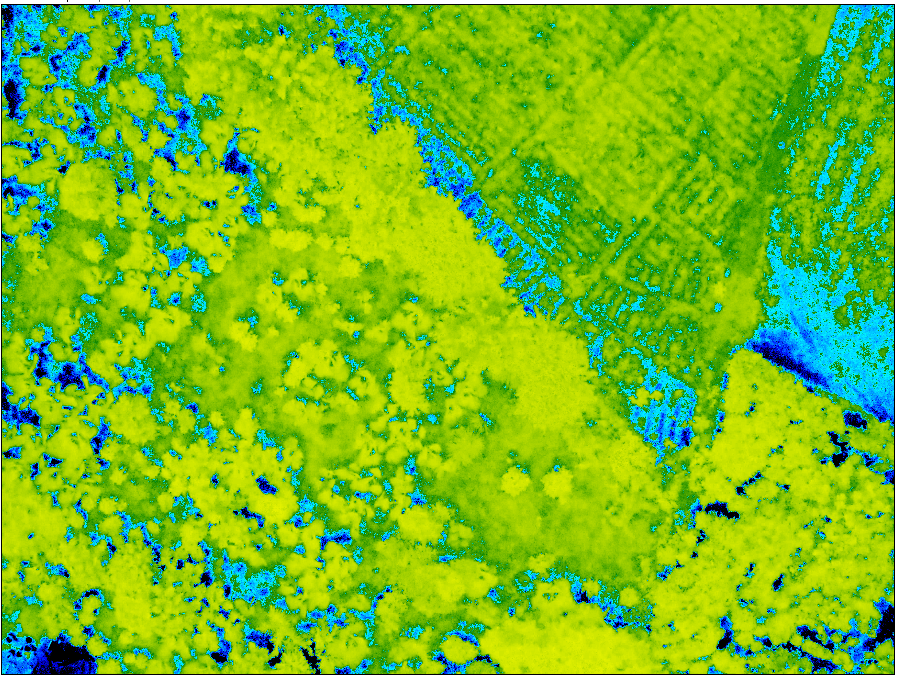
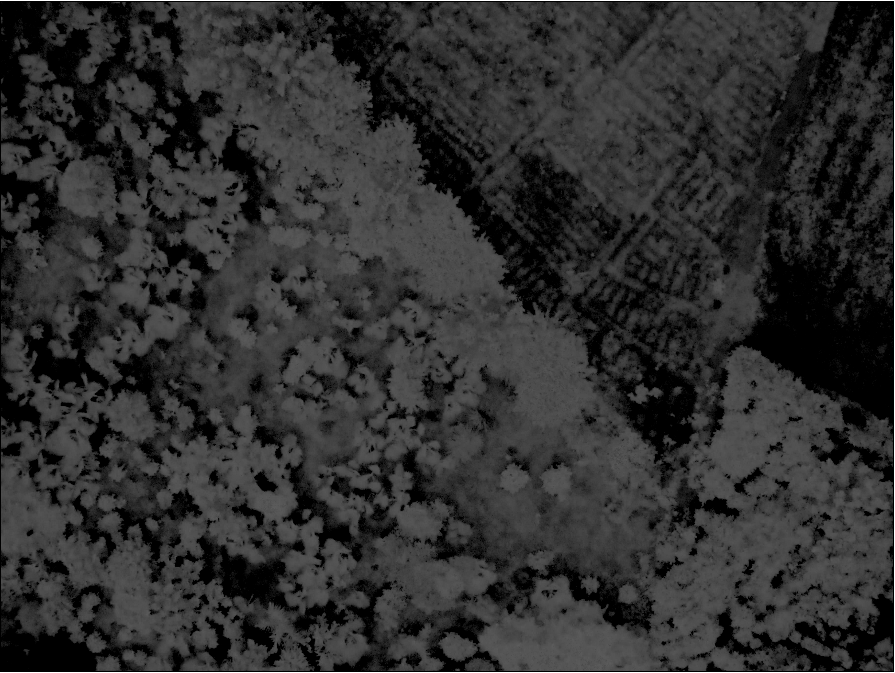
Thanks a lot. Attached are the results i obtained using different luts
as you can see on the image name. I just implemented the aerial images
during Ned's Plugin and luts.
Please let me know, what conclusion can i draw out from these results ?
> --
> Post to this group at plots-i...@googlegroups.com
Thanks a lot. Attached are the results i obtained using different luts
as you can see on the image name. I just implemented the aerial images
during Ned's Plugin and luts.
Please let me know, what conclusion can i draw out from these results ?
> Post to this group at plots-i...@googlegroups.com
>
> Public Lab mailing lists (http://publiclab.org/lists) are great for
> discussion, but to get attribution, open source your work, and make it easy
> for others to find and cite your contributions, please publish your work at
> http://publiclab.org
> ---
> You received this message because you are subscribed to a topic in the
> Google Groups "plots-infrared" group.
> Public Lab mailing lists (http://publiclab.org/lists) are great for
> discussion, but to get attribution, open source your work, and make it easy
> for others to find and cite your contributions, please publish your work at
> http://publiclab.org
> ---
> You received this message because you are subscribed to a topic in the
> To unsubscribe from this topic, visit
> https://groups.google.com/d/topic/plots-infrared/8YLFtBhXUhY/unsubscribe.
> To unsubscribe from this group and all its topics, send an email to
> plots-infrare...@googlegroups.com.
Chris Fastie
Dec 22, 2015, 12:30:49 PM12/22/15
to plots-infrared
Nischay,
I can't conclude much from the images because I don't know anything about the scene (what plants are growing, how they were grown, which parts are plants vs not plants, etc.). What would you conclude?
Chris
Reply all
Reply to author
Forward
0 new messages