Stacked Bar chart with Annotations for each data point?
3,871 views
Skip to first unread message

Bryce Hill
Feb 17, 2014, 5:36:17 PM2/17/14
to google-visua...@googlegroups.com
Is it possible to add annotations or labels to each chunk of a stacked bar graph? With stacked bar charts, a single column is made up of a row/group of data. I'm able to add one annotation per single row, but not for each data point in the group. Wondering if this is possible somehow and I'm just missing it. Thanks!

Daniel LaLiberte
Feb 18, 2014, 8:39:30 AM2/18/14
to google-visua...@googlegroups.com
Bryce,
Each column in the column chart, stacked or not, can have an annotation, but they won't show up in the chart very well unless you have very wide column bars. We'll have to arrange for more flexibility in the ways that annotations can be displayed.
On Mon, Feb 17, 2014 at 5:36 PM, Bryce Hill <bryce...@gmail.com> wrote:
Is it possible to add annotations or labels to each chunk of a stacked bar graph? With stacked bar charts, a single column is made up of a row/group of data. I'm able to add one annotation per single row, but not for each data point in the group. Wondering if this is possible somehow and I'm just missing it. Thanks!
--
You received this message because you are subscribed to the Google Groups "Google Visualization API" group.
To unsubscribe from this group and stop receiving emails from it, send an email to google-visualizati...@googlegroups.com.
To post to this group, send email to google-visua...@googlegroups.com.
Visit this group at http://groups.google.com/group/google-visualization-api.
For more options, visit https://groups.google.com/groups/opt_out.
daniel.laliberte@GMail.com 9 Juniper Ridge Road, Acton MA
Bryce Hill
Feb 18, 2014, 11:08:55 AM2/18/14
to google-visua...@googlegroups.com
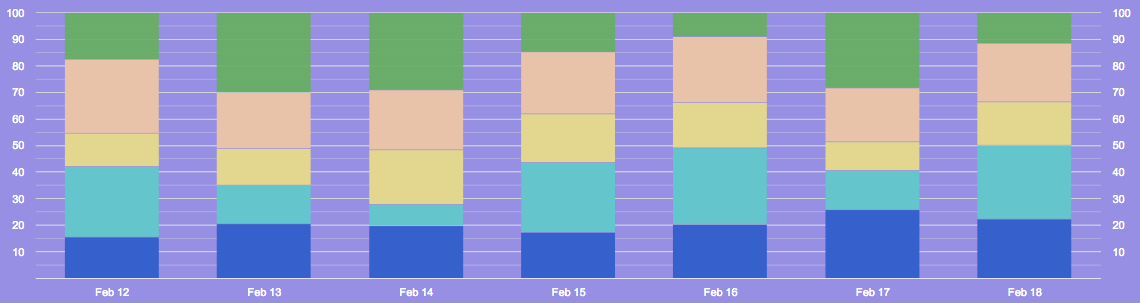
Thanks for the reply. Just to clarify, I should be able to get a label to show up in each different colored column below? Any tips on how to get the annotations to show up on each column? The purple chart is Google Charts, the other one is using a modified version of chart.js. If there's a way to label the stacked bar chart similar to the chart.js chart, that would be perfect.

--
You received this message because you are subscribed to a topic in the Google Groups "Google Visualization API" group.
To unsubscribe from this topic, visit https://groups.google.com/d/topic/google-visualization-api/kw4vhGBuYmw/unsubscribe.
To unsubscribe from this group and all its topics, send an email to google-visualizati...@googlegroups.com.
Daniel LaLiberte
Feb 18, 2014, 12:07:45 PM2/18/14
to google-visua...@googlegroups.com
The documentation at https://developers.google.com/chart/interactive/docs/gallery/columnchart#Labels uses annotations to 'label' individual columns, and this works in the stacked mode as well. The labels won't be vertically centered in each column segment, however.

Ranjith Nanjala
Mar 14, 2019, 11:02:27 AM3/14/19
to Google Visualization API
hi , I dont see an option to add annotation for each column. is there any code available for this requirement?
On Tuesday, February 18, 2014 at 12:07:45 PM UTC-5, Daniel LaLiberte wrote:
The documentation at https://developers.google.com/chart/interactive/docs/gallery/columnchart#Labels uses annotations to 'label' individual columns, and this works in the stacked mode as well. The labels won't be vertically centered in each column segment, however.
On Tue, Feb 18, 2014 at 11:08 AM, Bryce Hill <bryce...@gmail.com> wrote:
Thanks for the reply. Just to clarify, I should be able to get a label to show up in each different colored column below? Any tips on how to get the annotations to show up on each column? The purple chart is Google Charts, the other one is using a modified version of chart.js. If there's a way to label the stacked bar chart similar to the chart.js chart, that would be perfect.


On Tue, Feb 18, 2014 at 6:39 AM, Daniel LaLiberte <dlali...@google.com> wrote:
Bryce,Each column in the column chart, stacked or not, can have an annotation, but they won't show up in the chart very well unless you have very wide column bars. We'll have to arrange for more flexibility in the ways that annotations can be displayed.
On Mon, Feb 17, 2014 at 5:36 PM, Bryce Hill <bryce...@gmail.com> wrote:
Is it possible to add annotations or labels to each chunk of a stacked bar graph? With stacked bar charts, a single column is made up of a row/group of data. I'm able to add one annotation per single row, but not for each data point in the group. Wondering if this is possible somehow and I'm just missing it. Thanks!
--
You received this message because you are subscribed to the Google Groups "Google Visualization API" group.
To unsubscribe from this group and stop receiving emails from it, send an email to google-visualization-api+unsub...@googlegroups.com.
To post to this group, send email to google-visua...@googlegroups.com.
Visit this group at http://groups.google.com/group/google-visualization-api.
For more options, visit https://groups.google.com/groups/opt_out.
--daniel.l...@GMail.com 9 Juniper Ridge Road, Acton MA
--
You received this message because you are subscribed to a topic in the Google Groups "Google Visualization API" group.
To unsubscribe from this topic, visit https://groups.google.com/d/topic/google-visualization-api/kw4vhGBuYmw/unsubscribe.
To unsubscribe from this group and all its topics, send an email to google-visualization-api+unsub...@googlegroups.com.
To post to this group, send email to google-visua...@googlegroups.com.
Visit this group at http://groups.google.com/group/google-visualization-api.
For more options, visit https://groups.google.com/groups/opt_out.
--
You received this message because you are subscribed to the Google Groups "Google Visualization API" group.
To unsubscribe from this group and stop receiving emails from it, send an email to google-visualization-api+unsub...@googlegroups.com.
To post to this group, send email to google-visua...@googlegroups.com.
Visit this group at http://groups.google.com/group/google-visualization-api.
For more options, visit https://groups.google.com/groups/opt_out.
Daniel LaLiberte
Mar 14, 2019, 11:25:57 AM3/14/19
to Google Visualization API
To specify an annotation for each data column, which should show up like in the second image from Bryce, you have to add a separate 'annotation' role column after the corresponding data column.
One of the examples in the carousel at https://developers.google.com/chart/interactive/docs/gallery/columnchart#examples focuses on "Annotations".
On Thu, Mar 14, 2019 at 11:02 AM Ranjith Nanjala <ranji...@gmail.com> wrote:
hi , I dont see an option to add annotation for each column. is there any code available for this requirement?
On Tuesday, February 18, 2014 at 12:07:45 PM UTC-5, Daniel LaLiberte wrote:
The documentation at https://developers.google.com/chart/interactive/docs/gallery/columnchart#Labels uses annotations to 'label' individual columns, and this works in the stacked mode as well. The labels won't be vertically centered in each column segment, however.
On Tue, Feb 18, 2014 at 11:08 AM, Bryce Hill <bryce...@gmail.com> wrote:
Thanks for the reply. Just to clarify, I should be able to get a label to show up in each different colored column below? Any tips on how to get the annotations to show up on each column? The purple chart is Google Charts, the other one is using a modified version of chart.js. If there's a way to label the stacked bar chart similar to the chart.js chart, that would be perfect.
On Tue, Feb 18, 2014 at 6:39 AM, Daniel LaLiberte <dlali...@google.com> wrote:
Bryce,Each column in the column chart, stacked or not, can have an annotation, but they won't show up in the chart very well unless you have very wide column bars. We'll have to arrange for more flexibility in the ways that annotations can be displayed.
On Mon, Feb 17, 2014 at 5:36 PM, Bryce Hill <bryce...@gmail.com> wrote:
Is it possible to add annotations or labels to each chunk of a stacked bar graph? With stacked bar charts, a single column is made up of a row/group of data. I'm able to add one annotation per single row, but not for each data point in the group. Wondering if this is possible somehow and I'm just missing it. Thanks!
--
You received this message because you are subscribed to the Google Groups "Google Visualization API" group.
To unsubscribe from this group and stop receiving emails from it, send an email to google-visualizati...@googlegroups.com.
To post to this group, send email to google-visua...@googlegroups.com.
Visit this group at http://groups.google.com/group/google-visualization-api.
For more options, visit https://groups.google.com/groups/opt_out.
--daniel.l...@GMail.com 9 Juniper Ridge Road, Acton MA
--
You received this message because you are subscribed to a topic in the Google Groups "Google Visualization API" group.
To unsubscribe from this topic, visit https://groups.google.com/d/topic/google-visualization-api/kw4vhGBuYmw/unsubscribe.
To unsubscribe from this group and all its topics, send an email to google-visualizati...@googlegroups.com.
To post to this group, send email to google-visua...@googlegroups.com.
Visit this group at http://groups.google.com/group/google-visualization-api.
For more options, visit https://groups.google.com/groups/opt_out.
--
You received this message because you are subscribed to the Google Groups "Google Visualization API" group.
To unsubscribe from this group and stop receiving emails from it, send an email to google-visualizati...@googlegroups.com.
To post to this group, send email to google-visua...@googlegroups.com.
Visit this group at http://groups.google.com/group/google-visualization-api.
For more options, visit https://groups.google.com/groups/opt_out.
--
You received this message because you are subscribed to the Google Groups "Google Visualization API" group.
To unsubscribe from this group and stop receiving emails from it, send an email to google-visualizati...@googlegroups.com.
To post to this group, send email to google-visua...@googlegroups.com.
Visit this group at https://groups.google.com/group/google-visualization-api.
To view this discussion on the web visit https://groups.google.com/d/msgid/google-visualization-api/37c6a377-d4a2-4ed9-8501-a5d544cadbd3%40googlegroups.com.
For more options, visit https://groups.google.com/d/optout.
dlaliberte@Google.com Cambridge MA
Reply all
Reply to author
Forward
0 new messages