Is there a better way of computing/displaying historic solar radiation readings?
101 views
Skip to first unread message

Peter Fletcher
Mar 11, 2023, 4:05:18 PM3/11/23
to weewx-de...@googlegroups.com, Tom Keffer
When looking at some of my 'yearly' charts (see
https://fletchers-uk.com/weather/index.html), the other day, I was
struck by how low the 'peaks' in the Solar Radiation and UV graphs were.
On a sunny day in the summer (yes - we do have such days in Buffalo!), I
typically see Solar Radiation numbers above 900 and UV values above 7
for at least a couple of hours around solar noon, but the peaks of the
yearly graphs barely exceed 325 and 2, respectively. A (very) little
thought revealed the reason for this - the longer term charts average
the raw values recorded over periods of more than 24 hours (a week, in
my case), so the averages displayed on the charts include a large number
of entirely predictable nocturnal zero readings. In the depths of a
Buffalo winter, it is dark for 15 hours out of the 24, and even in high
summer here it is dark for a bit less than 9 hours out of 24.
'Straight' averages are easy to compute, and make reasonably good sense
for displaying the majority of weather-related measurements, which
typically have no particular diurnal pattern - or, at least, not such an
extreme one - but it doesn't seem totally to make sense to use them when
you know in advance that there is such a pattern. OTOH, it clearly
wouldn't be very useful just to record and display the daily peak values
for these measurements, since that would treat otherwise cloudy days
during which the sun appeared through the clouds for ten minutes around
noon in the same way as days on which the sun shone out of a cloudless
sky from dawn to dusk. Some averaging is needed.
One possibility that might produce (IMHO) more meaningful results is
'non-zero averaging' - do not count zero values in computing the
average. Solar Radiation rarely reads as zero during the day, so the
results of this calculation should correspond reasonably well to a
daytime-only average. Daytime UV readings, OTOH, are frequently zero if
it is reasonably heavily overcast, so 'non-zero averaging' would produce
misleadingly high 'average' values on days with variable cloud cover.
A second, and, I think, better, possibility would be to explicitly
record and average only daytime values for both readings - defining
daytime as being between sunrise and sunset for the date and the
station's location.
It might also be of interest to record and display the average daily
number of minutes/hours for which the reading exceeded a particular
threshold, and/or the level reached for at least a certain length of
time - the thresholds in each case being determined in advance - but
computing these results on the fly would likely be more challenging.
I am going to be playing with implementing these ideas over time, but I
would like to hear others' thoughts.
--
Peter R. Fletcher <pe...@fletchers-uk.com>
Home Page - https://pfletch.fletchers-uk.com
Peter Fletcher
Mar 15, 2023, 7:29:26 PM3/15/23
to weewx-development
In order to look at different ways of presenting solar and UV radiation data, I dumped the contents of weewx.sdb to a csv file and used Excel to manipulate and chart the relevant data. The attached charts show daily averages for solar and UV radiation for four-month summer and winter periods in 2021 and 2021/22. More (probably 'simple') averaging would probably be done in producing yearly charts for a website, but I thought it helpful to get a somewhat more granular picture of the processed data. For all the charts and both types of data, 'Avg ...' uses the current calculation (simple averaging of all readings for the 24 hr day), 'NZ Avg ...' represents the average of all non-zero readings acquired during the 24hr day, and 'Day Avg ...' represents the average of all readings (including any zeroes) recorded between sunrise and sunset (calculated for my location and the date by the standard NOAA method).
For solar radiation, in both seasons, the non-zero and daytime averaging methods produce almost identical results (there are only a few places where the two lines do not coincide), and the numbers generated are a bit more than 1.6 times the simple average numbers in the summer and well over twice the simple average numbers in the winter. This additional seasonal difference is, of course, a result of the non-zero winter averages not being 'diluted' by the zero values from the longer nights. The results of the two more complex averaging methods make more sense to me as a way to present solar radiation readings for long time-periods. Non-zero averaging is computationally simpler and would probably be my preferred way to go.
For UV radiation, the picture is rather different. Here, the simple average numbers are again lowest, but the other two averaging methods produce substantially different results, with non-zero averaging giving (particularly in the winter) results up to three times those generated by non-zero averaging. Here, I think daytime averaging makes more sense. As I indicated in my earlier post in this thread, I thought that non-zero averaging for UV radiation was likely to produce 'average' results that were distorted by periods of sunshine during an otherwise cloudy day, and I believe that this is a substantial contributor to what is happening here. Assuming, however, that stations which have UV sensors generally also have solar radiation sensors, it might be computationally simpler to average UV radiation readings if/when the accompanying solar radiation values are non-zero.
Any thoughts or comments?

michael.k...@gmx.at
Mar 21, 2023, 1:16:48 AM3/21/23
to weewx-development
For myself, I found that for a yearly chart, using a bar chart with the daily averages, and a crosshair to display the daily maximum, a comprehensive way to display solar readings.

Peter Fletcher
Mar 26, 2023, 4:32:13 PM3/26/23
to weewx-development
I'm not convinced that daily maxima are particularly useful for solar radiation. At least where I live, fairly high spikes on otherwise cloudy days are common, and days with light to moderate cloud cover with significantly lower maxima are also fairly common. Simple averages are, at least, somewhat meaningful, and I don't think showing the daily maxima adds anything to them. Only counting as maxima values that are sustained for more than a specified time might make them more so.
michael.k...@gmx.at
Mar 26, 2023, 11:33:09 PM3/26/23
to weewx-development
Where I live, with the hardware I use, in my understanding, it is useful: in addition to the information how much energy from solar radiation your location got over the day, you can tell if was clear at least for some time that day, or not. So if you say "where I live, fairly high spikes on otherwise cloudy days are common, and days with light to moderate cloud cover with significantly lower maxima are also fairly common" that's just the point: that's the extra information you get. The fact that you know that because you live there is proven with data and if your station is on the internet, everyone can know.
What would you reply to me, if I said: "I not convinced daily maxima are particularly useful for temperature. At least where I live, fairly high maxima on otherwise pretty cold days are common, and days with moderate averages, and maxima not significantly above average, are also fairly common"? Probably you'd say: "That's different", which is true, because radiation changes are very like to be more radical than temerature changes often, but it is not so much different one might think.
Peter Fletcher
Mar 27, 2023, 10:37:18 AM3/27/23
to weewx-development
I'm trying to start a discussion - not an argument! The fact that no-one has come up with a way of displaying historic radiation readings that a consensus of weather experts thinks is better than a simple average strongly suggests either that no-one thinks that the issue is that important, or that there is no one right answer - probably a bit of both. You can and should use whatever approach is most meaningful for you. In fairness, however, your temperature analogy really does not fly - maximum daily temperatures correlate much better with mean temperatures that is true for radiation values, but max temps are independently more 'important' than max radiation values. This is, of course, partly because it is very rare for a max temp to be a single isolated value in the way a max radiation reading may frequently be.
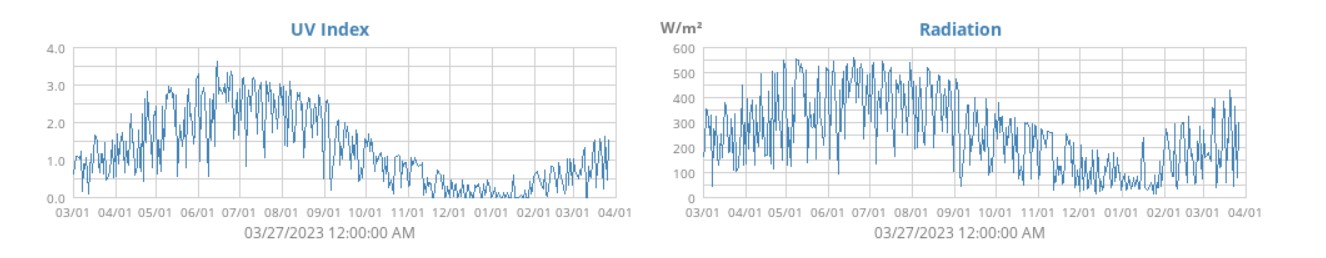
I have switched my annual charts of both UV and Solar Radiation to show 'daytime averages', as previously described. I have attached images of both pairs of charts - 'old' uses simple averaging; 'new' uses daytime averaging. The maximum values are substantially higher in the latter, but the overall patterns are not hugely different. The higher maxima 'feel' better to me, but I certainly would not go to the wall for 'my' way of doing things.
Message has been deleted

Cameron D
Mar 28, 2023, 3:43:26 AM3/28/23
to weewx-development
The obvious question is what you need to do with the numbers.
I have solar panels and I log the values separately so I don't use weewx for that - I got the weather station partly to help understand my PV output. The important long-term values to me are total energy over the day/month/etc. So, if I was needing to use weewx values of max or mean to plot how things were going then I suppose I would go for the 24-hour average. The summation of W/m2 over the day scales to the total energy generated - assuming your time interval is fixed and every value is recorded. So for a 5 minute interval, multiply the W/m2 value by 300 will give you J/m2.
In the same way, because you should have a fixed number of samples per day, the 24-hour average also scales to total energy. However, if you only use daylight or non-zero values then you are adding another variable and it carries less meaning - if total energy is important to you.
As for UV, since I live in skin cancer central, I would be mainly interested in the high values. Any average would be pretty useless to me, unless it is, for example, an average between 9:00 and 15:00 (or 3 hours either side of solar zenith.) A better long-term value might be minutes per day above index 10, 11 or 12.
I was not even sure an arithmetic mean of a UV index was valid, but having had a quick look at the derivation of the index, I think it is OK.
Peter Fletcher
Mar 29, 2023, 4:37:17 PM3/29/23
to weewx-development
It certainly does depend on what you want to do with the numbers.
Like you, I have solar panels, and, also like you, I monitor them separately from my weewx installation. If all you want to do is keep a check on total (potential) energy influx, then 24-hour averaging and using the sort of calculation you suggest, will work perfectly well, though it won't take account of the fact that solar panels are generally tilted and face in a specific direction (ideally between SE and SW), while most standard weather station radiation sensors are designed to be pretty much equally sensitive to radiation coming from anywhere in the sky. OTOH, if you want to get total energy from daytime-only averages, you just need to make sure that you have counted how many samples you have, so you haven't really lost any information. My problem with simple 24-hr averaging is that if you want to know 'how bright it was' on a past date, and you use simple averaging, winter days won't get a fair shake, because, even if the sun was shining out of a clear sky all day, there will be a lot more zeroes contributing to the average and the average radiation number will be disproportionately lower than I feel it 'should be'. I suppose that the question I am asking and answering is: "What was the average radiation level during the day?". I know it was zero at night!
For UV, I think you are right about showing minutes per day above a specified level (or perhaps two different ones) being more useful than any sort of average, though here, too I think there is an argument for averaging (if that is what you are going to do) only during the day.

František Slimařík
Mar 31, 2023, 4:40:08 PM3/31/23
to Peter Fletcher, weewx-development
Hello,
is it possible to share the code how you calculated NZavg in the weewx? Did you extend aggregation type with xtypes?
Thanks for reply :)
st 29. 3. 2023 v 22:37 odesílatel 'Peter Fletcher' via weewx-development <weewx-de...@googlegroups.com> napsal:
--
You received this message because you are subscribed to the Google Groups "weewx-development" group.
To unsubscribe from this group and stop receiving emails from it, send an email to weewx-developm...@googlegroups.com.
To view this discussion on the web visit https://groups.google.com/d/msgid/weewx-development/fe2f240a-6aef-4536-98e6-7a5f1a573508n%40googlegroups.com.
Reply all
Reply to author
Forward
0 new messages