RGB and CIR visualization
56 views
Skip to first unread message

Jaime Lopez Carvajal
Mar 21, 2016, 4:44:37 PM3/21/16
to scikit-image
Hi,
I am loading a 4-band image using io.imread, but I am having problems to visualize the true color (R,G,B) and Composite Infrared (IR,R,G) images.
I have try different band combinations, but I couldnt view the right visualization (see attached image)
Any suggestion?
Thanks in advance, Jaime

Stéfan van der Walt
Mar 21, 2016, 6:23:20 PM3/21/16
to scikit-image
Hi Jaime
Can you tell us what you expect to see? Can you also share an example image?
Thanks
Stéfan
Thanks
Stéfan
Jaime Lopez Carvajal
Mar 21, 2016, 7:02:38 PM3/21/16
to scikit-image
Hi Stefan,
Of course, I would like to visualize the image like this (attached image), that was obtained using ArcMap software, with the usual band order for True Color (RGB) and Composite Infrared (CIR) in remote sensing applications.
The tiff image that I loaded has 4 bands, so I would think that the order would be: band0(Red), band1(Green), band2(Blue), band3(Infrarred),
so if I want to visualize the true color image, I would need to use this instruction:
TrueColor_img = img11[:,:,(0,1,2)]
but as you can see, the obtained visualization is very different from natural color.
I hope this helps, Jaime
Stéfan van der Walt
Mar 21, 2016, 7:23:53 PM3/21/16
to scikit-image
Hi Jaime
On 21 March 2016 at 16:02, Jaime Lopez Carvajal <jalo...@gmail.com> wrote:
> Of course, I would like to visualize the image like this (attached image),
> that was obtained using ArcMap software, with the usual band order for True
> Color (RGB) and Composite Infrared (CIR) in remote sensing applications.
> The tiff image that I loaded has 4 bands, so I would think that the order
> would be: band0(Red), band1(Green), band2(Blue), band3(Infrarred),
> so if I want to visualize the true color image, I would need to use this
> instruction:
> TrueColor_img = img11[:,:,(0,1,2)]
I'll take a look. Can you please upload an example tiff?
Thanks
Stéfan
On 21 March 2016 at 16:02, Jaime Lopez Carvajal <jalo...@gmail.com> wrote:
> Of course, I would like to visualize the image like this (attached image),
> that was obtained using ArcMap software, with the usual band order for True
> Color (RGB) and Composite Infrared (CIR) in remote sensing applications.
> The tiff image that I loaded has 4 bands, so I would think that the order
> would be: band0(Red), band1(Green), band2(Blue), band3(Infrarred),
> so if I want to visualize the true color image, I would need to use this
> instruction:
> TrueColor_img = img11[:,:,(0,1,2)]
Thanks
Stéfan
Stéfan van der Walt
Mar 21, 2016, 8:23:53 PM3/21/16
to scikit-image
Hi Jaime
These are the layers coming out of the TIFF reader:
https://gist.github.com/6881c3527b3099c49891
Can you recognize which ones are which? Do they look correct? Maybe
you can compare them against the ones you see in ArcMap.
Thanks!
Stéfan
> --
> You received this message because you are subscribed to the Google Groups
> "scikit-image" group.
> To unsubscribe from this group and stop receiving emails from it, send an
> email to scikit-image...@googlegroups.com.
> To post to this group, send email to scikit...@googlegroups.com.
> To view this discussion on the web, visit
> https://groups.google.com/d/msgid/scikit-image/eb050d76-64f7-4f24-a67f-aa2a4795d1c5%40googlegroups.com.
>
> For more options, visit https://groups.google.com/d/optout.
These are the layers coming out of the TIFF reader:
https://gist.github.com/6881c3527b3099c49891
Can you recognize which ones are which? Do they look correct? Maybe
you can compare them against the ones you see in ArcMap.
Thanks!
Stéfan
> You received this message because you are subscribed to the Google Groups
> "scikit-image" group.
> To unsubscribe from this group and stop receiving emails from it, send an
> email to scikit-image...@googlegroups.com.
> To post to this group, send email to scikit...@googlegroups.com.
> To view this discussion on the web, visit
> https://groups.google.com/d/msgid/scikit-image/eb050d76-64f7-4f24-a67f-aa2a4795d1c5%40googlegroups.com.
>
> For more options, visit https://groups.google.com/d/optout.

Christoph Gohlke
Mar 21, 2016, 10:35:21 PM3/21/16
to scikit...@googlegroups.com
I think the issue might be that the bands contain uint8 data stored as
uint16 (one extra bit seems used for GDAL's nodata) and the display
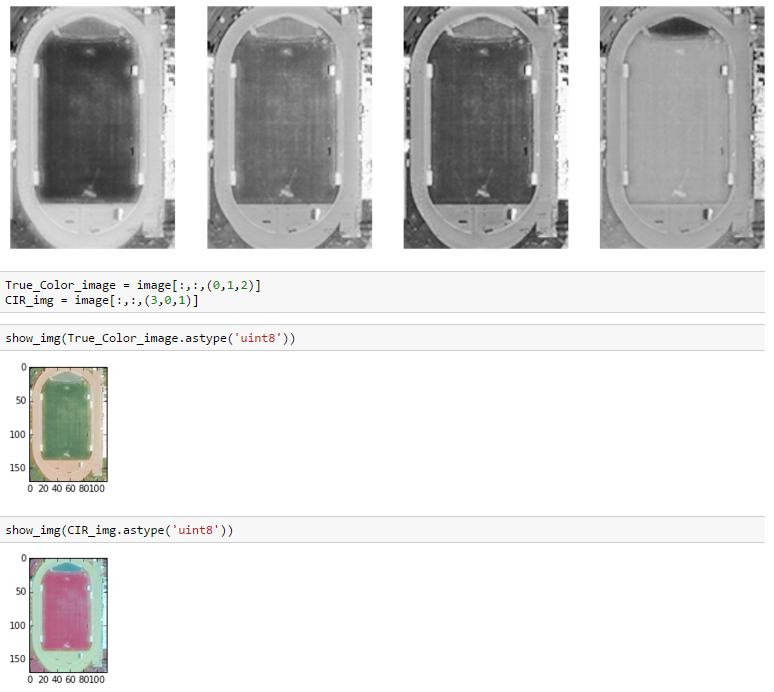
function `show_img` does not handle this. In this case casting the RGB
array to uint8 before display might work: show_img(img11a.astype('uint8'))
Christoph
uint16 (one extra bit seems used for GDAL's nodata) and the display
function `show_img` does not handle this. In this case casting the RGB
array to uint8 before display might work: show_img(img11a.astype('uint8'))
Christoph
Jaime Lopez Carvajal
Mar 22, 2016, 9:16:21 AM3/22/16
to scikit-image
Hi Stefan,
Accord to ArcMAp, the order of layers is 0,1,2,3 correspond to Red, Green, Blue, Infrared.
This way, if I want to visualize a true color image, I just use layers [0,1,2], in that order, and for CIR image the order would be [4,1,2].
So the order you ask me is: layers [0,1,2,3] = layers [Red, Green, Blue, Infrared]
Thanks, Jaime
Jaime Lopez Carvajal
Mar 22, 2016, 9:19:17 AM3/22/16
to scikit-image
Hi Christoph,
Thanks for your suggestion, I will try that, and will tell you if it works.
Jaime
Jaime Lopez Carvajal
Mar 22, 2016, 10:02:43 AM3/22/16
to scikit-image
Hi Stefan,
The problem was about radiometric resolution, because the original image is 16-bit, so I have to convert to 8-bit to visualize correctly.
Keep doing skimage great, I am using it on my research project about object based image classification.
Thanks for your time, Jaime
Reply all
Reply to author
Forward
0 new messages