Make xfce4-netload-plugin display next to netvm icon?
93 views
Skip to first unread message

Haw...@bitmessage.ch
Feb 14, 2017, 5:09:18 PM2/14/17
to qubes-users
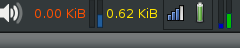
The network monitor plugin displays nicely colorized current network
traffic rate on the XFCE panel. I would like to get this displaying
the netVM's traffic rate, next to the red netvm in Dom0's panel.
However, typically it doesn't run in the "notification area", and I'm
not sure how to get it displayed in Dom0 (as the netvm icon is).
Can anyone point me in the right direction ?
Haw...@bitmessage.ch
Feb 17, 2017, 4:06:25 PM2/17/17
to qubes-users
As a generalization of my previous question:
I've seen screenshots (Joanna's:
https://cloud.githubusercontent.com/assets/10212863/16384754/7e131672-3c8a-11e6-8fc7-62bf9a1d90bf.png)
where a section of the panel seems to be showing the XFCE menubar from
another VM, such as sys-firewall. Perhaps I'm interpreting the colors
wrong, but I can't seem to figure out how to accomplish this. Does
anyone have any tips?
> --
> You received this message because you are subscribed to the Google
> Groups "qubes-users" group. To unsubscribe from this group and stop
> receiving emails from it, send an email to
> qubes-users...@googlegroups.com. To post to this group, send
> email to qubes...@googlegroups.com. To view this discussion on the
> web visit
> https://groups.google.com/d/msgid/qubes-users/37CFE930-E72A-44A8-86BC-36A437CF6727%40mail.bitmessage.ch.
> For more options, visit https://groups.google.com/d/optout.
I've seen screenshots (Joanna's:
https://cloud.githubusercontent.com/assets/10212863/16384754/7e131672-3c8a-11e6-8fc7-62bf9a1d90bf.png)
where a section of the panel seems to be showing the XFCE menubar from
another VM, such as sys-firewall. Perhaps I'm interpreting the colors
wrong, but I can't seem to figure out how to accomplish this. Does
anyone have any tips?
> You received this message because you are subscribed to the Google
> Groups "qubes-users" group. To unsubscribe from this group and stop
> receiving emails from it, send an email to
> qubes-users...@googlegroups.com. To post to this group, send
> email to qubes...@googlegroups.com. To view this discussion on the
> web visit
> https://groups.google.com/d/msgid/qubes-users/37CFE930-E72A-44A8-86BC-36A437CF6727%40mail.bitmessage.ch.
> For more options, visit https://groups.google.com/d/optout.

Andrew David Wong
Feb 20, 2017, 5:05:51 AM2/20/17
to Haw...@bitmessage.ch, qubes-users
-----BEGIN PGP SIGNED MESSAGE-----
Hash: SHA512
On 2017-02-17 13:06, Haw...@bitmessage.ch wrote:
> As a generalization of my previous question:
>
> I've seen screenshots (Joanna's:
> https://cloud.githubusercontent.com/assets/10212863/16384754/7e131672-3c8a-11e6-8fc7-62bf9a1d90bf.png)
> where a section of the panel seems to be showing the XFCE menubar from
> another VM, such as sys-firewall. Perhaps I'm interpreting the colors
> wrong, but I can't seem to figure out how to accomplish this. Does
> anyone have any tips?
>
I actually don't see what you describe in that screenshot. Can you
explain in more detail what you mean?
P.S. - Please don't top-post.
>
> On Tue, 14 Feb 2017 16:09:10 -0600
> <Haw...@bitmessage.ch> wrote:
>
>> The network monitor plugin displays nicely colorized current network
>> traffic rate on the XFCE panel. I would like to get this displaying
>> the netVM's traffic rate, next to the red netvm in Dom0's panel.
>> However, typically it doesn't run in the "notification area", and I'm
>> not sure how to get it displayed in Dom0 (as the netvm icon is).
>>
>> Can anyone point me in the right direction ?
>>
- --
Andrew David Wong (Axon)
Community Manager, Qubes OS
https://www.qubes-os.org
-----BEGIN PGP SIGNATURE-----
iQIcBAEBCgAGBQJYqr9yAAoJENtN07w5UDAwS4UQAJGW2Rh7guMBIHdZSStECOzL
B7lLSkRd3o7FpGerui4RVsc/Wf/G0zq2QTxmLYte1mEcnnL3WA1B1jqi0BZ/gVX6
i4napzVVuXA7xJHsVtYxHYL43Vx9XlhU54LgJlJluoiG1reyOTq0DI05Hqp+qPOc
Tf9f6aI6mPa3S3faLChY6Mqw1BV15YUNMJs8sehmc0pzDIbyec3uhFiadNjbPUFD
65VIg9RWiD3uQ9aaqZ52agB16q46Zsw4jT+uYvwWBRxpAaxrDPh9ftsgTCO95ys8
YjOX/TWZo9HAoXB7yPdJQxSP+bIIbtuokFQ/LbB/t4e7hS+XmHyV0+JzQzw+UpLZ
qsEjIPKPZox4VmFHKjR4bUbgdJKfrYuxXCleP2de7zqnzShCsdAMaxYfSgm4+bQd
DB8LC1LhwxYhQNA0uJtyja3I6+qAgId/VlL3kHycRZ5GvkZkrktUn+SOlf6+PrJD
vFqHW2cfJgoi9UXXj9uhKRihguVKLCRlR0aRJJ5RvYG20aaRqbQ5XB45H9ADN2FY
qwCkXlDjcIobRXugn6MBVa+51CWIYs+u08XsJiO9LH8b2LnN1sNaxEB1hKWbwFt6
wOYR9zHOcek6Zhbedixwnr2Ca6pMBLYjqOgZhI3zRVSaps/k6Hk8xZz70CTiehf9
afX9jnwJV38fczZKGwSC
=YHT3
-----END PGP SIGNATURE-----
Hash: SHA512
On 2017-02-17 13:06, Haw...@bitmessage.ch wrote:
> As a generalization of my previous question:
>
> I've seen screenshots (Joanna's:
> https://cloud.githubusercontent.com/assets/10212863/16384754/7e131672-3c8a-11e6-8fc7-62bf9a1d90bf.png)
> where a section of the panel seems to be showing the XFCE menubar from
> another VM, such as sys-firewall. Perhaps I'm interpreting the colors
> wrong, but I can't seem to figure out how to accomplish this. Does
> anyone have any tips?
>
explain in more detail what you mean?
P.S. - Please don't top-post.
>
> On Tue, 14 Feb 2017 16:09:10 -0600
> <Haw...@bitmessage.ch> wrote:
>
>> The network monitor plugin displays nicely colorized current network
>> traffic rate on the XFCE panel. I would like to get this displaying
>> the netVM's traffic rate, next to the red netvm in Dom0's panel.
>> However, typically it doesn't run in the "notification area", and I'm
>> not sure how to get it displayed in Dom0 (as the netvm icon is).
>>
>> Can anyone point me in the right direction ?
>>
Andrew David Wong (Axon)
Community Manager, Qubes OS
https://www.qubes-os.org
-----BEGIN PGP SIGNATURE-----
iQIcBAEBCgAGBQJYqr9yAAoJENtN07w5UDAwS4UQAJGW2Rh7guMBIHdZSStECOzL
B7lLSkRd3o7FpGerui4RVsc/Wf/G0zq2QTxmLYte1mEcnnL3WA1B1jqi0BZ/gVX6
i4napzVVuXA7xJHsVtYxHYL43Vx9XlhU54LgJlJluoiG1reyOTq0DI05Hqp+qPOc
Tf9f6aI6mPa3S3faLChY6Mqw1BV15YUNMJs8sehmc0pzDIbyec3uhFiadNjbPUFD
65VIg9RWiD3uQ9aaqZ52agB16q46Zsw4jT+uYvwWBRxpAaxrDPh9ftsgTCO95ys8
YjOX/TWZo9HAoXB7yPdJQxSP+bIIbtuokFQ/LbB/t4e7hS+XmHyV0+JzQzw+UpLZ
qsEjIPKPZox4VmFHKjR4bUbgdJKfrYuxXCleP2de7zqnzShCsdAMaxYfSgm4+bQd
DB8LC1LhwxYhQNA0uJtyja3I6+qAgId/VlL3kHycRZ5GvkZkrktUn+SOlf6+PrJD
vFqHW2cfJgoi9UXXj9uhKRihguVKLCRlR0aRJJ5RvYG20aaRqbQ5XB45H9ADN2FY
qwCkXlDjcIobRXugn6MBVa+51CWIYs+u08XsJiO9LH8b2LnN1sNaxEB1hKWbwFt6
wOYR9zHOcek6Zhbedixwnr2Ca6pMBLYjqOgZhI3zRVSaps/k6Hk8xZz70CTiehf9
afX9jnwJV38fczZKGwSC
=YHT3
-----END PGP SIGNATURE-----
Haw...@bitmessage.ch
Feb 20, 2017, 1:02:31 PM2/20/17
to qubes...@googlegroups.com
On Mon, 20 Feb 2017 02:05:41 -0800
Andrew David Wong <a...@qubes-os.org> wrote:
> -----BEGIN PGP SIGNED MESSAGE-----
> Hash: SHA512
>
> On 2017-02-17 13:06, Haw...@bitmessage.ch wrote:
> > As a generalization of my previous question:
> >
> > I've seen screenshots (Joanna's:
> > https://cloud.githubusercontent.com/assets/10212863/16384754/7e131672-3c8a-11e6-8fc7-62bf9a1d90bf.png)
> > where a section of the panel seems to be showing the XFCE menubar
> > from another VM, such as sys-firewall. Perhaps I'm interpreting the
> > colors wrong, but I can't seem to figure out how to accomplish
> > this. Does anyone have any tips?
> >
>
> I actually don't see what you describe in that screenshot. Can you
> explain in more detail what you mean?
>
> P.S. - Please don't top-post.
It looks to me like the little green monitor bars and green text in
Andrew David Wong <a...@qubes-os.org> wrote:
> -----BEGIN PGP SIGNED MESSAGE-----
> Hash: SHA512
>
> On 2017-02-17 13:06, Haw...@bitmessage.ch wrote:
> > As a generalization of my previous question:
> >
> > I've seen screenshots (Joanna's:
> > https://cloud.githubusercontent.com/assets/10212863/16384754/7e131672-3c8a-11e6-8fc7-62bf9a1d90bf.png)
> > where a section of the panel seems to be showing the XFCE menubar
> > from another VM, such as sys-firewall. Perhaps I'm interpreting the
> > colors wrong, but I can't seem to figure out how to accomplish
> > this. Does anyone have any tips?
> >
>
> I actually don't see what you describe in that screenshot. Can you
> explain in more detail what you mean?
>
> P.S. - Please don't top-post.
the upper right might be displaying sys-firewall data. I could be
wrong, but am curious either way.
>
> >
> > On Tue, 14 Feb 2017 16:09:10 -0600
> > <Haw...@bitmessage.ch> wrote:
> >
> >> The network monitor plugin displays nicely colorized current
> >> network traffic rate on the XFCE panel. I would like to get this
> >> displaying the netVM's traffic rate, next to the red netvm in
> >> Dom0's panel. However, typically it doesn't run in the
> >> "notification area", and I'm not sure how to get it displayed in
> >> Dom0 (as the netvm icon is).
> >>
> >> Can anyone point me in the right direction ?
XFCE install) that I was hoping to display in dom0, but with
real-time data from netvm or firewall. The goal is to see all
current network traffic easily.
Thanks!
Haw...@bitmessage.ch
Feb 20, 2017, 1:06:42 PM2/20/17
to qubes...@googlegroups.com
>
>
> >
> > - --
> > Andrew David Wong (Axon)
> > Community Manager, Qubes OS
> > https://www.qubes-os.org
> > -----BEGIN PGP SIGNATURE-----
> >
> > iQIcBAEBCgAGBQJYqr9yAAoJENtN07w5UDAwS4UQAJGW2Rh7guMBIHdZSStECOzL
> > B7lLSkRd3o7FpGerui4RVsc/Wf/G0zq2QTxmLYte1mEcnnL3WA1B1jqi0BZ/gVX6
> > i4napzVVuXA7xJHsVtYxHYL43Vx9XlhU54LgJlJluoiG1reyOTq0DI05Hqp+qPOc
> > Tf9f6aI6mPa3S3faLChY6Mqw1BV15YUNMJs8sehmc0pzDIbyec3uhFiadNjbPUFD
> > 65VIg9RWiD3uQ9aaqZ52agB16q46Zsw4jT+uYvwWBRxpAaxrDPh9ftsgTCO95ys8
> > YjOX/TWZo9HAoXB7yPdJQxSP+bIIbtuokFQ/LbB/t4e7hS+XmHyV0+JzQzw+UpLZ
> > qsEjIPKPZox4VmFHKjR4bUbgdJKfrYuxXCleP2de7zqnzShCsdAMaxYfSgm4+bQd
> > DB8LC1LhwxYhQNA0uJtyja3I6+qAgId/VlL3kHycRZ5GvkZkrktUn+SOlf6+PrJD
> > vFqHW2cfJgoi9UXXj9uhKRihguVKLCRlR0aRJJ5RvYG20aaRqbQ5XB45H9ADN2FY
> > qwCkXlDjcIobRXugn6MBVa+51CWIYs+u08XsJiO9LH8b2LnN1sNaxEB1hKWbwFt6
> > wOYR9zHOcek6Zhbedixwnr2Ca6pMBLYjqOgZhI3zRVSaps/k6Hk8xZz70CTiehf9
> > afX9jnwJV38fczZKGwSC
> > =YHT3
> > -----END PGP SIGNATURE-----
> >
>
>
> --
> You received this message because you are subscribed to the Google
> Groups "qubes-users" group. To unsubscribe from this group and stop
> receiving emails from it, send an email to
> qubes-users...@googlegroups.com. To post to this group, send
> email to qubes...@googlegroups.com. To view this discussion on the
> web visit
> https://groups.google.com/d/msgid/qubes-users/D048C965-4D5F-464F-ACC5-CC56A0AB02EC%40mail.bitmessage.ch.
> You received this message because you are subscribed to the Google
> Groups "qubes-users" group. To unsubscribe from this group and stop
> receiving emails from it, send an email to
> qubes-users...@googlegroups.com. To post to this group, send
> email to qubes...@googlegroups.com. To view this discussion on the
> web visit
Unman
Feb 20, 2017, 5:27:24 PM2/20/17
to Haw...@bitmessage.ch, qubes...@googlegroups.com
applet from sys-net to the dom0 panel. I don't think this can be easily
done.
You can, of course, open a xfce-panel and run the applet in that, but
this wont be locked to the dom0 panel, and will be a freefloating
window.
An alternative would be to choose a monitor that uses the system tray
because Qubes will automatically incorporate this in to the dom0 system
tray, (like the nm-applet).
For example, you could install indicator-multiload and have it
automatically start configured to show network traffic - this should
appear in the system tray. I think that shows graphs so it isn't exactly
what you are looking for.
I'm probably missing something obvious but this solution will work as you
want.
Another approach might be to run conky configured semi-transparent so
you retain the output but don't lose screen space.
unman
Haw...@bitmessage.ch
Feb 20, 2017, 6:37:12 PM2/20/17
to qubes...@googlegroups.com
--preferences" in the netvm, and add a new panel via the panel gui,
followed by the applet?
>
> An alternative would be to choose a monitor that uses the system tray
> because Qubes will automatically incorporate this in to the dom0
> system tray, (like the nm-applet).
> For example, you could install indicator-multiload and have it
> automatically start configured to show network traffic - this should
> appear in the system tray. I think that shows graphs so it isn't
> exactly what you are looking for.
> I'm probably missing something obvious but this solution will work as
> you want.
>
> Another approach might be to run conky configured semi-transparent so
> you retain the output but don't lose screen space.
>
> unman
on the wish-list for the Fedora repos.
I guess Conky might be a good way to go.
Thanks!
Andrew David Wong
Feb 21, 2017, 5:30:06 PM2/21/17
to Haw...@bitmessage.ch, qubes...@googlegroups.com
-----BEGIN PGP SIGNED MESSAGE-----
Hash: SHA512
Hash: SHA512
On 2017-02-20 10:02, Haw...@bitmessage.ch wrote:
> On Mon, 20 Feb 2017 02:05:41 -0800
> Andrew David Wong <a...@qubes-os.org> wrote:
>
> On 2017-02-17 13:06, Haw...@bitmessage.ch wrote:
>>>> As a generalization of my previous question:
>>>>
>>>> I've seen screenshots (Joanna's:
>>>> https://cloud.githubusercontent.com/assets/10212863/16384754/7e131672-3c8a-11e6-8fc7-62bf9a1d90bf.png)
>>>> where a section of the panel seems to be showing the XFCE menubar
>>>> from another VM, such as sys-firewall. Perhaps I'm interpreting the
>>>> colors wrong, but I can't seem to figure out how to accomplish
>>>> this. Does anyone have any tips?
>>>>
>
> I actually don't see what you describe in that screenshot. Can you
> explain in more detail what you mean?
>
> P.S. - Please don't top-post.
>
>> It looks to me like the little green monitor bars and green text in
>> the upper right might be displaying sys-firewall data. I could be
>> wrong, but am curious either way.
>
I think those are hardware sensor readings (e.g., temperature and/or
> On Mon, 20 Feb 2017 02:05:41 -0800
> Andrew David Wong <a...@qubes-os.org> wrote:
>
> On 2017-02-17 13:06, Haw...@bitmessage.ch wrote:
>>>> As a generalization of my previous question:
>>>>
>>>> I've seen screenshots (Joanna's:
>>>> https://cloud.githubusercontent.com/assets/10212863/16384754/7e131672-3c8a-11e6-8fc7-62bf9a1d90bf.png)
>>>> where a section of the panel seems to be showing the XFCE menubar
>>>> from another VM, such as sys-firewall. Perhaps I'm interpreting the
>>>> colors wrong, but I can't seem to figure out how to accomplish
>>>> this. Does anyone have any tips?
>>>>
>
> I actually don't see what you describe in that screenshot. Can you
> explain in more detail what you mean?
>
> P.S. - Please don't top-post.
>
>> It looks to me like the little green monitor bars and green text in
>> the upper right might be displaying sys-firewall data. I could be
>> wrong, but am curious either way.
>
disk activity indicators).
- --
Andrew David Wong (Axon)
Community Manager, Qubes OS
https://www.qubes-os.org
-----BEGIN PGP SIGNATURE-----
imZ8QhbGWCT//Wm6sRELD8ebC6W6S/Yn55PirlQFvqo3Dgbt1qzMmsxC2CKPssRl
fh4DqWlqP2bw9FNYWfh7Ca8JobM+tzMLOlAx6Cx6LnLCE/SLLvlCogU7PGxjQEan
nW1o/zAuIBJy2ByY8hYu8j55E8xKiD4LOSI16JzBYHZkxr6Ggj09TELy5L2GkXbv
fByxtd4mkW5h967mTI1creDTrsy9jJJfndRN+pvkOWS4VPBcOPP6Qo0Xz+izvT1i
TFM/Xy8PZzj9cadhTjDHzxjXAphtpADw6HyQLfSK2nWoU6y/mDzuMjQKk3t9LBD4
zekFAiBqoEkHL/pe9jXyeIpJWzlm8zSCMZfux85R8q5gHOvDk/+cgGHoRpbBMimj
ErQhCD2FieJNtShcbD+W73AANXeX9VmLPz3zzIuwZOSzzj/5mke2Si+0K9/QMK1P
PxvSOiqdpCv6cMCM0aOZOswNoPEgp6V1ayTN0KRRPN4hcscaQHKTG/lnNd6zyFMv
AsLp0HE8P3rz8VmH/K51B63ndT5EzvydzKD2fSTl/ouMKyl0JkAQDX2ffCEjfNn7
3RZSDNeuu8+eKbPlGv9H5J3MuDZU+yeyDvuS5OxY2YdMa5XIyC5SJS6kcMT9Ox/E
xV4pLNSRAuCHZcjtd8+e
=y/CE
-----END PGP SIGNATURE-----
Reply all
Reply to author
Forward
0 new messages