Fwd: Demo of Live VLF System
48 views
Skip to first unread message

Jonathan
Aug 30, 2021, 3:16:35 PM8/30/21
to ham...@googlegroups.com
Hi All,
I forgot to include this listserv as well. I’d like to demonstrate this on the Monday night (8/30/21) Tangerine SDR meeting. See message below.
Thanks.
Jonathan
KC3EEY
Begin forwarded message:
Begin forwarded message:
From: Jonathan <emum...@gmail.com>
Date: August 29, 2021 at 11:07:32 PM EDT
To: tanger...@lists.tapr.org
Subject: Demo of Live VLF System
Hi All,
This week I was able to test my Raspberry Pi VLF SDR box with my VLF receiver! I’m very happy with the results and I’d like to do a demo of the the preliminary setup and signal verification at the Monday night (8/30/21) meeting. This will also include a live stream of the filtered VLF audio and plots of NAA amplitude and phase. I have attached some preview screenshots.
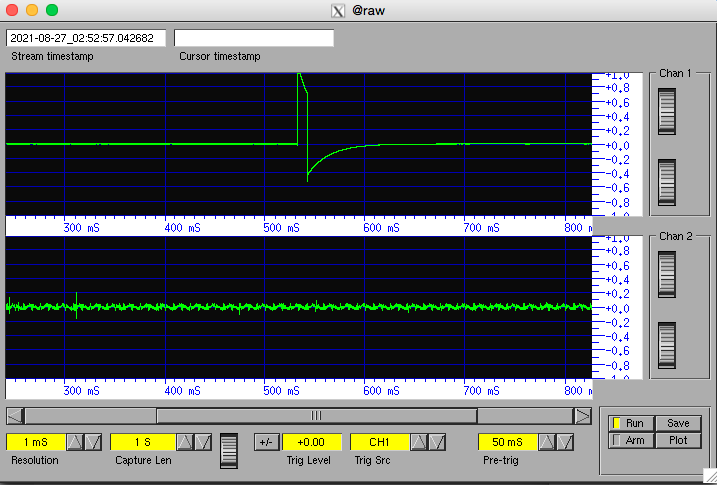
This is the oscope program showing the GPS PPS pulse and VLF audio.
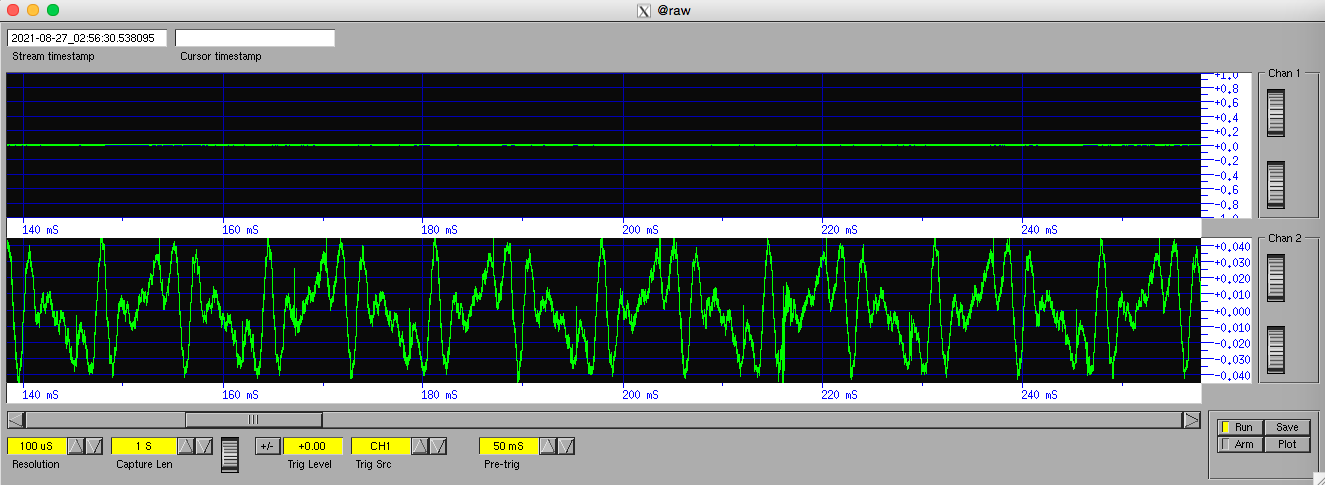
The adjusted time scale shows 60Hz power and harmonics in the VLF audio.
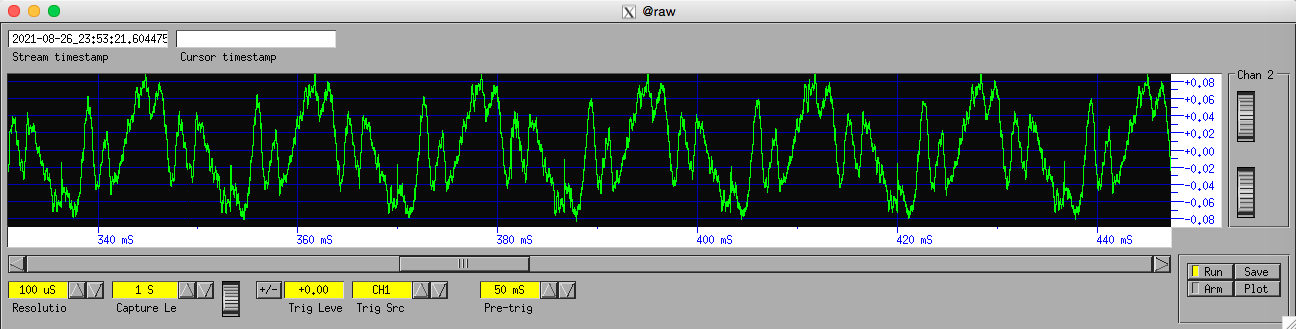
This shows the density of mains harmonics.
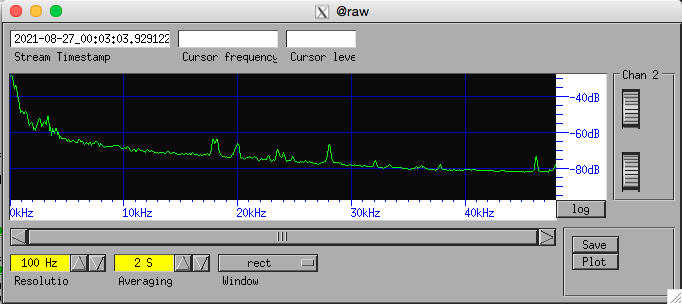
This is the spectrogram program showing the VLF receiver audio in the frequency domain. Notice most of the spectral power is contained in the portion of the band with the mains and it’s harmonics, as well as some peaks of interesting signals. In a mains heavy environment, these could be switch-mode power supply emissions.
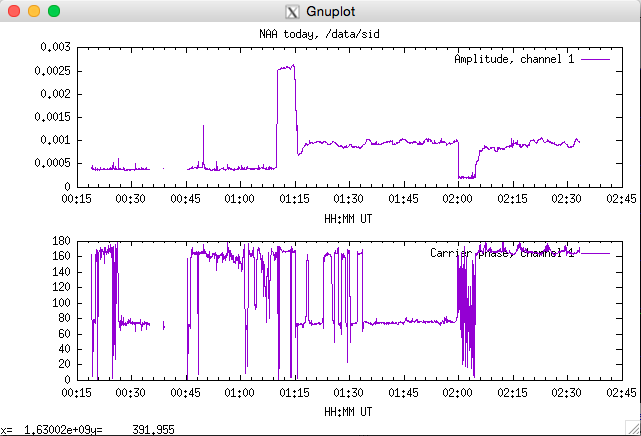
This is a short plot of NAA’s amplitude and phase as extracted from the timestamped VLF stream. You’ll notice the variations of both phase and amplitude that are probably local interference, due to being in a very mains heavy suburban area.
Jonathan
KC3EEY
Jonathan
Aug 31, 2021, 12:47:51 PM8/31/21
to ham...@googlegroups.com, tanger...@lists.tapr.org
Hi All,
Here are some pictures of the Raspberry Pi VLF SDR box, antenna, and VLF preamp I used with this setup.
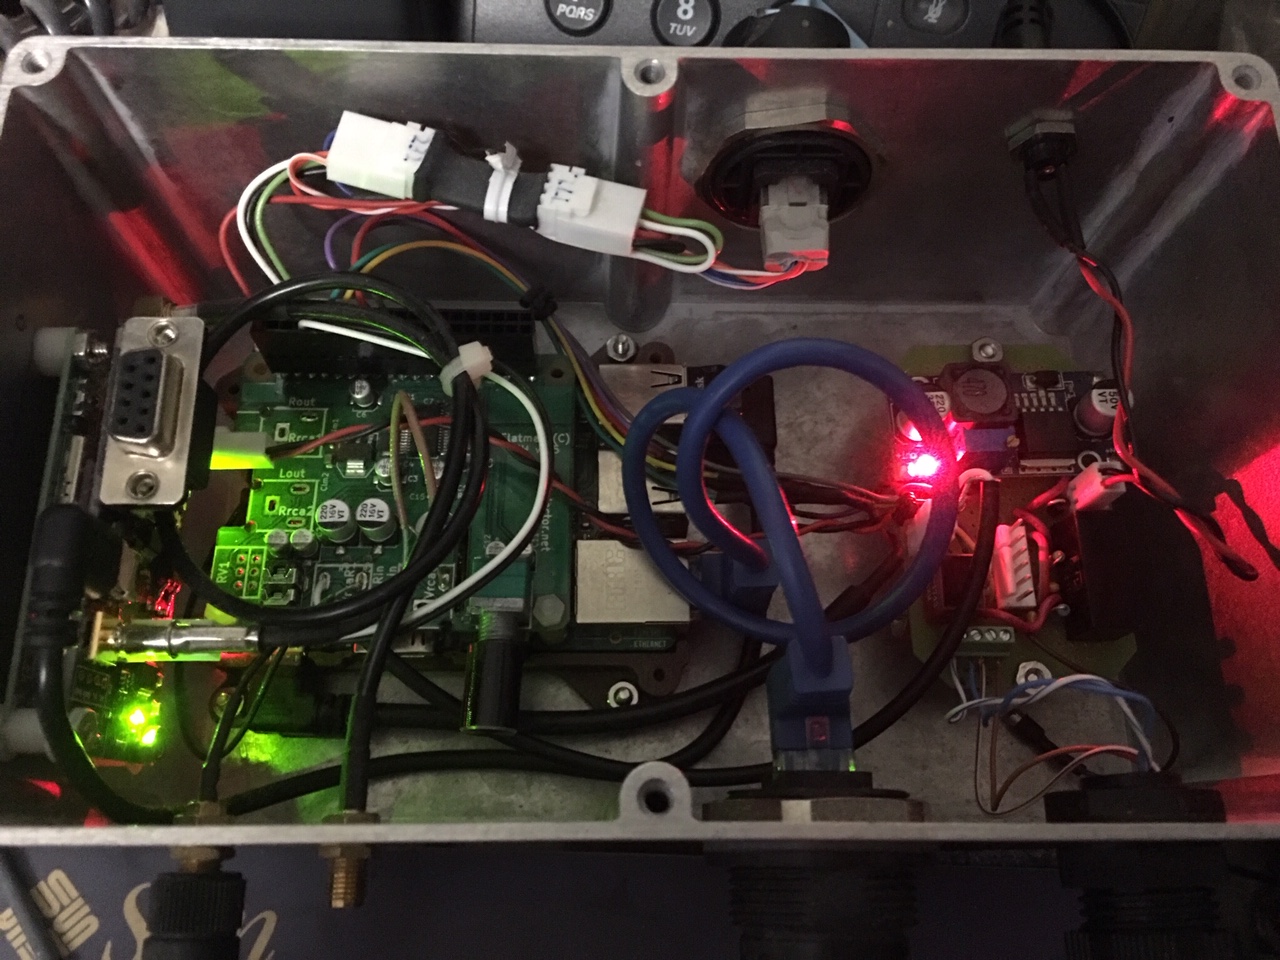
This is the Raspberry Pi box. Everything is installed in a Hammond aluminum enclosure. I added a pigtail on the Pi for an external WiFi antenna. On the left is the Trimble RES SMT360 and an interface board. In the center is the Raspberry Pi with Audio Injector Stereo soundcard. On the right is the power/audio board. It contains a DC-DC converter to power both the Pi and the Trimble interface board. It also contains another DC-DC converter that is isolated and audio isolation transformer for the VLF preamp, and connections that interface a safe “shutdown -h now” button, power, VLF stream, and timestamp-corrected VLF stream LED indicators on the enclosure cover and Pi header. The GPS PPS is fed into both one channel of the soundcard and a GPIO pin. There are connections for both GPS and WiFi antennas, as well as Ethernet and a RS232 serial console for the Pi’s console port. The VLF receiver feedline comes into a cable gland using cat5 cable with one pair for power and the other pair for audio. Everything is powered with a 12V 1.5A unregulated wall adapter.
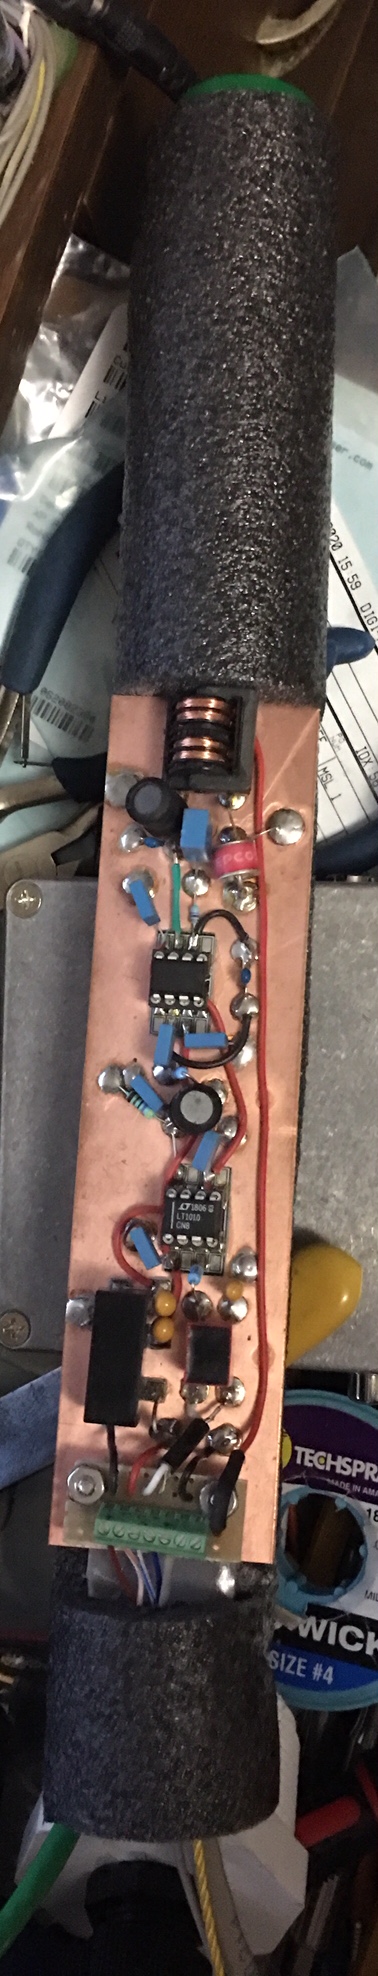
This is the VLF preamp board mounted on a foam insert that is inside a PVC pipe. It’s made up of a front end that connects to an E-Field antenna probe. It contains a filter to notch 60Hz a bit and also has some gain. The output is fed into an analog buffer driver and to an audio isolation transformer. The whole preamp is powered with an isolated DC-DC converter. Both power and audio isolation are required or else 60Hz mains can make its way to the front end and overload it.
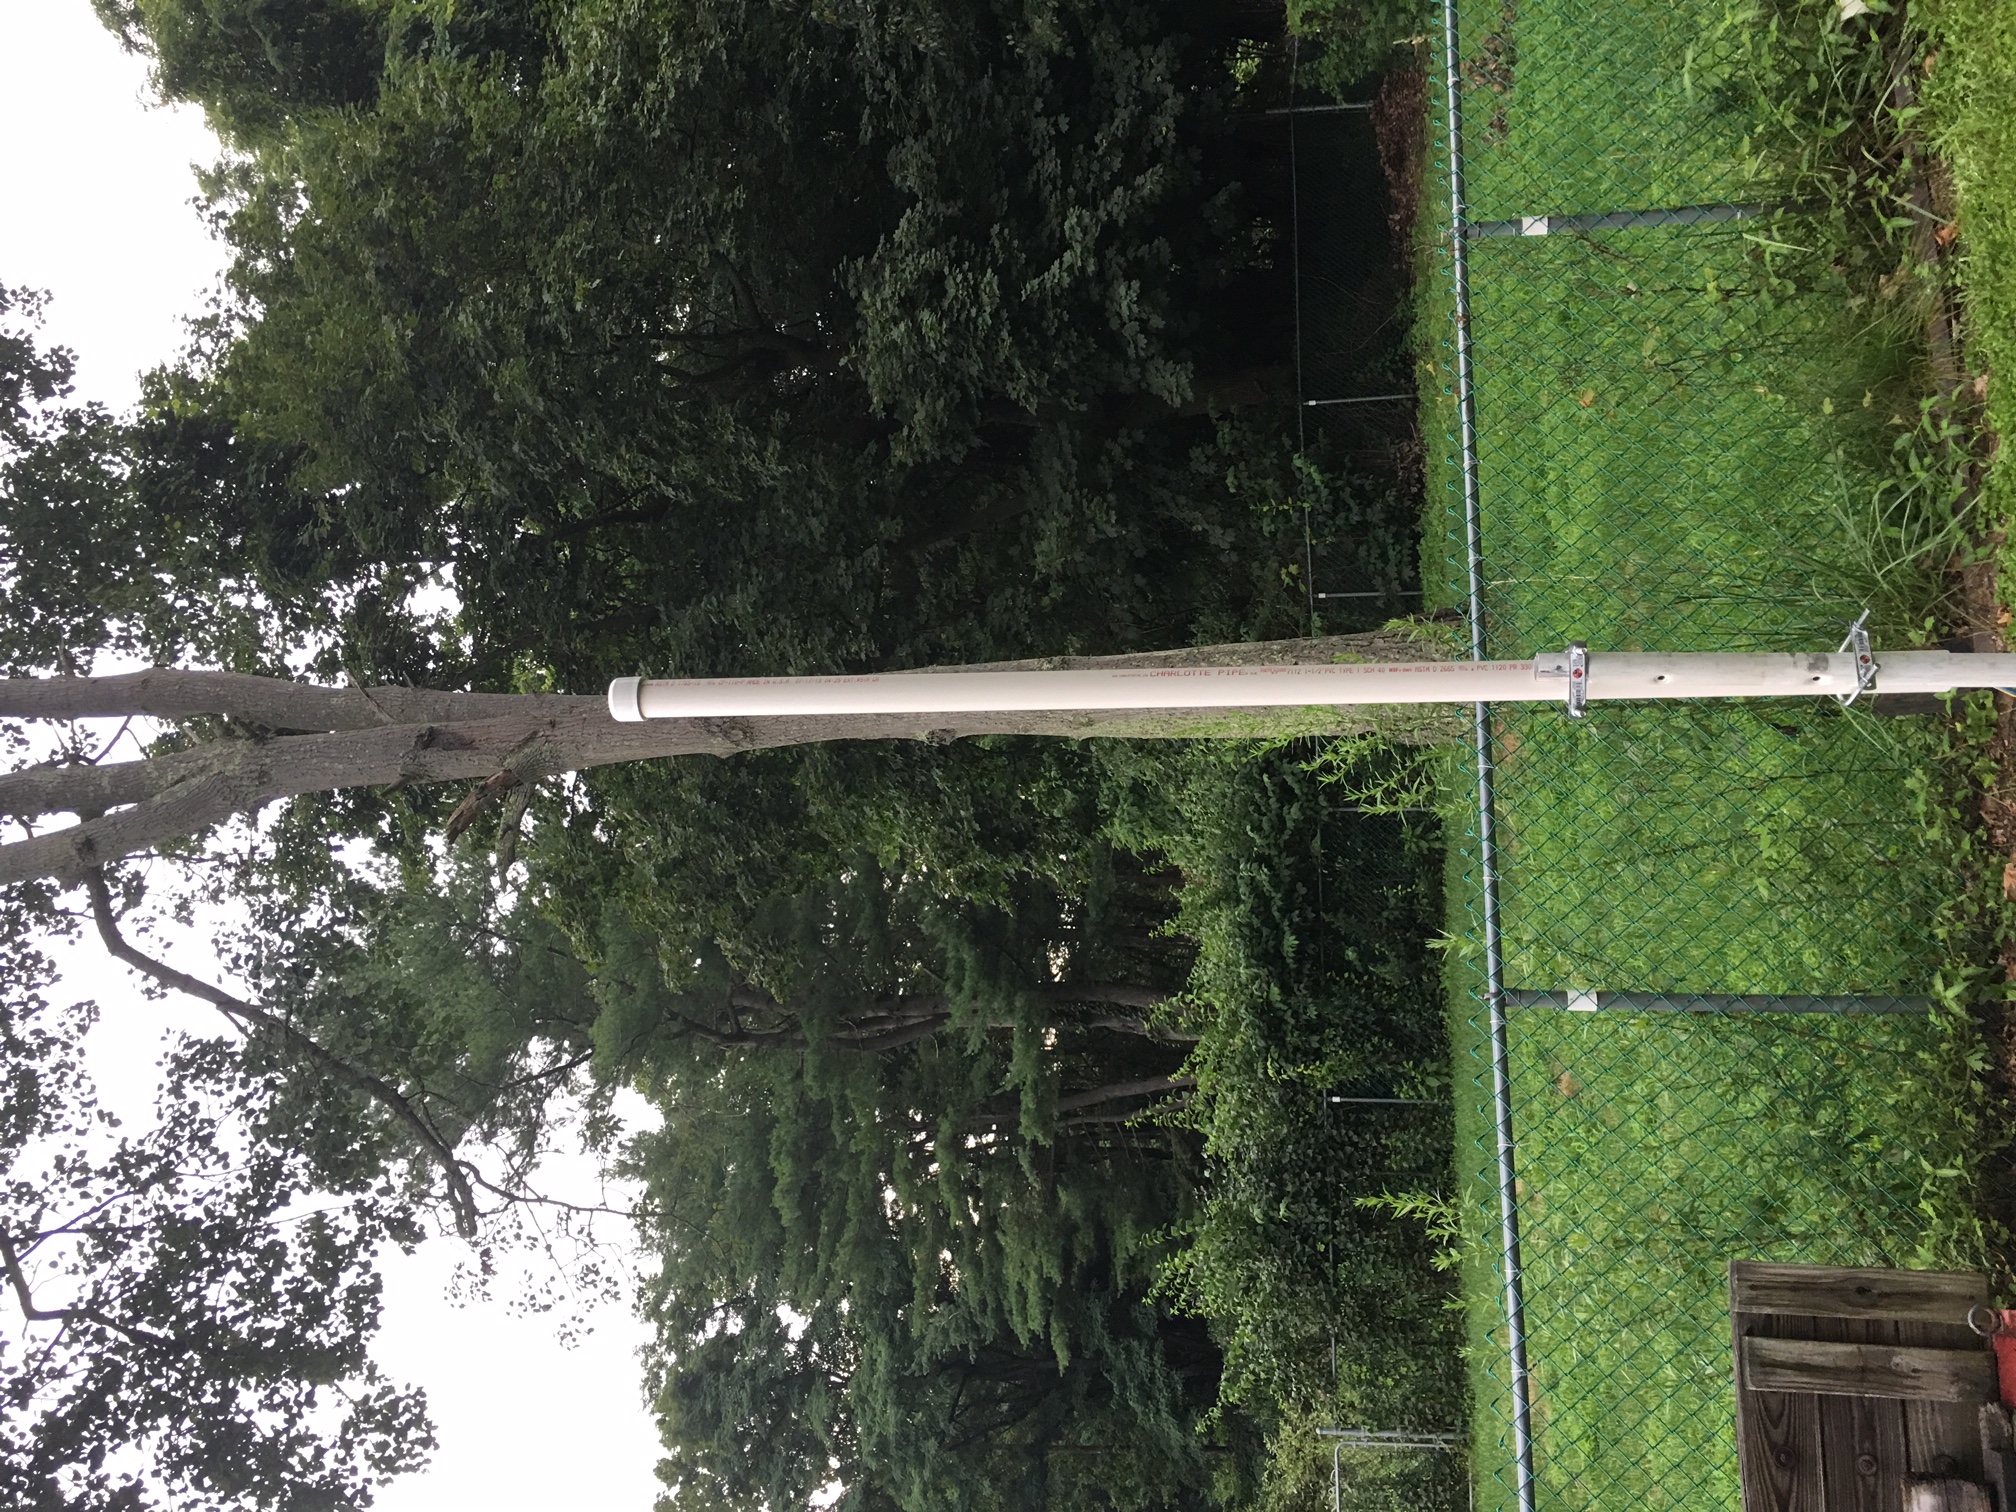
This is the antenna/preamp assembly. The antenna element is a foam insert with copper tape along the length. The copper tape is the actual element. The preamp insert goes in after the antenna insert, and a wire is soldered in between the copper tape and VLF preamp to make the antenna connection. An earth ground connection is made between the preamp and a ground strap.
Jonathan
KC3EEY
Hi All,I forgot to include this listserv as well. I’d like to demonstrate this on the Monday night (8/30/21) Tangerine SDR meeting. See message below.Thanks.JonathanKC3EEY
Begin forwarded message:From: Jonathan <emum...@gmail.com>
Date: August 29, 2021 at 11:07:32 PM EDT
To: tanger...@lists.tapr.org
Subject: Demo of Live VLF SystemHi All,
This week I was able to test my Raspberry Pi VLF SDR box with my VLF receiver! I’m very happy with the results and I’d like to do a demo of the the preliminary setup and signal verification at the Monday night (8/30/21) meeting. This will also include a live stream of the filtered VLF audio and plots of NAA amplitude and phase. I have attached some preview screenshots.
<image1.png>
This is the oscope program showing the GPS PPS pulse and VLF audio.
<image2.png>
The adjusted time scale shows 60Hz power and harmonics in the VLF audio.
<image3.png>
This shows the density of mains harmonics.
<image4.png>
This is the spectrogram program showing the VLF receiver audio in the frequency domain. Notice most of the spectral power is contained in the portion of the band with the mains and it’s harmonics, as well as some peaks of interesting signals. In a mains heavy environment, these could be switch-mode power supply emissions.
<image5.png>

Khan Tran
Aug 31, 2021, 12:50:35 PM8/31/21
to ham...@googlegroups.com
Hello Jonathan,
That’s pretty cool. Thanks for the share. I’ll take a deeper look at it after homework.
73, khan KE8QWB
--
Please follow the HamSCI Community Participation Guidelines at http://hamsci.org/hamsci-community-participation-guidelines.
---
You received this message because you are subscribed to the Google Groups "HamSCI" group.
To unsubscribe from this group and stop receiving emails from it, send an email to hamsci+un...@googlegroups.com.
To view this discussion on the web visit https://groups.google.com/d/msgid/hamsci/4757BADA-4EDC-483A-8154-43A4CB19A9AE%40gmail.com.

Gregory Popelas
Aug 31, 2021, 12:53:51 PM8/31/21
to ham...@googlegroups.com
I echo Khan’s comments .
Very cool.
Well done Jonathan.
Hello Jonathan,That’s pretty cool. Thanks for the share. I’ll take a deeper look at it after homework.73, khan KE8QWB
On Mon, Aug 30, 2021 at 3:16 PM Jonathan <emum...@gmail.com> wrote:
Hi All,I forgot to include this listserv as well. I’d like to demonstrate this on the Monday night (8/30/21) Tangerine SDR meeting. See message below.Thanks.JonathanKC3EEY
Begin forwarded message:From: Jonathan <emum...@gmail.com>
Date: August 29, 2021 at 11:07:32 PM EDT
To: tanger...@lists.tapr.org
Subject: Demo of Live VLF SystemHi All,
This week I was able to test my Raspberry Pi VLF SDR box with my VLF receiver! I’m very happy with the results and I’d like to do a demo of the the preliminary setup and signal verification at the Monday night (8/30/21) meeting. This will also include a live stream of the filtered VLF audio and plots of NAA amplitude and phase. I have attached some preview screenshots.
<image1.png>
This is the oscope program showing the GPS PPS pulse and VLF audio.
<image2.png>
The adjusted time scale shows 60Hz power and harmonics in the VLF audio.
<image3.png>
This shows the density of mains harmonics.
<image4.png>
This is the spectrogram program showing the VLF receiver audio in the frequency domain. Notice most of the spectral power is contained in the portion of the band with the mains and it’s harmonics, as well as some peaks of interesting signals. In a mains heavy environment, these could be switch-mode power supply emissions.
<image5.png>
This is a short plot of NAA’s amplitude and phase as extracted from the timestamped VLF stream. You’ll notice the variations of both phase and amplitude that are probably local interference, due to being in a very mains heavy suburban area.
Jonathan
KC3EEY
--
Please follow the HamSCI Community Participation Guidelines at http://hamsci.org/hamsci-community-participation-guidelines.
---
You received this message because you are subscribed to the Google Groups "HamSCI" group.
To unsubscribe from this group and stop receiving emails from it, send an email to hamsci+un...@googlegroups.com.
To view this discussion on the web visit https://groups.google.com/d/msgid/hamsci/4757BADA-4EDC-483A-8154-43A4CB19A9AE%40gmail.com.
--
Please follow the HamSCI Community Participation Guidelines at http://hamsci.org/hamsci-community-participation-guidelines.
---
You received this message because you are subscribed to the Google Groups "HamSCI" group.
To unsubscribe from this group and stop receiving emails from it, send an email to hamsci+un...@googlegroups.com.
To view this discussion on the web visit https://groups.google.com/d/msgid/hamsci/CAM%3DKUnNRRGk4kxh96j%2B_m7e54ncHBBeVWknO4mmUUJdZpT48OQ%40mail.gmail.com.

John Magliacane
Sep 2, 2021, 11:09:53 AM9/2/21
to ham...@googlegroups.com
Moore Observatory located at the University of Louisville (Kentucky) has a simple VLF receiver tuned to NAA at 24 kHz that has been used to record and plot NAA signal strength for over 20 years. This is being done as part of their research into Gamma Ray Bursts and Solar Flares.
Details of their operation can be found here:
http://moondog.astro.louisville.edu/
Just thought I'd mention it for anyone interested in this sort of thing...
73 de John, KD2BD
Details of their operation can be found here:
http://moondog.astro.louisville.edu/
Just thought I'd mention it for anyone interested in this sort of thing...
73 de John, KD2BD
Jonathan
Sep 3, 2021, 11:47:40 AM9/3/21
to TangerineSDR Listserv, ham...@googlegroups.com
Thanks Khan and Greg!
For those who did not get a chance to see the presentation, here is the YouTube link:
https://youtu.be/GAmbDQd8kR0?t=977
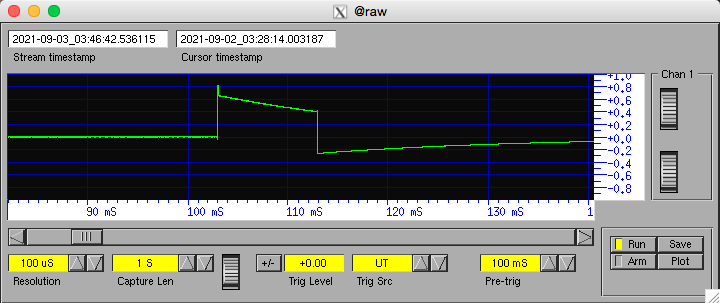
In the beginning of the presentation, I mentioned that the PPS pulse was getting clipped because it was over the dynamic range of the sound card. I used the potentiometer that came with the Audio Injector Stereo as a voltage divider to reduce the level of the PPS pulse so it doesn’t clip. As a result, I don’t get any timing errors anymore! Attached is the trace of the PPS pulse.
Since the potentiometer is double ganged for stereo, I shorted the wiper and output as well as desoldereding the ground connection, so the signal from the VLF receiver would bypass it completely and wouldn’t be attenuated.
John,
With a system like this and vlfrx-tools, NAA and others can be monitored for GRBs and geomagnetic activity too. Thanks for posting the link!
Jonathan
KC3EEY
> --
> Please follow the HamSCI Community Participation Guidelines at
> http://hamsci.org/hamsci-community-participation-guidelines.
> ---
> You received this message because you are subscribed to the Google Groups
> "HamSCI" group.
> To unsubscribe from this group and stop receiving emails from it, send an
> email to hamsci+un...@googlegroups.com.
> To view this discussion on the web visit
Reply all
Reply to author
Forward
0 new messages