Chart library for django
Luvpreet Singh
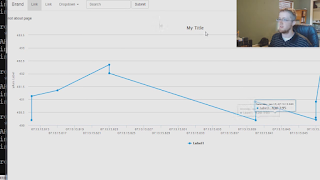
I am looking for some solution to display django database queryset to django admin over graphs.
I had used highcharts to do that earlier, but to use highcharts, I have to write too much scripts and functions.
Is there any kind of inbuilt library that comes with django similar to highcharts by which I can display django database queryset in my django admin template ?
Like in the picture above.
Lachlan Musicman
The most dangerous phrase in the language is, "We've always done it this way."
- Grace Hopper
--
You received this message because you are subscribed to the Google Groups "Django users" group.
To unsubscribe from this group and stop receiving emails from it, send an email to django-users+unsubscribe@googlegroups.com.
To post to this group, send email to django...@googlegroups.com.
Visit this group at https://groups.google.com/group/django-users.
To view this discussion on the web visit https://groups.google.com/d/msgid/django-users/814318bb-dddf-4a99-afce-e29bf22c434a%40googlegroups.com.
For more options, visit https://groups.google.com/d/optout.
Larry Martell
But they are both client side, and have nothing to do with django.
Melvyn Sopacua
On Sunday 05 March 2017 22:10:07 Luvpreet Singh wrote:
> I am looking for some solution to display django database queryset to
> django admin over graphs.
https://djangopackages.org/grids/g/charts/
Problem is, the majority is abandonware.
--
Melvyn Sopacua
Vijay Khemlani
(usually a static image) is not as good as using a JS library.
I use Highcharts, just had to make a little layer on top of it to make
it compatible with the JSON django was generating.
It also encourages separation of concerns between the frontend and backend
> You received this message because you are subscribed to the Google Groups
> "Django users" group.
> To unsubscribe from this group and stop receiving emails from it, send an
> Visit this group at https://groups.google.com/group/django-users.
> To view this discussion on the web visit
Melvyn Sopacua
On Monday 06 March 2017 12:04:16 Vijay Khemlani wrote:
> Rendering server-side charts is usually a mess, and the result
> (usually a static image) is not as good as using a JS library.
Well first - I count 10 of that grid without looking at details that use JS to render. So that's the majority. Secondly, even if we were rendering graphs at the server - that is a matter of choice each with its own pro's and cons.
Yes, JS graphs, especially those that are canvas based have come a long way in rendering capabilities. But the quality for the end user is unpredictable as is the performance, whereas the server has predictable and manageable resources - what is more important is defined by the project requirements.
Display quality of server side generated images may exceed JS rendered, depending on how far you're willing to take the rendering. The cost of sending a graph is that has not altered its data can be minimized with server side caching techniques such as nginx's proxy_store directive.
> It also encourages separation of concerns between the frontend and
> backend
But there are concerns that are tied together:
- the data, duh
- graph type often depending on data
- title, legend, labels
All this is dictated by the content at the server and has to be injected into js via template rendering. The packages in that grid aim to do just that (and I cound 3 that use highcharts).
--
Melvyn Sopacua
acheraime .
--
You received this message because you are subscribed to the Google Groups "Django users" group.
To unsubscribe from this group and stop receiving emails from it, send an email to django-users+unsubscribe@googlegroups.com.
To post to this group, send email to django...@googlegroups.com.
Visit this group at https://groups.google.com/group/django-users.
To view this discussion on the web visit https://groups.google.com/d/msgid/django-users/4339883.fqjLW2Zd6i%40devstation.
Fabio C. Barrionuevo da Luz
https://github.com/agiliq/django-graphos
https://github.com/agiliq/django-graphos#charting-api-supported
live sample: http://agiliq.com/demo/graphos/
To view this discussion on the web visit https://groups.google.com/d/msgid/django-users/CA%2BfkitLEDOrsajbaqThJH1RvL3QB5Kid12Onj4-LFMqZLMEO8A%40mail.gmail.com.
Palmas - Tocantins - Brasil - América do Sul

