plot_ly שאלה/ עזרה
17 views
Skip to first unread message

gooloo
Jun 13, 2016, 2:03:07 PM6/13/16
to Israel R User Group
שלום לכולם,
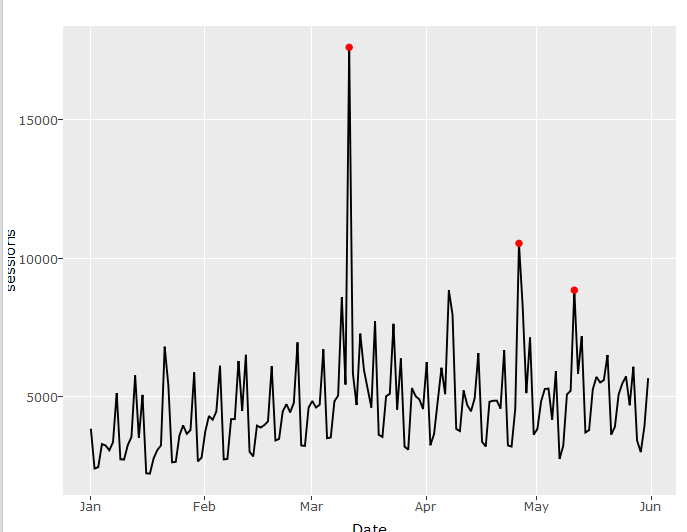
אני יוצר גרף (מצורפת תמונה) על בסיס טבלת נתונים (מצורף קובץ CSV).

בטבלה יש עמודה שנקראת anoms שיש מספר קטן של שורות עם ערכים.
מה שאני מנסה לעשות הוא ליצור שכבה נוספת על הגרף כאשר אני רוצה לשים נקודה על הגרף בכל מקום שיש ערך בעמודה anoms:

p <- plot_ly(df2, x = Date, y = sessions)
p %>% add_trace(y = fitted(loess(sessions ~ as.numeric(Date))), x = Date) %>%
layout(title = "Sessions Per Day", showlegend = FALSE)
תודה
אריאל

Jonathan Rosenblatt
Jun 14, 2016, 3:55:59 AM6/14/16
to israel-r-user-group
אני אישית מעדיף ליצור את התרשים ב- ggplot ואז להפעיל עליו ggplotly.
(בעיקר מפאת חוסר נסיון עם plot_ly).
--
You received this message because you are subscribed to the Google Groups "Israel R User Group" group.
To unsubscribe from this group and stop receiving emails from it, send an email to israel-r-user-g...@googlegroups.com.
For more options, visit https://groups.google.com/d/optout.
--
Jonathan Rosenblatt
Dept. of Industrial Engineering and Management
Ben Gurion University of the Negev
Ariel Pinco
Jun 14, 2016, 4:03:20 AM6/14/16
to israel-r-...@googlegroups.com
תודה יונתן.
איך עכשיו על הגרף אני מוסיף smooth line?
p <- ggplot(df2, aes(x=Date, y=sessions)) + geom_line() + geom_point(aes(y=anoms), color="red")
ggplotly(p)
Thanks
Ariel Pinco

Tal Galili
Jun 14, 2016, 4:05:34 AM6/14/16
to israel-r-...@googlegroups.com
p <- ggplot(df2, aes(x=Date, y=sessions)) + geom_line() + geom_point(aes(y=anoms), color="red") + geom_smooth()
ggplotly(p)
----------------Contact Details:-------------------------------------------------------
Contact me: Tal.G...@gmail.com |
Read me: www.talgalili.com (Hebrew) | www.biostatistics.co.il (Hebrew) | www.r-statistics.com (English)
----------------------------------------------------------------------------------------------
Ariel Pinco
Jun 14, 2016, 4:58:51 AM6/14/16
to israel-r-...@googlegroups.com
תודה את זה אני מכיר, זה מוסיף קו עם רצועה שאותה אני לא צריך.
רק קו.
תודה
אריאל
Tal Galili
Jun 14, 2016, 5:00:08 AM6/14/16
to israel-r-...@googlegroups.com
קו שעוקב אחרי הנתונים או קו בשיפוע וחותך קבועים מראש?
Sent from a smart-phone
תודה את זה אני מכיר, זה מוסיף קו עם רצועה שאותה אני לא צריך.רק קו.תודהאריאל
On Tue, Jun 14, 2016 at 11:05 AM, Tal Galili <tal.g...@gmail.com> wrote:
p <- ggplot(df2, aes(x=Date, y=sessions)) + geom_line() + geom_point(aes(y=anoms), color="red") + geom_smooth()ggplotly(p)
----------------Contact Details:-------------------------------------------------------
Contact me: Tal.G...@gmail.com |
Read me: www.talgalili.com (Hebrew) | www.biostatistics.co.il (Hebrew) | www.r-statistics.com (English)
----------------------------------------------------------------------------------------------
2016-06-14 11:02 GMT+03:00 Ariel Pinco <ariel...@gmail.com>:
תודה יונתן.איך עכשיו על הגרף אני מוסיף smooth line?
p <- ggplot(df2, aes(x=Date, y=sessions)) + geom_line() + geom_point(aes(y=anoms), color="red")ggplotly(p)
<image.png>
Ariel Pinco
Jun 14, 2016, 5:13:16 AM6/14/16
to israel-r-...@googlegroups.com
קו שעוקב אחרי הנתונים
Tal Galili
Jun 14, 2016, 5:14:46 AM6/14/16
to israel-r-...@googlegroups.com
כזה?
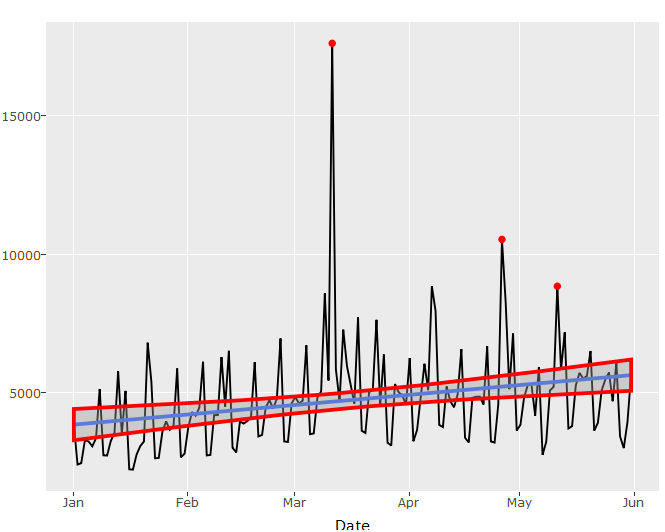
p <- ggplot(df2, aes(x=Date, y=sessions)) + geom_line() + geom_point(aes(y=anoms), color="red") + geom_smooth(method = "lm")
ggplotly(p)
----------------Contact Details:-------------------------------------------------------
Contact me: Tal.G...@gmail.com |
Read me: www.talgalili.com (Hebrew) | www.biostatistics.co.il (Hebrew) | www.r-statistics.com (English)
----------------------------------------------------------------------------------------------
Ariel Pinco
Jun 14, 2016, 5:40:23 AM6/14/16
to israel-r-...@googlegroups.com
אני רוצה רק את הקו הכחול, בלי הרצועה באדום:

amit gal
Jun 14, 2016, 7:50:02 AM6/14/16
to israel-r-...@googlegroups.com
תוסיף
se=F
כפרמטר לגאומטריית ההחלקה.
Ariel Pinco
Jun 14, 2016, 9:26:41 AM6/14/16
to israel-r-...@googlegroups.com
עובד, תודה רבה.
Reply all
Reply to author
Forward
0 new messages