CPU Load was Went up sharply!
已查看 234 次
跳至第一个未读帖子

Mehdi Halvaei
2015年10月18日 08:16:472015/10/18
收件人 islandora
hello every one
I have been ingest 300000 metadata in library,unfortunately CPU Load was Went up sharply.
While it is estimated at around 12 Query per second.
Within 10 minutes every 4 CPU usage will be 100%.
I was search about this problem and set some configure but it didnt solved.
As Diego mentioned in this link:
and The settings in the following article I was told to do:
its worry me that i have 1000000 record 10,000 simultaneous users want to use this program!
Sincerely

Jared Whiklo
2015年10月18日 13:49:532015/10/18
收件人 isla...@googlegroups.com
Hi,
Can you provide some more information about your system and what type of objects you are ingesting.
Cheers,
Jared
--
For more information about using this group, please read our Listserv Guidelines: http://islandora.ca/content/welcome-islandora-listserv
---
You received this message because you are subscribed to the Google Groups "islandora" group.
To unsubscribe from this group and stop receiving emails from it, send an email to islandora+...@googlegroups.com.
Visit this group at http://groups.google.com/group/islandora.
To view this discussion on the web visit https://groups.google.com/d/msgid/islandora/83a00862-1558-4fa7-b1da-fe19da07bdc0%40googlegroups.com.
For more options, visit https://groups.google.com/d/optout.
Mehdi Halvaei
2015年10月19日 01:58:072015/10/19
收件人 islandora
Hi Jared
I have been installed this program for university library,so I had 10000 users and 1000000 metadata(printed book) and 100000 books(pdf objects) ,It may be more of this record.
I want to set up a module for lending printed book.
All of the Object have Data Stream in DC, Mods & Marc (and the Object of a file PDF: pdf, TN and Preview) .
configuration of system:
solr 1.4.1
fedora 3.5
Drupal 7.39 with last update of module.
and the server was VM with CPU 4 core and 22 GB.
thans for any suggestion and ideas.
Sincerely
mehdi.

Brad Spry
2015年10月19日 17:46:242015/10/19
收件人 islandora
Mehdi,
High resources utilization can be caused by allowing software to do whatever is wishes without constraint.
One adjustment can be found in Tomcat's server.xml config, the maximum number of threads, using the 'maxThreads' variable.
High CPU utilization can also be caused by Java garbage collection (GC). To find out, turn on logging by utilizing the following JAVA_OPTS:
-Xloggc:/var/log/islandora/java/java_gc.log -XX:+PrintGCDetails -XX:+PrintGCTimeStamps -XX:ErrorFile=/var/log/islandora/java/java_error%p.log
...be sure to change the logging path to a valid path.
Tuning the JVM is a huge topic....
Here's my JAVA_OPTS today, based upon a system with 60GB of RAM:
-Xmn20g -Xms35g -Xmx35g -XX:PermSize=500m -XX:MaxPermSize=500m -XX:+DisableExplicitGC -XX:+UseParallelGC -XX:+UseParallelOldGC
Java has different garbage collectors, I've chosen the Parallel collector because it provides one thread of garbage collection per CPU. I have 8 CPUs, so the Parallel collector provides 8 threads of garbage collection. The Concurrent collector only provides one thread of garbage collection, period, no matter how many CPUs you have... One thread just wasn't getting the job done fast enough...
Watching the 'java_gc.log' is key. The log will reveal if "Full GC" (full garbage collection) is happening, it looks like this:
[Full GC [PSYoungGen: 3187977K->0K(17779648K)] [ParOldGen: 12777033K->3243789K(15728640K)] 15965010K->3243789K(33508288K) [PSPermGen: 115544K->115544K(512000K)], 0.6439120 secs] [Times: user=2.72 sys=0.00, real=0.65 secs]
If Full GC is happening non-stop, then CPU usage will be high...
Here are more tools for your Java tuning toolbox:
Run the 'jps' command to reveal your JVM's PID. Command output looks like this:
841 Jps
22688 Bootstrap
...the number beside "Bootstrap" is the number you want.
Armed with the JVM PID, you can now execute:
jmap -heap PID
...command output looks like this:
Attaching to process ID 22688, please wait...
Debugger attached successfully.
Server compiler detected.
JVM version is 20.45-b01
using thread-local object allocation.
Parallel GC with 8 thread(s)
Heap Configuration:
MinHeapFreeRatio = 40
MaxHeapFreeRatio = 70
MaxHeapSize = 37580963840 (35840.0MB)
NewSize = 21474836480 (20480.0MB)
MaxNewSize = 21474836480 (20480.0MB)
OldSize = 5439488 (5.1875MB)
NewRatio = 2
SurvivorRatio = 8
PermSize = 524288000 (500.0MB)
MaxPermSize = 524288000 (500.0MB)
Heap Usage:
PS Young Generation
Eden Space:
capacity = 14939586560 (14247.5MB)
used = 14137232832 (13482.315856933594MB)
free = 802353728 (765.1841430664062MB)
94.62934449505944% used
From Space:
capacity = 3267559424 (3116.1875MB)
used = 0 (0.0MB)
free = 3267559424 (3116.1875MB)
0.0% used
To Space:
capacity = 3267493888 (3116.125MB)
used = 3264881752 (3113.63387298584MB)
free = 2612136 (2.4911270141601562MB)
99.92005689713474% used
PS Old Generation
capacity = 16106127360 (15360.0MB)
used = 4399894792 (4196.0666580200195MB)
free = 11706232568 (11163.93334197998MB)
27.318142304817837% used
PS Perm Generation
capacity = 524288000 (500.0MB)
used = 118317336 (112.8362045288086MB)
free = 405970664 (387.1637954711914MB)
22.567240905761718% used
...this command will provide you X-ray vision inside of JVM's memory usage. Observe how Java's memory areas perform during various systems operations.
The primary goal is to ensure memory areas are not maxed out and full. If memory areas fill up, Full GC will happen.
Here's my memory settings again:
-Xmn20g -Xms35g -Xmx35g -XX:PermSize=500m -XX:MaxPermSize=500m
Big picture-wise, I start tuning by providing approximately half of the system's memory to Java, leaving the other half for the rest of the system. That's an important thing with Islandora, because plenty of non-Java operations happen; the Java side hands operations to the non-Java side, and vise versa, back and forth.
-Xms35g -Xmx35g
...the "total heap" size
-Xmn20g
...the "young generation" or "new" generation size. Recently, I've started giving more memory to the young generation after observing filling up.
-XX:PermSize=500m -XX:MaxPermSize=500m
...the "permanent generation" size.
The JVM will do its best to allocate memory to the various generations if you only set the -Xms and -Xmx variables, but I've learned that JVM isn't the best at guessing what Islandora needs...
So I specify the maximum heap size, the young generation size, and the permanent generation size, leaving the rest for the "old generation".
You can absolutely gain control of your system through understanding your system's limits, tuning, and observation.
Sincerely,
Brad Spry
UNC Charlotte
Mehdi Halvaei
2015年10月20日 06:10:072015/10/20
收件人 islandora
hi Brad,
thnaks for your sugesstion about the configuration,I checked the config that you said.
server configuration:
JAVA_OPTS="-Xmn6g -Xms11g -Xmx11g -XX:PermSize=500m -XX:MaxPermSize=500m -XX:+DisableExplicitGC -XX:+UseParallelGC -XX:+UseParallelOldGC -Djavax.net.ssl.trustStore=/server/truststore -Djavax.net.ssl.trustStorePassword=pass -Dsolr.solr.home=$FEDORA_HOME/gsearch_solr/solr -Dsolr.data.dir=$FEDORA_HOME/gsearch_solr/solr/data -Xloggc:/var/log/islandora/java/java_gc.log -XX:+PrintGCDetails -XX:+PrintGCTimeStamps -XX:ErrorFile=/var/log/islandora/java/java_error%p.log"
in java_gc.log log file:
2567.120: [GC [PSYoungGen: 6253184K->416K(6275392K)] 6471447K->218687K(11518272K), 0.0055260 secs] [Times: user=0.01 sys=0.00, real=0.01 secs]
I have attached the tuning of jmap -heap and the other parameter.
I have changed the connector tuning in server.xml:
<Connector port="8080" protocol="org.apache.coyote.http11.Http11NioProtocol" maxConnections="1000" connectionTimeout="20000" redirectPort="8443" enableLookups="true" acceptCount="100" maxThreads="20" URIEncoding="UTF-8" compression="on" compressableMimeType="text/html,text/xml,text/plain" />
At first Apache setting was set on BIO:
Protocol="HTTP/1.1"
after searching about this i was chang it to NIO:
Thread count more than the number that was still recording and still remain problem.
I think for every user that created the program to be a Thread.
Is there special configuration to convert Fedora release to production?
Sincerely,
mehdi
Brad Spry
2015年10月20日 11:37:462015/10/20
收件人 islandora
Mehdi,
Your memory usage looks really good. Your java_gc.log indicates young generation garbage collection happening, not Full GC, so that looks good too.
Here's another crucial JVM inspection program:
Get the JVM PID again using the 'jps' command, then run:
jstack PID
and
jstack PID |grep 8080
This will reveal the true number of running threads.
To your question of BIO/NIO, I actually went with APR:
https://tomcat.apache.org/tomcat-6.0-doc/apr.html
Placed the APR library here:
-Djava.library.path=/usr/local/apr/lib
I also have my Tomcat configured with an "executor" to give Tomcat more power to prune idle threads:
<Service name="Catalina">
<Executor name="tomcatThreadPool" namePrefix="pool-8443-" maxThreads="100" minSpareThreads="10" maxIdleTime="180000" maxQueueSize="100"/>
<Connector protocol="org.apache.coyote.http11.Http11AprProtocol" executor="tomcatThreadPool" acceptCount="100" maxSpareThreads="20" compression="on" compressableMimeType="text/html,text/xml"
scheme="https" secure="true" SSLEnabled="true" port="8443" enableLookups="false" SSLVerifyClient="none" SSLCertificateFile="file.cer"
SSLCertificateKeyFile="file.key" SSLCACertificateFile="file.ca-bundle" URIEncoding="UTF-8"/>
You can completely ignore the SSL stuff, that's just how I chose to run things. For your setup, you would change the port setting to 8080 and completely eliminate the SSL stuff.
Start with a lower number of maxThreads and work your way up.
Also, start looking outside of Islandora for other system processes that could be gobbling up CPU. Take a look in your /var/log directory for any log files ballooning out of control. I recently dealt with a system that did not have sendmail properly configured and was bouncing mail at an unbelievable fast rate... My /var/log/syslog and /var/log/mail.log was writing at an astonishing rate, gobbling up huge amounts of disk space and CPU in the process...
Brad

Phil Redmon
2015年10月20日 11:39:512015/10/20
收件人 islandora
This is fascinating and pertinent to what we're working on as well. Thanks for all your work here Brad.
--
For more information about using this group, please read our Listserv Guidelines: http://islandora.ca/content/welcome-islandora-listserv
---
You received this message because you are subscribed to the Google Groups "islandora" group.
To unsubscribe from this group and stop receiving emails from it, send an email to islandora+...@googlegroups.com.
Visit this group at http://groups.google.com/group/islandora.
To view this discussion on the web visit https://groups.google.com/d/msgid/islandora/72a49be3-c101-40d2-8025-c0c50b725c63%40googlegroups.com.

Diego Pino
2015年10月22日 10:19:162015/10/22
收件人 islandora
Brad++. Amazing job.
Mehdi Halvaei
2015年10月24日 03:35:262015/10/24
收件人 islandora
Brad
spechialy Thanks for your suggestion and instructions.
i have done all the things, you'v suggested me.
my output commands are these:
jstack output is attached.
jstack PID |grep 8080 result:
"pool-8080-50" daemon prio=10 tid=0x00007f2ac03a5800 nid=0x66d3 waiting on condition [0x00007f2a535dc000]
"pool-8080-46" daemon prio=10 tid=0x00007f2abc001800 nid=0x6393 runnable [0x00007f2a6c6fb000]
"pool-8080-45" daemon prio=10 tid=0x00007f2ac8015000 nid=0x6390 waiting on condition [0x00007f2a6abfa000]
"pool-8080-43" daemon prio=10 tid=0x00007f2ac011b800 nid=0x6360 waiting on condition [0x00007f2a6aefd000]
"pool-8080-40" daemon prio=10 tid=0x00007f2ac800b000 nid=0x6358 waiting for monitor entry [0x00007f2a83ffc000]
"pool-8080-36" daemon prio=10 tid=0x00007f2ac015d000 nid=0x6266 waiting for monitor entry [0x00007f2a795fb000]
"pool-8080-35" daemon prio=10 tid=0x00007f2ac054b800 nid=0x6264 waiting on condition [0x00007f2a793fa000]
"pool-8080-33" daemon prio=10 tid=0x00007f2ac0134000 nid=0x6261 waiting on condition [0x00007f2b1d980000]
"pool-8080-26" daemon prio=10 tid=0x00007f2ac03b5800 nid=0x60e4 waiting on condition [0x00007f2a59ef5000]
"pool-8080-20" daemon prio=10 tid=0x00007f2ab402c800 nid=0x5dcd waiting for monitor entry [0x00007f2a5a0f5000]
"http-8080-Acceptor-0" daemon prio=10 tid=0x00007f2b28f1f800 nid=0xdfd runnable [0x00007f2a5a2f9000]
"http-8080-ClientPoller-3" daemon prio=10 tid=0x00007f2b28f38000 nid=0xdfc runnable [0x00007f2a5a3fa000]
"http-8080-ClientPoller-2" daemon prio=10 tid=0x00007f2b2865b800 nid=0xdfb runnable [0x00007f2a5a4fb000]
"http-8080-ClientPoller-1" daemon prio=10 tid=0x00007f2b28f39000 nid=0xdfa runnable [0x00007f2a5a5fc000]
"http-8080-ClientPoller-0" daemon prio=10 tid=0x00007f2b284df800 nid=0xdf9 runnable [0x00007f2a5a6fd000]
i've read all the Logs on the server, several times. there were these:
System Logs:
apache2/
access.log => 5689 B
eror.log => 346 B
other_vhosts_access.log => 1433 B
/mysql => nothing (it's active.)
/apt
term.log => 103 KiB
history.log => 15274 B
the size of other logs on the server were less than 300 KiB
Drupla Log file: there are no errors on the events and reports.
the logs in the Catalina_Home are these:
Fedora.log => 20480 KiB
catalina.Out => 176 MiB (i cheked catalina.Out but there were no errors on it, but info.)
fedora.log => 20482KiB
fedoragsearch.daily.log => 100MiB
i checked this file's content.i saw some logs, which i mention bellow:
i checked all the log4j.xml settings several times and every thing was corect. but i don't know why it log's like this!
DEBUG 2015-10-20 08:22:44,365 (UpdateListener) Received Fedora Message: ActiveMQTextMessage {commandId = 701, responseRequired = true, messageId = ID:library.sbu.ac.ir-49814-1445251156458-2:1:1:1:43,
originalDestination = null, originalTransactionId = null, producerId = ID:library.sbu.ac.ir-49814-1445251156458-2:1:1:1, destination = topic://fedora.apim.update, transactionId = null, expiration = 0, timestamp =
1445316764277, arrival = 0, brokerInTime = 1445316764321, brokerOutTime = 1445316764337, correlationId = null, replyTo = null, persistent = true, type = null, priority = 4, groupID = null, groupSequence = 0,
targetConsumerId = null, compressed = false, userID = null, content = null, marshalledProperties = org.apache.activemq.util.ByteSequence@5d03b018, dataStructure = null, redeliveryCounter = 0, size = 0, properties =
{methodName=ingest, pid=book:95027}, readOnlyProperties = true, readOnlyBody = true, droppable = false, text = <?xml version="1.0" encoding="UTF-8"?>
<entry...ry>
</entry>}
DEBUG 2015-10-20 08:22:44,366 (UpdateListener) Message Text: <?xml version="1.0" encoding="UTF-8"?>
<entry xmlns="http://www.w3.org/2005/Atom" xmlns:xsd="http://www.w3.org/2001/XMLSchema" xmlns:fedora-types="http://www.fedora.info/definitions/1/0/types/">
<id>urn:uuid:83538194-525a-4749-a974-cf9dc7c3185a</id>
<updated>2015-10-20T04:52:44.136Z</updated>
<author>
<name>behnaz rahmani</name>
<uri>http://localhost:8080/dl</uri>
</author>
<title type="text">ingest</title>
<category term="" scheme="fedora-types:logMessage" label="xsd:string"></category>
<category term="info:fedora/fedora-system:FOXML-1.1" scheme="fedora-types:format" label="xsd:string"></category>
<summary type="text">book:95027</summary>
<content type="text">book:95027</content>
<category term="3.5" scheme="info:fedora/fedora-system:def/view#version"></category>
<category term="info:fedora/fedora-system:ATOM-APIM-1.0" scheme="http://www.fedora.info/definitions/1/0/types/formatURI"></category>
</entry>
DEBUG 2015-10-20 08:22:44,399 (Config) getProperty fedoragsearch.testUserName=null
DEBUG 2015-10-20 08:22:44,399 (GenericOperationsImpl) updateIndex action=fromPid value=book:95027 repositoryName=dl indexNames= indexDocXslt= resultPageXslt=
DEBUG 2015-10-20 08:22:44,399 (Config) indexName=gsearch_solr operationsImpl=dk.defxws.fgssolr.OperationsImpl
DEBUG 2015-10-20 08:22:44,400 (Config) operationsImplClass=class dk.defxws.fgssolr.OperationsImpl
DEBUG 2015-10-20 08:22:44,400 (Config) ops=dk.defxws.fgssolr.OperationsImpl@7b42aff0
DEBUG 2015-10-20 08:22:44,400 (Config) getProperty fedoragsearch.testUserName=null
DEBUG 2015-10-20 08:22:44,400 (Config) insertSystemProperties propertyValue=FEDORA_HOME/gsearch_solr/solr/data/index
DEBUG 2015-10-20 08:22:44,427 (OperationsImpl) getIndexReaderAndSearcher indexName=gsearch_solr docCount=99671
INFO 2015-10-20 08:22:44,427 (GenericOperationsImpl) getFoxmlFromPid pid=book:95027 repositoryName=dl
DEBUG 2015-10-20 08:22:44,427 (GenericOperationsImpl) getFedoraClient repositoryName=dl fedoraSoap=http://localhost:8080/dl/services fedoraUser=fedoraAdmin fedoraPass=pass
DEBUG 2015-10-20 08:22:44,463 (GTransformer) xsltName=fgsconfigFinal/index/gsearch_solr/foxmlToSolr
DEBUG 2015-10-20 08:22:44,497 (GTransformer) getTransformer transformer=org.apache.xalan.transformer.TransformerImpl@7d27ed3a uriResolver=null
DEBUG 2015-10-20 08:22:44,518 (OperationsImpl) indexDoc=
<?xml version="1.0" encoding="UTF-8"?>
<add xmlns:oai_dc="http://www.openarchives.org/OAI/2.0/oai_dc/" xmlns:mods="http://www.loc.gov/mods/v3" xmlns:dc="http://purl.org/dc/elements/1.1/" xmlns:foxml="info:fedora/fedora-system:def/foxml#">
<doc>
<field name="PID">book:95027</field>
<field name="REPOSITORYNAME">dl</field>
<field name="REPOSBASEURL">http://localhost:8080/dl</field>
<field name="fgs.state">Active</field>
<field name="fgs.label">Stochastic and global optimization</field>
<field name="fgs.ownerId">behnaz</field>
<field name="fgs.createdDate">2015-10-20T04:52:44.136Z</field>
<field name="fgs.lastModifiedDate">2015-10-20T04:52:44.136Z</field>
<field name="dc.title">Stochastic and global optimization</field>
<field name="dc.subject">Mathematical optimization</field>
<field name="dc.subject">Stochastic processes</field>
<field name="dc.subject">QA402.5 .S723 2002</field>
<field name="dc.subject">519.3</field>
<field name="dc.description">edited by Gintautus Dzemyda, Vydūnas Šaltenis, Antanas Žilinskas.</field>
<field name="dc.description">Includes bibliographical references.</field>
<field name="dc.description">0</field>
<field name="dc.publisher">Kluwer Academic</field>
<field name="dc.contributor">Dzemyda, Gintautas.</field>
<field name="dc.contributor">Šaltenis, Vydūnas.</field>
<field name="dc.contributor">Zhilinskas, A.</field>
<field name="dc.date">c2002</field>
<field name="dc.date">2002</field>
<field name="dc.type">Text</field>
<field name="dc.type">Book</field>
<field name="dc.format">print</field>
<field name="dc.format">x, 233 p. : ill., 1 port. ; 25 cm.</field>
<field name="dc.identifier">book:95027</field>
<field name="dc.identifier">http://www.loc.gov/catdir/enhancements/fy0822/2002283172-d.html</field>
<field name="dc.identifier">http://www.loc.gov/catdir/enhancements/fy0822/2002283172-t.html</field>
<field name="dc.identifier">isbn:Â 1402004842 (acid-free paper)</field>
<field name="dc.identifier">lccn:Â 2002283172</field>
<field name="dc.identifier">oclc:Â ocm49739780</field>
<field name="dc.language">eng</field>
<field name="dc.relation">http://www.loc.gov/catdir/enhancements/fy0822/2002283172-d.html</field>
</doc>
</add>
DEBUG 2015-10-20 08:22:44,518 (Config) insertSystemProperties propertyValue=http://localhost:8080/solr
DEBUG 2015-10-20 08:22:44,548 (GenericOperationsImpl) indexDocExists termDocs=book:95027 indexDocExists=false
i installed varnish on my server, solving my problem, but it didn't work again.
when server CPU load is full:
run query on solr => QTime:32
run query on fedoragsearch => time :5 Sec.
But in drupal i response very slowly. it takes about 5Min to respond me, if it works.
i'm really confused. i would be grateful if you could help me.
thanks a lot.
mehdi
Diego Pino
2015年10月24日 11:23:162015/10/24
收件人 islandora
Hi Mehdy,
Since your CPU consuming processed could be anywhere in the Java VM and you must match the real UNIX Thread with the Java PID, let's do a test:
Run "jstack javaPID" without filtering (so let's start without the grep) so we can see where/what is running at each of those. (save that info somewhere)
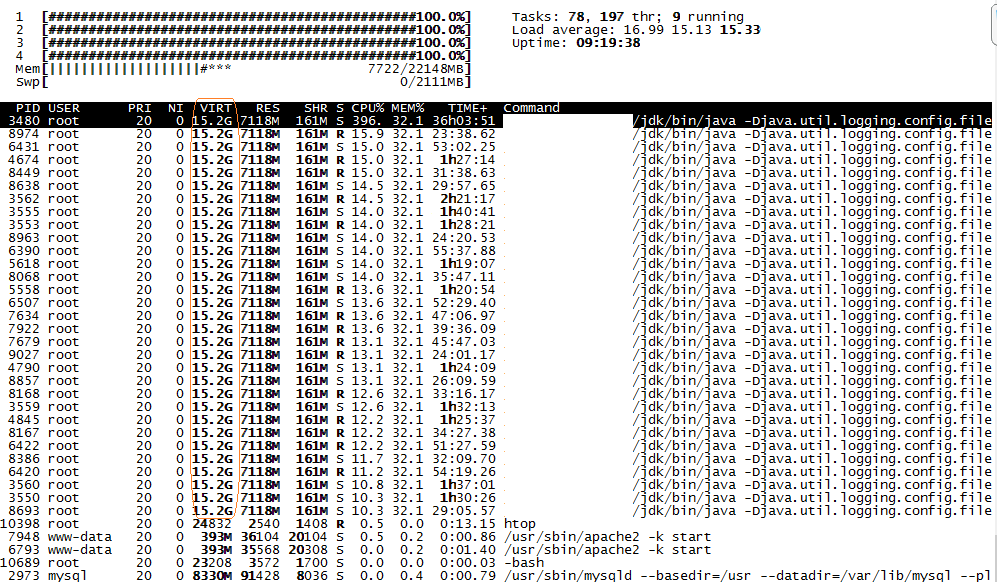
Then, with a "top" open toggle your threads (unix) using SHIFT-h. This will expand your parent process to show "internal" treads.
Here comes the important part. Take note of "the" Unix PID (or one of them) that is consuming 100% CPU.
Convert that PID from decimal to hexadecimal. That hexadecimal should match (using one of your trimmed examples) the "nid" from the jstack output (the reason you should not use the grep here because jstack outputs the detailed info below the grepped line). This way you can go to the exact spot where things are getting weird and CPU consuming
"pool-8080-40" daemon prio=10 tid=0x00007f2ac800b000 nid=0x6358 waiting for monitor entry [0x00007f2a83ffc000]"
Gives this a try (by the way, credit to google, not my own idea) and tell us if you had luck
Best
Diego
Brad Spry
2015年10月24日 17:21:192015/10/24
收件人 islandora
Mehdi,
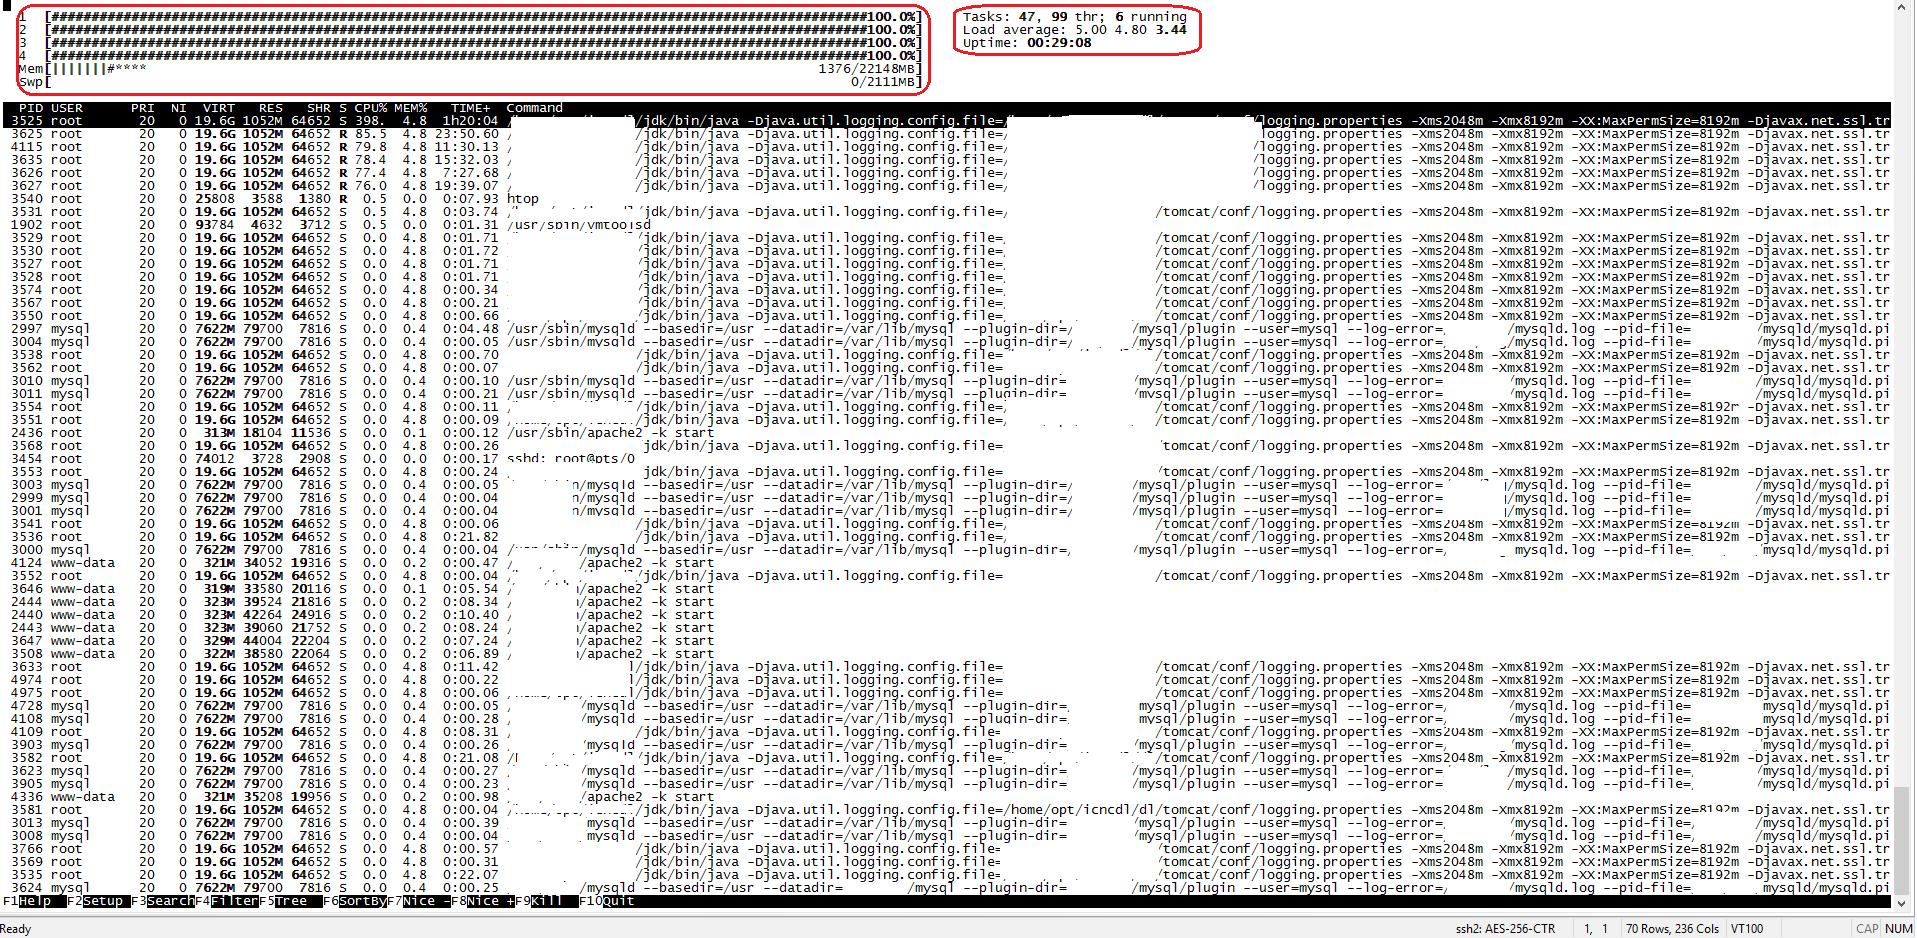
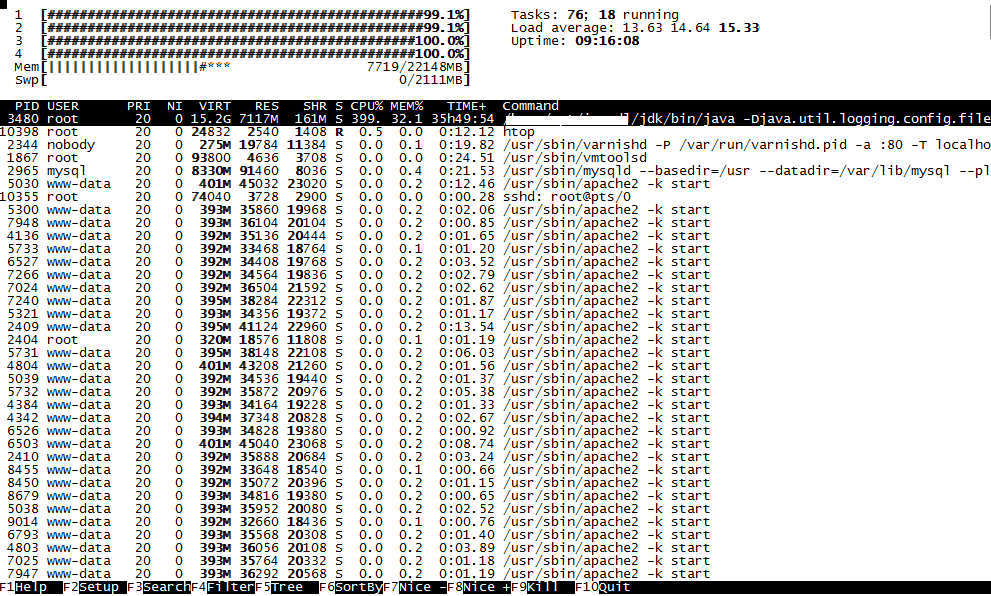
I took another look at your screenshots containing 'top' command out. Java is taking up 19.8G VERT, which is memory it believes it has access to...
If you are running the JAVA_OPTS you previously posted, the JVM should only be able to utilize about 12GB of RAM:
I took another look at your screenshots containing 'top' command out. Java is taking up 19.8G VERT, which is memory it believes it has access to...
If you are running the JAVA_OPTS you previously posted, the JVM should only be able to utilize about 12GB of RAM:
JAVA_OPTS="-Xmn6g -Xms11g -Xmx11g -XX:PermSize=500m -XX:MaxPermSize=500m -XX:+DisableExplicitGC -XX:+UseParallelGC -XX:+UseParallelOldGC
...so I'm thinking wherever you're setting the above JAVA_OPTS, isn't being read and used by Tomcat.
I place my JAVA_OPTS in tomcat/bin/startup.sh; you should see JAVA_OPTS being set near the bottom of the script. Adjust your settings there and restart tomcat.
<B
I place my JAVA_OPTS in tomcat/bin/startup.sh; you should see JAVA_OPTS being set near the bottom of the script. Adjust your settings there and restart tomcat.
<B
Diego Pino
2015年10月25日 12:30:452015/10/25
收件人 islandora
Hi Mehdi, to be able to understand what is consuming all your CPU i need (you need) to expand your UNIX processes to see the THREADS (SHIFT-H) in top or run directly top -H and fetch the Threads PID'S that are Java and consuming lots of CPU. Without this we are blind because i can't match the wrapper PID (process PID) to the specific java threads, i need to match the Thread PID , means PID->hexadecimal NID in jstack.
If it's unclear, follow this guide
Best
Mehdi Halvaei
2015年11月1日 03:14:062015/11/1
收件人 islandora
hi every one
brad and digeo thanks for your suggestion
finally I found the problem,It is about RIsearch(Resource index) in fedora It takes 30 seconds for each query,I have checked some links such as:
sample Query for per Click on collection and child collection:
but they use fedora 3.4 or older.
I find out mabye its about mulgara module in fedora
I have checked this link too:
but we dont know to config or reindex it.
do you have any idea or suggestion?
sincerely,
mehdi
回复全部
回复作者
转发
0 个新帖子