Aprof : Android Profiler

Kito Cheng
I am glad to introduce our new tool, Aprof : an Android profiler, it's
a profiling tool for Android native code; aprof is not only another
gprof implement on Android but also support for profiling shared
library. The most important thing is that aport supports the profiling
for JNI code!
The capability of aprof is similar to what gprof does, it provides
call graph and time sampling profiling, but it's incompatible with
gprof since the gprof can't profile shared library, it's limited by
its representation.
== Usage for aprof ==
If you want to profile an executable or static library, you can turn
on aprof by inserting the following line to Android.mk:
LOCAL_ENABLE_APROF := true
There are two modes for profile shared library. The first one is
specify for Non-JNI used shared library, it's just used like
executable, but it only triggers aprof when the executable is being
profiled.
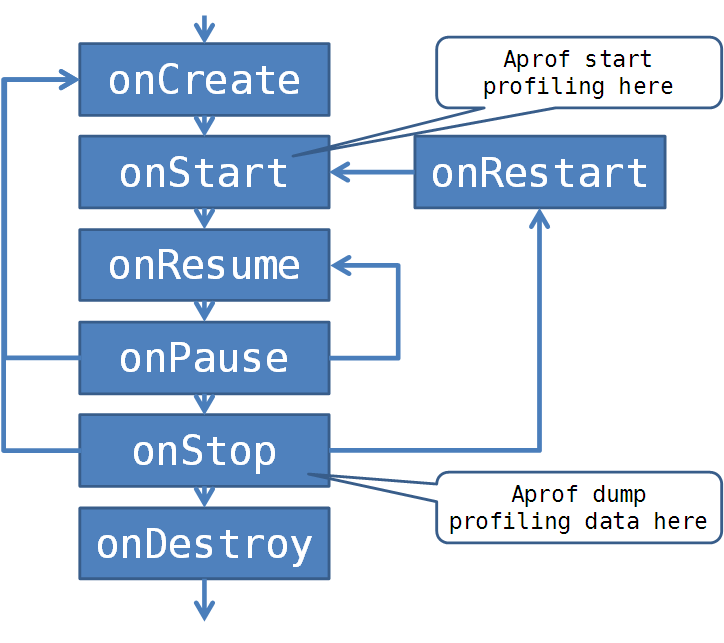
The second mode is designed for JNI, it's called JNI mode, it's
life-cycle-sensitive for Activity : active when onStart, stop and dump
profiling when onStop; but here is one exception in JNI mode, it will
trade as Non-JNI mode if the shared library are opened by the
executable which is already turn on the aprof, So you can turn-on JNI
mode aprof for shared library by adding the follow line to Android.mk:
LOCAL_ENABLE_APROF_JNI := true
In addition, regarding JNI-mode is you should make sure your
application have the permission to write external storage. Here is the
setting example in the AndroidManifest.xml.
AndroidManifest.xml:
<manifest xmlns:android="http://schemas.android.com/apk/res/android"
package="com.example.android.simplejni">
<application android:label="Simple JNI">
<activity android:name="SimpleJNI">
<intent-filter>
<action android:name="android.intent.action.MAIN" />
<category android:name="android.intent.category.LAUNCHER" />
</intent-filter>
</activity>
</application>
<uses-permission android:name="android.permission.WRITE_EXTERNAL_STORAGE" />
</manifest>
You can start profiling your program after recompiling executables
with aprof and execute on the Android device, After the profiling has
been accomplished, the result will be put in the /mnt/sdcard/
(according `EXTERNAL_STORAGE` environment variable), the default file
name is executable name with .aprof suffix : $(progname).aprof And the
next step is grabbing the data to the host, you can grab by adb
adb pull /mnt/sdcard/$(progname).aprof
# For example, you are profiling `foo`
adb pull /mnt/sdcard/foo.aprof
And then interpret the data by aprof, the usage is as follow:
# aprof $(prog_file) $(prof_file)
aprof foo foo.aprof
And here is the example output:
% cumulative self self total
time time time calls ms/call ms/call name
99.52 2170 2140 2178309 0 0 fib
0.00 2170 0 1 0 217 main
0.48 0 30 0 0 0 <libc.so>
Call graph (explanation follows)
-------------------------------------------------------------
Image : foo
Cumulative time : 2170 ms
Self time : 2140 ms
Function % time cumulative self Count Call by
fib 2170 2140
100.00 2170 0 1 main
100.00 2170 2140 2178308 fib
main 2170 0
100.00 2170 0 1 <libc.so>
Upper half part shows how many time spent in which function,
- cumulative time : the execution time with the child function
- self time : the execution time for this function alone.
- calls : the number of times this function was invoked.
- self ms/call : the average number of milliseconds spent in this
function per call.
- total ms/call :the average number of milliseconds spent in function
and its descendants per call
And the lower part shows the detail for each function.
We can see a unusual symbol <libc.so> in the above example output, the
reason is that aprof don't load the symbol information of the shared
libraries, we can specify the search path for shared libraries by -L
option. In general, we can set the searching path to the
out/target/product/*/symbols/system/lib.
# aprof $(prog_file) $(prof_file) -L$(lib_path)
aprof foo foo.aprof -L out/target/product/panda/symbols/system/lib
We will get more details of profiling data after loading symbol, but
it still imprecise info in the output since the shared libraries
building without aprof, so the part of `calls` and `cumulative time`
may be incorrect; however the `Self time` can show after we load the
symbol info.
% cumulative self self total
time time time calls ms/call ms/call name
99.52 2170 2140 2178309 0 0 fib
0.00 2170 0 1 0 217 main
0.32 0 20 0 0 0 write
0.16 0 10 0 0 0 memcpy
Call graph (explanation follows)
-------------------------------------------------------------
Image : foo
Cumulative time : 2170 ms
Self time : 2140 ms
Function % time cumulative self Count Call by
fib 2170 2140
100.00 2170 0 1 main
100.00 2170 2140 2178308 fib
main 2170 0
100.00 2170 0 1 __libc_init
-------------------------------------------------------------
Image : foo
Cumulative time : 2170 ms
Self time : 30 ms
write 0 20
memcpy 0 10
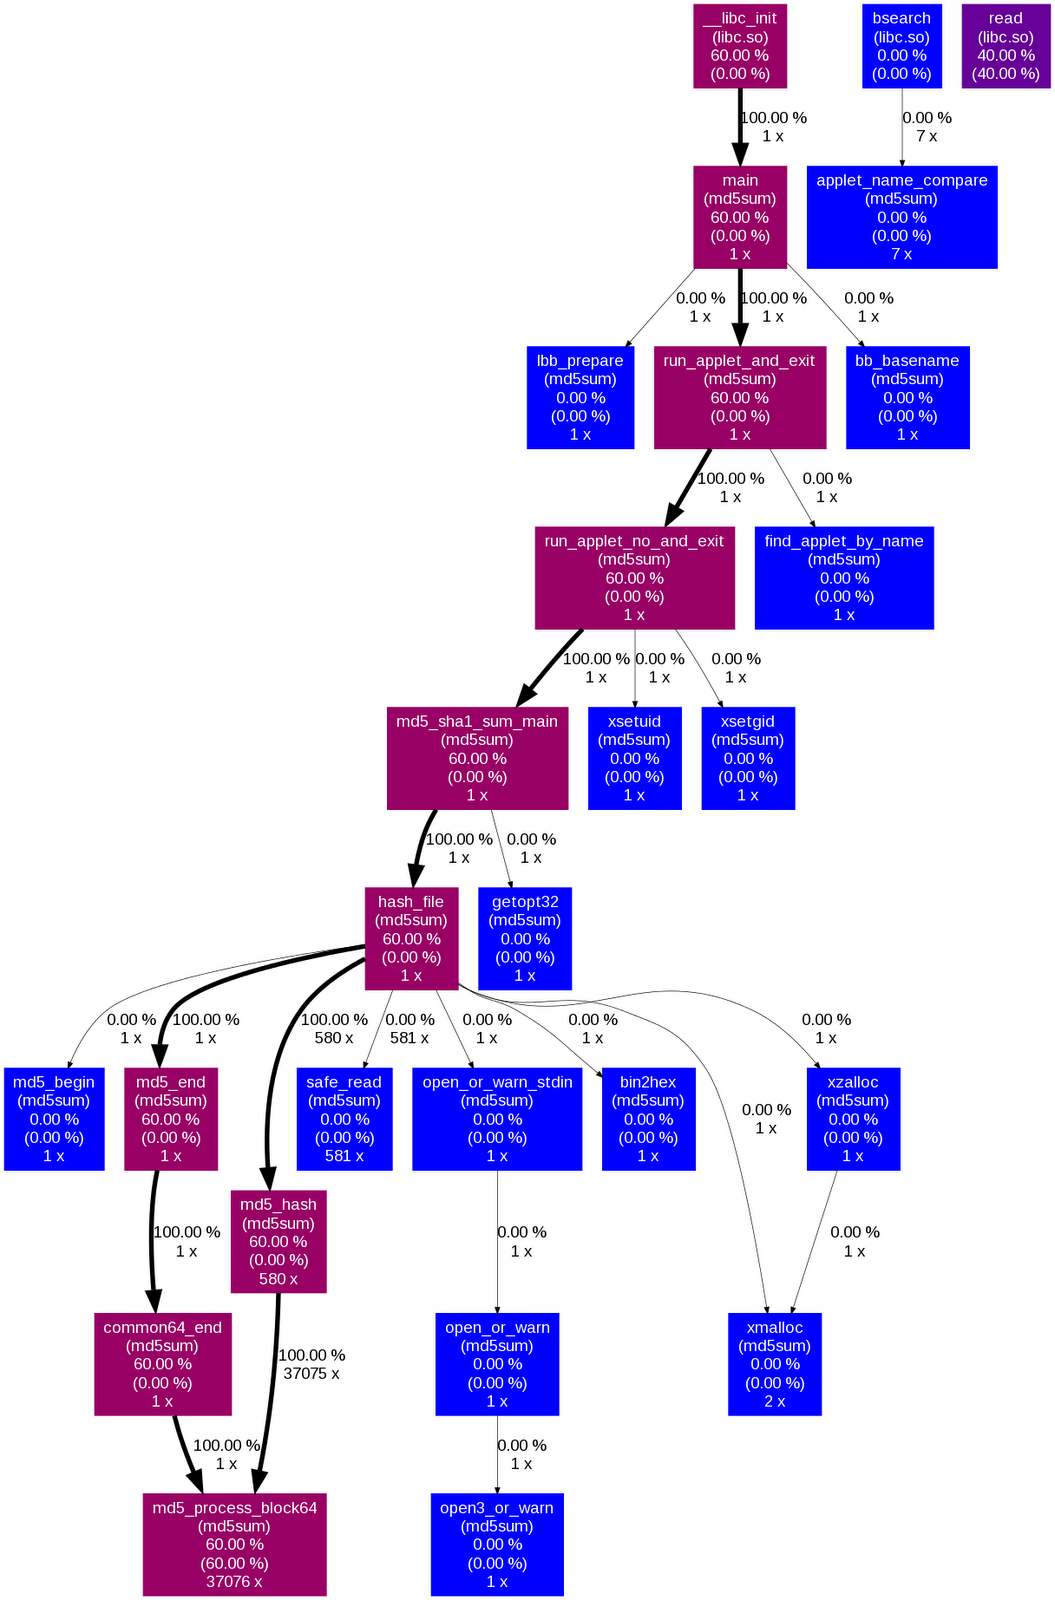
And the last part is about visualization part of aprof, aprof supports
the `dot` format by `-d` option, so we can use the `dot`(usually in
graphviz package) program to output the call graph with timing info by
the pipeline, you can reference the following command :
# aprof $(prog_file) $(prof_file) -L$(lib_path)
aprof foo foo.aprof -L out/target/product/panda/symbols/system/lib -d
| dot -Tpng -o foo.aprof.png
And here is an example output generated by md5sum of busybox attached.
The aprof is already implemented and verified for known test cases,
and here is the code review links:
https://android-review.googlesource.com/32561
https://android-review.googlesource.com/32570
https://android-review.googlesource.com/32571
Kito Cheng
https://android-review.googlesource.com/32561
https://android-review.googlesource.com/32570
https://android-review.googlesource.com/32571
https://android-review.googlesource.com/32573
https://android-review.googlesource.com/32574

sunya...@gmail.com
Dynamic linker support for aprof
https://android-review.googlesource.com/#/c/36545/
Aprof : Android Profiler
https://android-review.googlesource.com/#/c/36544/
Aprof Interpreter : Android Profiler Interpreter
https://android-review.googlesource.com/#/c/32574/
Aprof example
https://android-review.googlesource.com/#/c/36458/
Kito Cheng
We have already rebase the patch about 2 month ago, and test on Android/ICS,
feel free to feedback any problem about aprof:)
> You received this message because you are subscribed to the Google Groups
> "0xlab-devel" group.
> To view this discussion on the web visit
> https://groups.google.com/d/msg/0xlab-devel/-/4PXuYN1F0hAJ.
> To post to this group, send email to 0xlab...@googlegroups.com.
> To unsubscribe from this group, send email to
> 0xlab-devel...@googlegroups.com.
> For more options, visit this group at
> http://groups.google.com/group/0xlab-devel?hl=en.
Terrence Sun
Hi Kito,
Thanks a lot for your response.
I have sync source tree to the latest master, then download related changes, but I cannot rebuild the whole android system with Aprof. Aprof is okay but building process is stuck in other component.
So, I tried to manually merge aprof, but found that this is also out of my ability as linker has changed a lot. For safety, I think I should sync the source tree to one of those tags for ICS.
What’s your suggestion? Is android-4.0.4_r2.1 an applicable tag for Aprof?
Thanks again.
Terrence
Kito Cheng
>
> I have sync source tree to the latest master, then download related changes,
> but I cannot rebuild the whole android system with Aprof. Aprof is okay but
> building process is stuck in other component.
>
> So, I tried to manually merge aprof, but found that this is also out of my
> ability as linker has changed a lot. For safety, I think I should sync the
> source tree to one of those tags for ICS.
>
> What’s your suggestion? Is android-4.0.4_r2.1 an applicable tag for Aprof?
btw, we have plan to rework the aprof with the dladdr, so that aprof
can work without modify dynamic linker.
Terrence Sun
Terrence Sun
Hi Kito,
Now I can successfully build the whole system.
The profile_test works okay, but there is another problem.
I tried to use aprof to profiling dalvikvm, and here is what I have done.
1) Enable aprof in dalkvm/Android.mk
2) Enable aprof in vm/Android.mk
3) Enable JNI mode in vm/Android.mk
If both 1) and 2) are applied, when running a jar, the dalvikvm hangs; but “dalvikvm -help” works and output the .aprof file.
If both 1) and 3) are applied, zygote process will hang.
If only 1) are applied, dalvikvm works normally in all case. Of cause, there is no called information as aprof is not enabled in 2).
Maybe using aprof on dalvikvm is not a good idea. What am I missing? Any suggestion is welcomedJ
