Opencast getting frozen
67 views
Skip to first unread message

s.la...@googlemail.com
Oct 27, 2022, 11:38:30 AM10/27/22
to Opencast Users
Hi everyone,
since we upgraded to Opencast 11 we are experiencing some trouble.
Our admin node regularly is getting unresponsive and needs to restarted (the opencast service, not the whole machine). To work around it, I made a small script which locally checks the health endpoint and if getting a time out 4 times it restarts opencast.
There seem to be no error messages regarding opencast getting stuck around the time opencast becomes unresponsive.
After digging deeper a bit, I monitored the metrics endpoint for the admin. 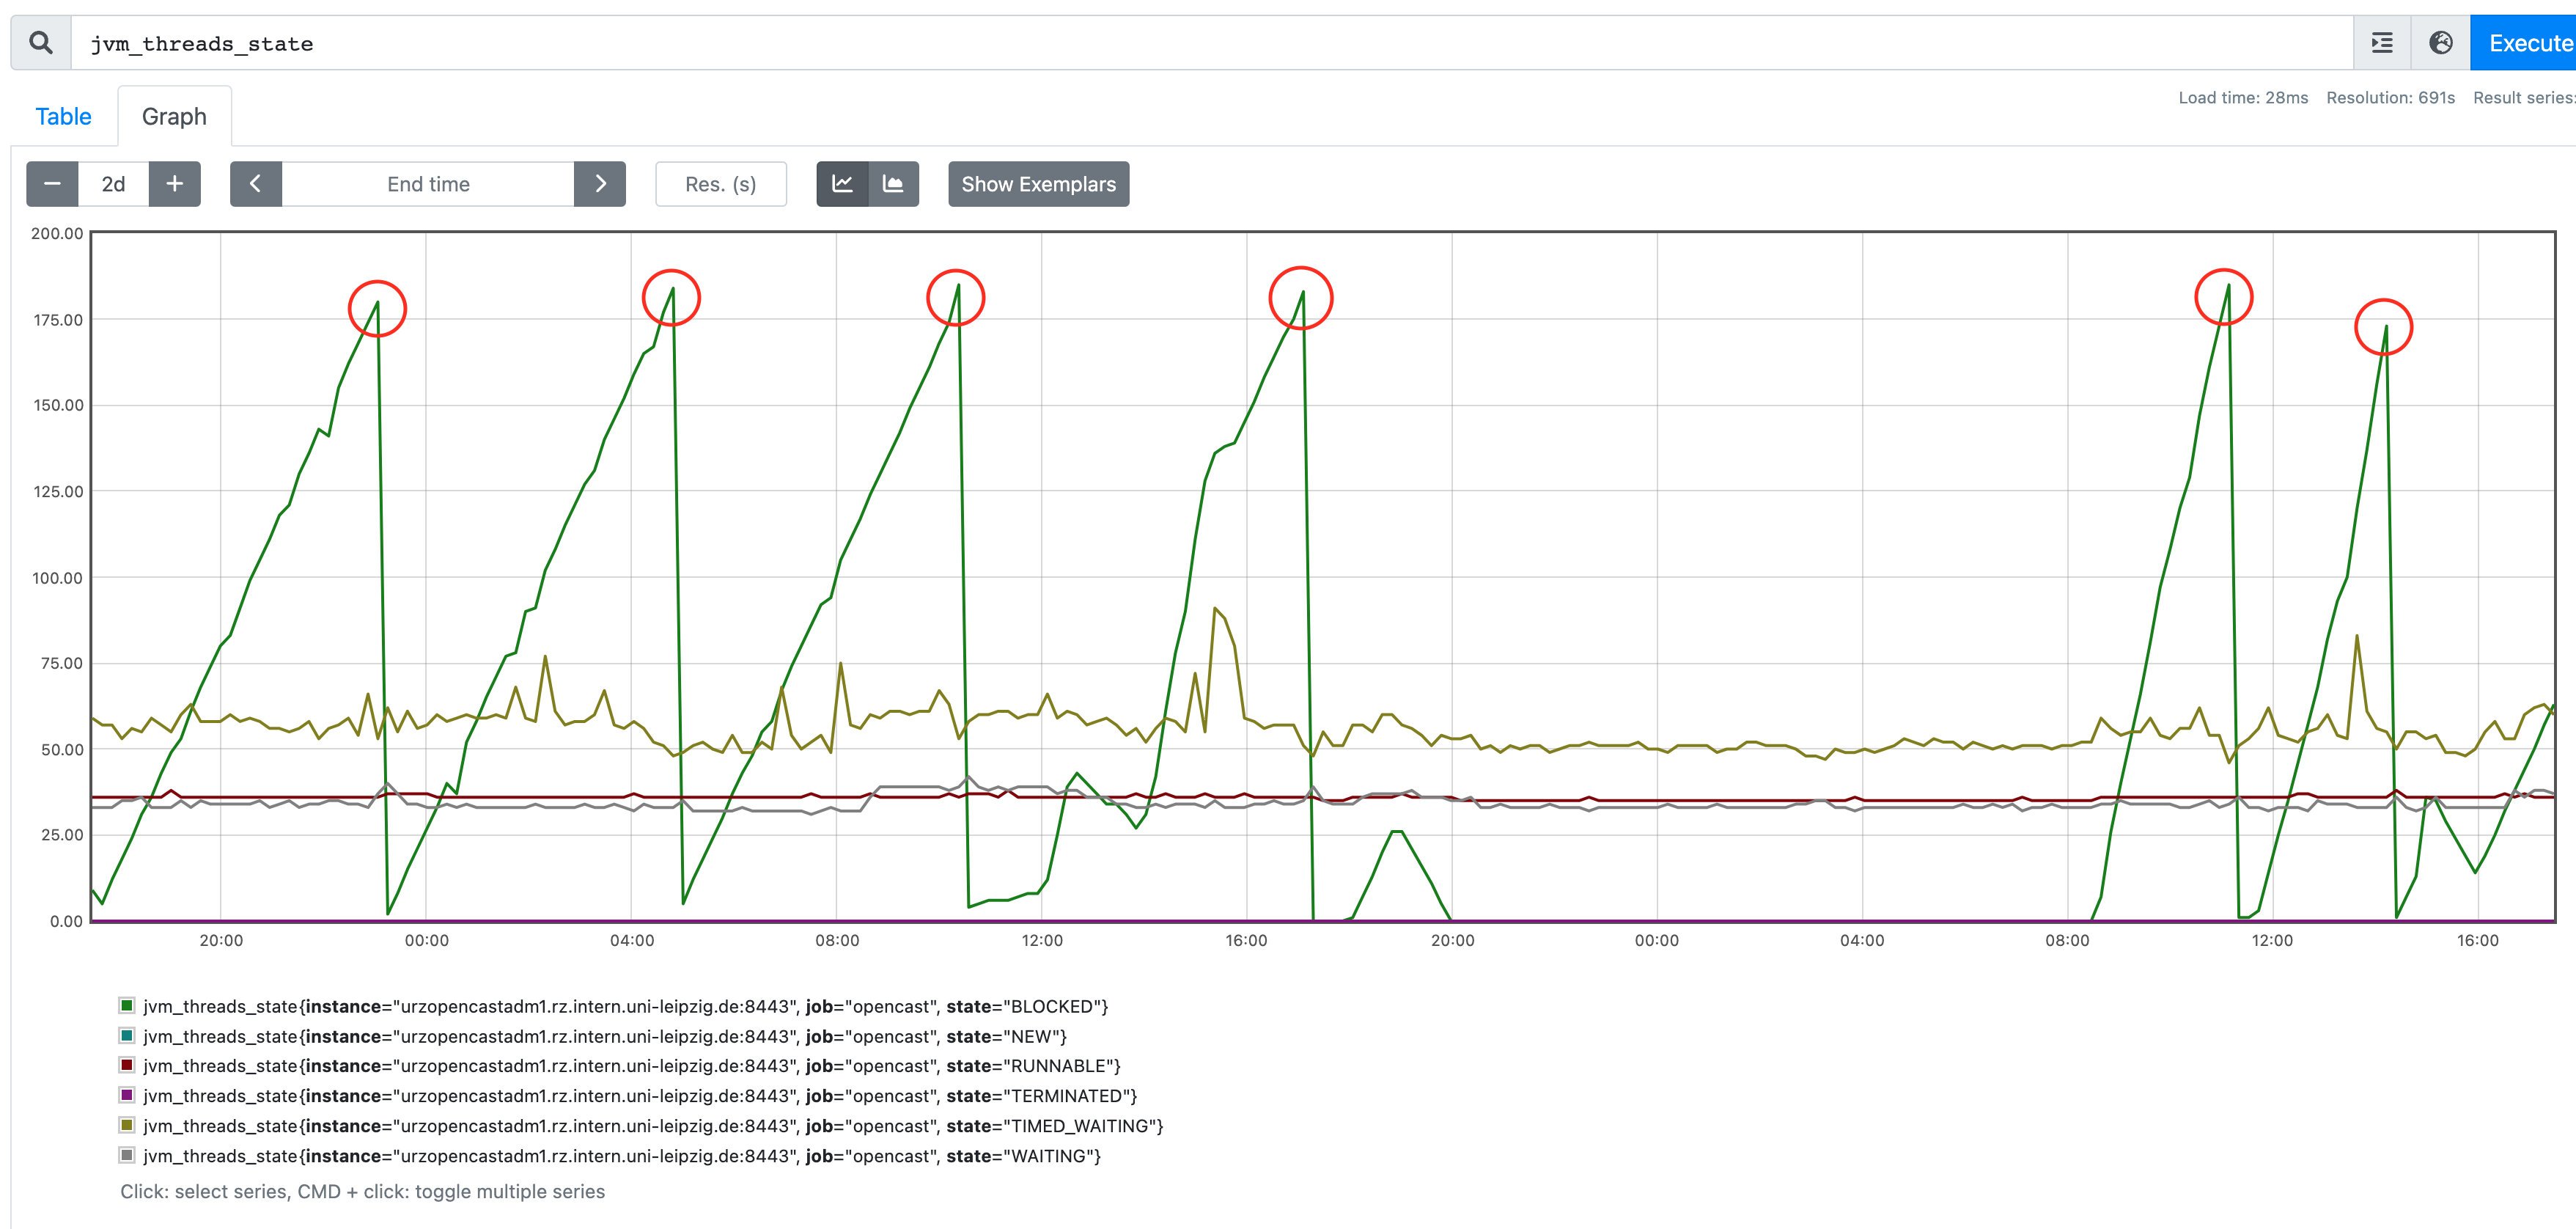
The red circles mark the moment the script kicks in and restarts opencast. I don't know if this metric is relevant, but it seems correlated.
Btw we are running opencast latest 11 version.
Other metrics like load or memory don't seem to correlate as there is no high load and no exhaustive memory consumption.
Best regards
Sven

Greg Logan
Oct 27, 2022, 11:58:41 AM10/27/22
to us...@opencast.org
Hi Sven,
A few questions:
- What do the last few lines of logging just before the freeze look like? What's Opencast doing at that point?
- What are the workers doing at that point? Are they seeing similar spikes of blocked threads?
- Are Elasticsearch and ActiveMQ seeing any weird loads or spikes?
This feels to me like a dispatching issue where it's getting stuck, but I have no idea how that would be happening just to you. I could also be a related service that's just not keeping up, or somehow getting stuck as well.
G
--
To unsubscribe from this group and stop receiving emails from it, send an email to users+un...@opencast.org.
s.la...@googlemail.com
Nov 1, 2022, 11:21:48 AM11/1/22
to Opencast Users, Greg Logan
Hi Greg,
most of the time, the last log entries are from a few minutes to an hour ago, depending on whether a recording was just processed.
Mostly it's like
"2022-10-24T17:18:10,558 | INFO | (StaticFileServiceImpl:319) - Start purging temporary storage section of all known organizations
2022-10-24T17:18:12,875 | INFO | (FileUploadServiceCleaner$Runner:120) - Start file upload service cleaner
2022-10-24T17:18:12,875 | INFO | (FileUploadServiceCleaner$Runner:126) - Finished file upload service cleaner
2022-10-24T18:18:10,558 | INFO | (StaticFileServiceImpl:319) - Start purging temporary storage section of all known organizations
2022-10-24T18:18:12,876 | INFO | (FileUploadServiceCleaner$Runner:120) - Start file upload service cleaner
2022-10-24T18:18:12,876 | INFO | (FileUploadServiceCleaner$Runner:126) - Finished file upload service cleaner
2022-10-24T19:18:10,558 | INFO | (StaticFileServiceImpl:319) - Start purging temporary storage section of all known organizations
2022-10-24T19:18:12,875 | INFO | (FileUploadServiceCleaner$Runner:120) - Start file upload service cleaner
2022-10-24T19:18:12,875 | INFO | (FileUploadServiceCleaner$Runner:126) - Finished file upload service cleaner
2022-10-24T20:18:10,558 | INFO | (StaticFileServiceImpl:319) - Start purging temporary storage section of all known organizations
2022-10-24T20:18:12,875 | INFO | (FileUploadServiceCleaner$Runner:120) - Start file upload service cleaner
2022-10-24T20:18:12,876 | INFO | (FileUploadServiceCleaner$Runner:126) - Finished file upload service cleaner"
and the freeze with restart occured at 2022-10-24 21:08 (09:08 p.m.).
Sometimes it takes a few days until the next freeze, on the other day it happens several times.
From what I see after monitoring a worker for a few hours, they seem not to have such blocking threads but I will monitor them a bit longer.
How can I monitor Elasticsearch and Active MQ?
Regards
Sven

Karen Dolan
Nov 1, 2022, 12:42:09 PM11/1/22
to us...@opencast.org
Hi Sven,
You can gather more Opencast processing information by changing the Opencast service's log levels from INFO to DEBUG in etc/org.ops4j.pax.logging.cfg file.
Change
log4j2.logger.opencast.level = INFO
to
log4j2.logger.opencast.level = DEBUG
If the logs fill up with irrelevant information, change as many unrelated Opencast package log levels to INFO as needed. For example:
# Helps to leave these at INFO level while debugging general opencast classes
log4j2.logger.scanner.name = org.opencastproject.ingest.scanner.Ingestor
log4j2.logger.scanner.level = INFO
log4j2.logger.kerneljsonfilter.name = org.opencastproject.kernel.rest.JsonpFilter
log4j2.logger.kerneljsonfilter.level = INFO
log4j2.logger.kernelTrustedAnonAuthFilter.name = org.opencastproject.kernel.security.TrustedAnonymousAuthenticationFilter
log4j2.logger.kernelTrustedAnonAuthFilter.level=INFO
log4j2.logger.kernelTrustedHttpClient.name = org.opencastproject.kernel.security.TrustedHttpClientImpl
log4j2.logger.kernelTrustedHttpClient.level = INFO
log4j2.logger.kernelHttpClient.name = org.opencastproject.kernel.http.impl.HttpClientImpl
log4j2.logger.kernelHttpClient.level = INFO
log4j2.logger.springframeworkAnonAuthFilter.name = org.security.web.authentication.AnonymousAuthenticationFilter
log4j2.logger.springframeworkAnonAuthFilter.level = INFO
This won't directly show the error, because a blocked thread stops logging after it’s been blocked. But, it might give clues prior to blocking. The freeze seems to happen at the top of a relatively steady upward slope, which implies an ongoing memory leak of open/blocked java threads, not a sudden event. I hope a pattern will emerge in the logs with the DEBUG log level. Consider adding DEBUG to the other nodes as well, if the issue looks like it’s related to job dispatch.
Best of luck,
Karen
Greg Logan
Nov 2, 2022, 1:05:51 PM11/2/22
to Opencast Users
Hi folks,
Karen has the right approach here, although I would be tempted to leave the top level logger alone and just add a debug logger for the serviceregistry. When I think about what Opencast does when it's otherwise idle (ie no active workflows) it's dispatching from an empty job list, checking that the other nodes are still live, and doing housecleaning. While there could be things tying up threads in other places, something in this set has clearly exhausted the *last* thread and therefore is known to be leaking. Let's start here.
Sven, that particular snippet of logs tells me that Opencast was idle at time of hang, otherwise there would be *something* other than the cleanup job happening. That, believe it or not, is a good thing since we know of at least one leak.
Try adding a debug level logger on the following packages:
- org.opencastproject.serviceregistry
- org.opencastproject.staticfiles.impl
- org.opencastproject.fileupload
That should spit out a fair big of logging, but it will hopefully give us some clues to identify the culprit. My concern here is that no one else is seeing this. I would expect a bug like this in a core component like these to be biting more adopters. This may be something to do with your local install/config.
G
s.la...@googlemail.com
Nov 2, 2022, 2:27:27 PM11/2/22
to Opencast Users, Greg Logan
Hi Karen and Greg,
thanks for your suggestions. I configured the logging as Greg suggested and am waiting for the logs to come.
Regards
Sven
s.la...@googlemail.com
Nov 3, 2022, 7:04:48 AM11/3/22
to Opencast Users, Greg Logan
Hi,
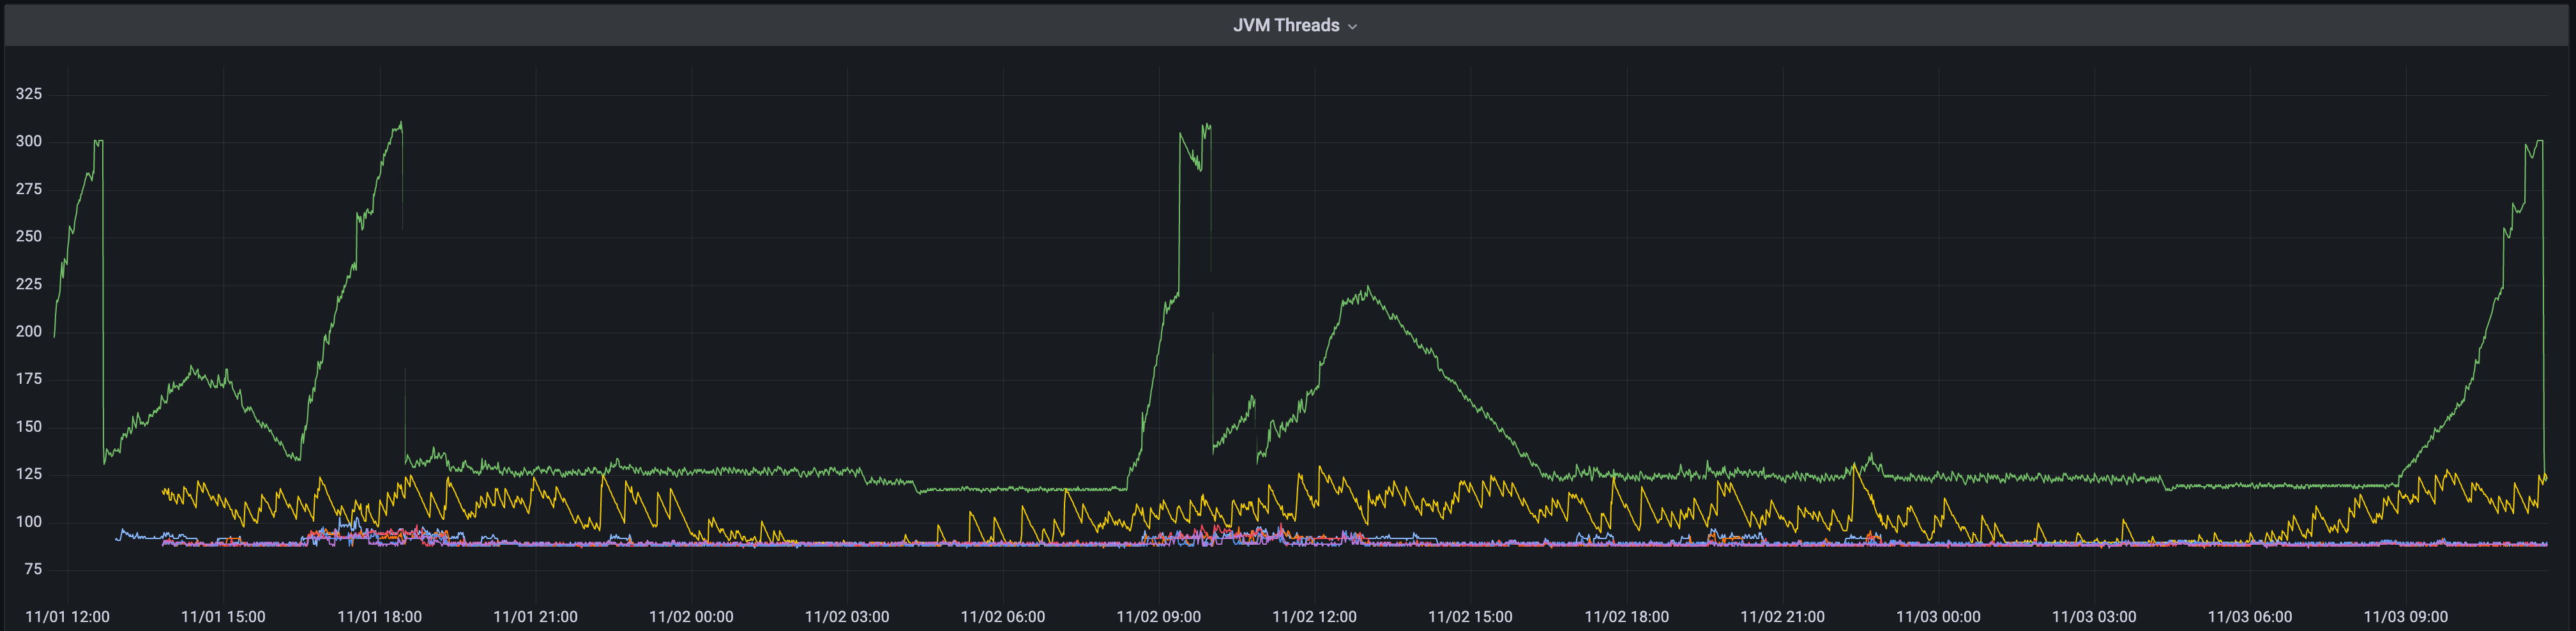
after waiting half a day it occured again.
The green line displays "jvm_current_threads" from the admin, the other colors are the worker and the presentation nodes.
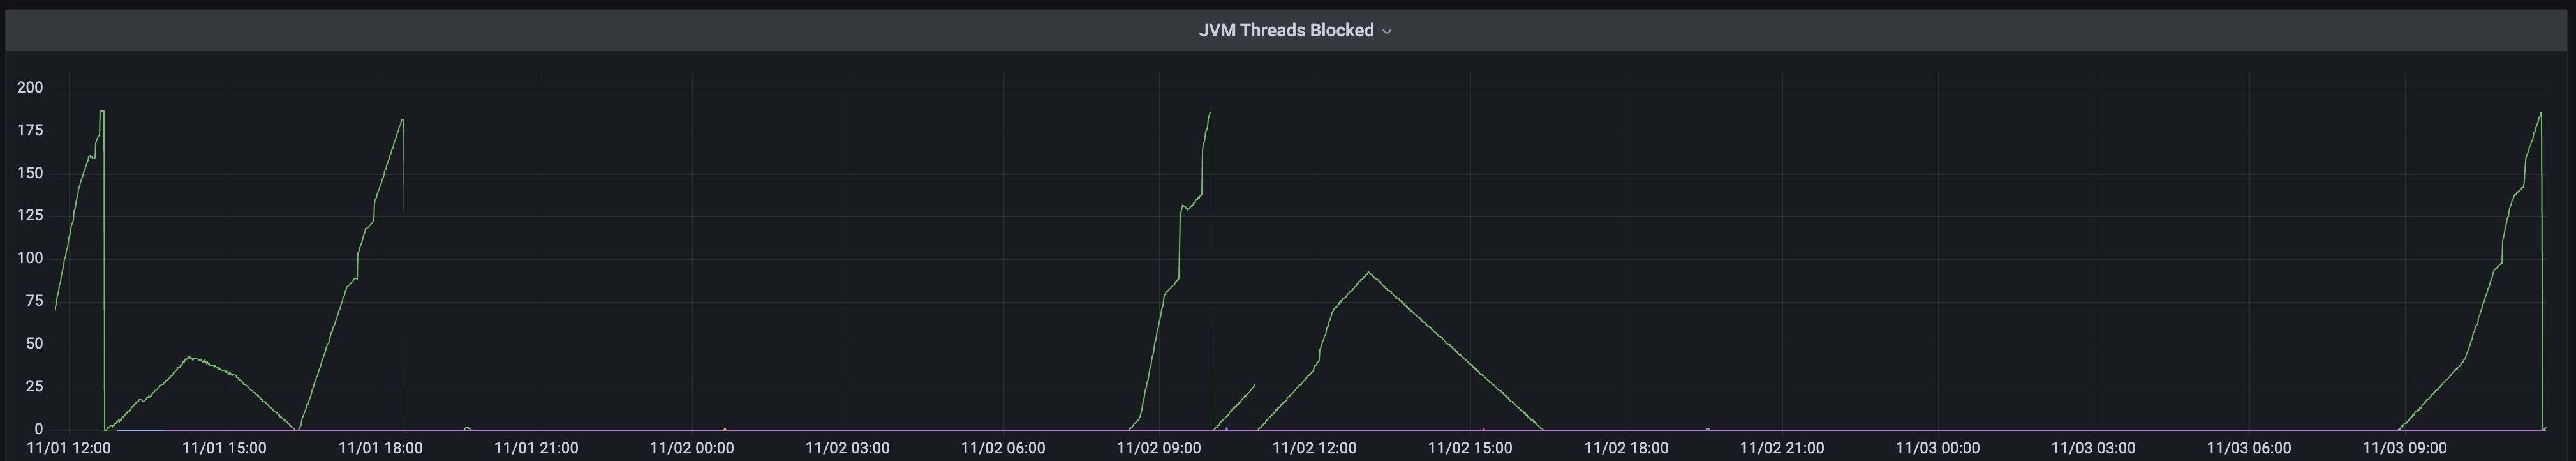
This green line shows the blocked JVM threads count.
The admin log:
2022-11-03T11:35:19,586 | DEBUG | (ServiceRegistryJpaImpl$JobDispatcher:2916) - Starting job dispatching
2022-11-03T11:35:19,587 | DEBUG | (ServiceRegistryJpaImpl$JobDispatcher:2995) - Finished job dispatching
2022-11-03T11:35:21,588 | DEBUG | (ServiceRegistryJpaImpl$JobDispatcher:2916) - Starting job dispatching
2022-11-03T11:35:21,589 | DEBUG | (ServiceRegistryJpaImpl$JobDispatcher:2995) - Finished job dispatching
2022-11-03T11:35:22,368 | DEBUG | (ServiceRegistryJpaImpl$JobProducerHeartbeat:3308) - Checking for unresponsive services
2022-11-03T11:35:23,589 | DEBUG | (ServiceRegistryJpaImpl$JobDispatcher:2916) - Starting job dispatching
2022-11-03T11:35:23,591 | DEBUG | (ServiceRegistryJpaImpl$JobDispatcher:2995) - Finished job dispatching
2022-11-03T11:35:23,857 | DEBUG | (ServiceRegistryJpaImpl$JobProducerHeartbeat:3380) - Finished checking for unresponsive services
2022-11-03T11:35:25,592 | DEBUG | (ServiceRegistryJpaImpl$JobDispatcher:2916) - Starting job dispatching
2022-11-03T11:35:25,593 | DEBUG | (ServiceRegistryJpaImpl$JobDispatcher:2995) - Finished job dispatching
2022-11-03T11:35:27,594 | DEBUG | (ServiceRegistryJpaImpl$JobDispatcher:2916) - Starting job dispatching
2022-11-03T11:35:27,596 | DEBUG | (ServiceRegistryJpaImpl$JobDispatcher:2995) - Finished job dispatching
2022-11-03T11:35:29,596 | DEBUG | (ServiceRegistryJpaImpl$JobDispatcher:2916) - Starting job dispatching
2022-11-03T11:35:29,598 | DEBUG | (ServiceRegistryJpaImpl$JobDispatcher:2995) - Finished job dispatching
2022-11-03T11:35:31,598 | DEBUG | (ServiceRegistryJpaImpl$JobDispatcher:2916) - Starting job dispatching
2022-11-03T11:35:31,600 | DEBUG | (ServiceRegistryJpaImpl$JobDispatcher:2995) - Finished job dispatching
2022-11-03T11:35:33,600 | DEBUG | (ServiceRegistryJpaImpl$JobDispatcher:2916) - Starting job dispatching
2022-11-03T11:35:33,602 | DEBUG | (ServiceRegistryJpaImpl$JobDispatcher:2995) - Finished job dispatching
I noticed, while my checking script which calls "curl -sSLk -m 10 https://admin.node:8443/info > /dev/null ;" and checks for timeout fails, opencast is still logging.
If you compare the timestamps from opencast log above and from my check script log below:
Curl Exit Code 0, COUNT 0
Curl Exit Code 0, COUNT 0
curl: (28) Operation timed out after 10002 milliseconds with 0 out of 0 bytes received
Achtung, Exit Code 1 um 2022-11-03 11:34:20
Curl Exit Code 0, COUNT 1
curl: (28) Operation timed out after 10001 milliseconds with 0 out of 0 bytes received
Achtung, Exit Code 1 um 2022-11-03 11:35:30
Curl Exit Code 0, COUNT 2
curl: (28) Operation timed out after 10001 milliseconds with 0 out of 0 bytes received
Achtung, Exit Code 1 um 2022-11-03 11:36:40
Curl Exit Code 0, COUNT 3
curl: (28) Operation timed out after 10000 milliseconds with 0 out of 0 bytes received
Achtung, Exit Code 1 um 2022-11-03 11:37:50
Opencast neugestartet um 2022-11-03 11:38:13
Curl Exit Code 0, COUNT 0
Curl Exit Code 0, COUNT 0
Curl Exit Code 0, COUNT 0
curl: (28) Operation timed out after 10002 milliseconds with 0 out of 0 bytes received
Achtung, Exit Code 1 um 2022-11-03 11:34:20
Curl Exit Code 0, COUNT 1
curl: (28) Operation timed out after 10001 milliseconds with 0 out of 0 bytes received
Achtung, Exit Code 1 um 2022-11-03 11:35:30
Curl Exit Code 0, COUNT 2
curl: (28) Operation timed out after 10001 milliseconds with 0 out of 0 bytes received
Achtung, Exit Code 1 um 2022-11-03 11:36:40
Curl Exit Code 0, COUNT 3
curl: (28) Operation timed out after 10000 milliseconds with 0 out of 0 bytes received
Achtung, Exit Code 1 um 2022-11-03 11:37:50
Opencast neugestartet um 2022-11-03 11:38:13
Curl Exit Code 0, COUNT 0
Curl Exit Code 0, COUNT 0
While this time opencast web ui is also not responding. Maybe I should wait longer before restarting opencast? Is there any thread limit for JVM, which always seems to be around 300. Could this be raised?
Regards
Sven
s.la...@googlemail.com
Nov 3, 2022, 12:53:21 PM11/3/22
to Opencast Users, s.la...@googlemail.com, Greg Logan
Hi there,
Screenshot showing output from "top" while opencast being unresponsive.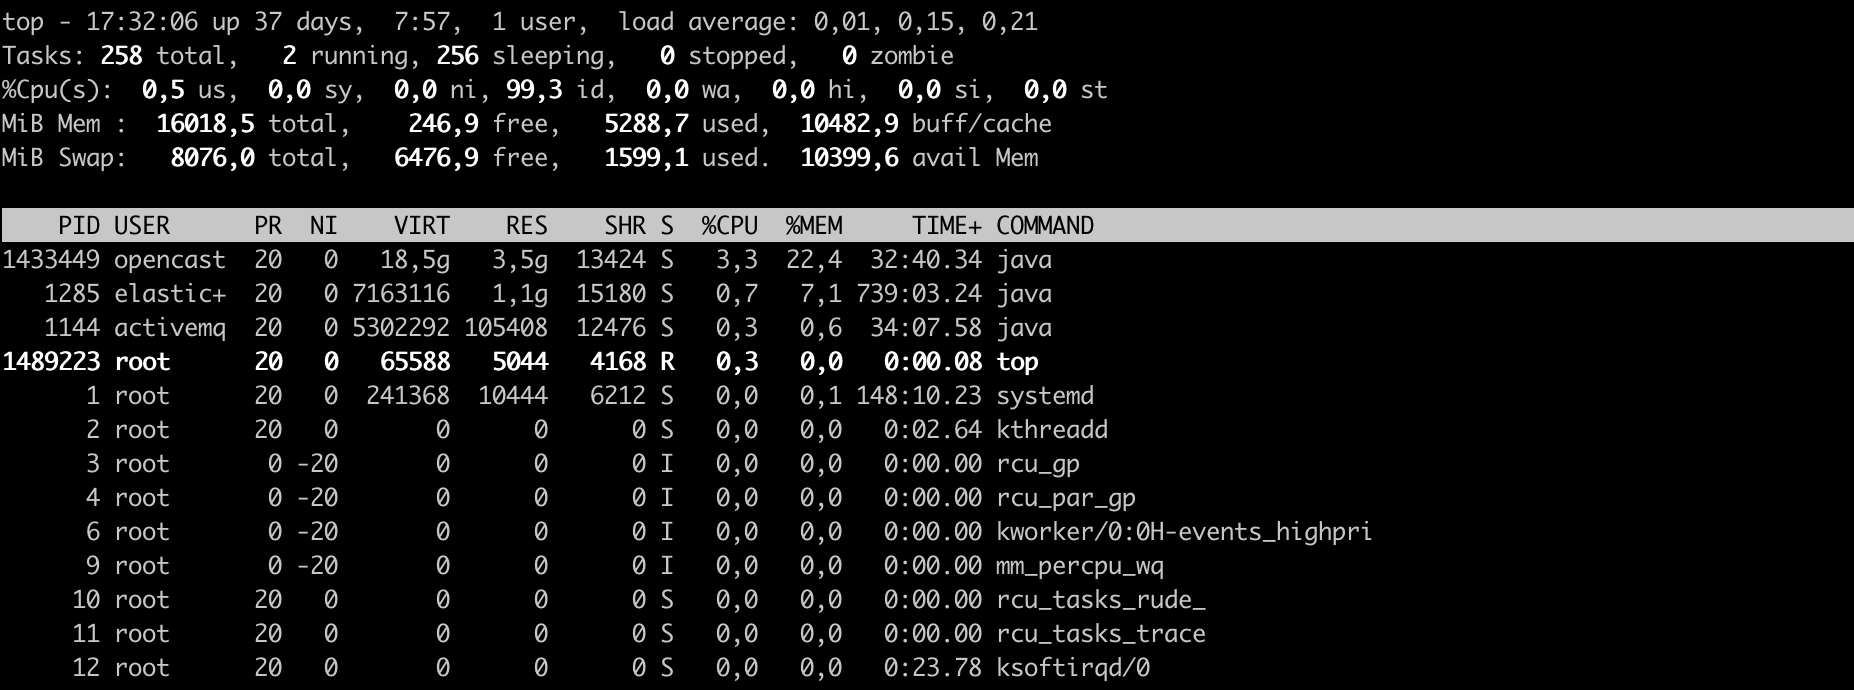
another finding.
While being unresponsive, opencast still seems to dispatch jobs, so maybe it's something with the admin ui?
2022-11-03T17:31:34,166 | DEBUG | (ServiceRegistryJpaImpl$JobDispatcher:2916) - Starting job dispatching
2022-11-03T17:31:34,167 | DEBUG | (ServiceRegistryJpaImpl$JobDispatcher:2995) - Finished job dispatching
2022-11-03T17:31:36,167 | DEBUG | (ServiceRegistryJpaImpl$JobDispatcher:2916) - Starting job dispatching
2022-11-03T17:31:36,180 | DEBUG | (ServiceRegistryJpaImpl:2807) - Finding services to dispatch job of type org.opencastproject.inspection
2022-11-03T17:31:36,180 | DEBUG | (ServiceRegistryJpaImpl:2843) - Adding candidate service org.opencastproject.inspection@https://worker1.node:8443 for processing of job of type 'org.opencastproject.inspection'
2022-11-03T17:31:36,180 | DEBUG | (ServiceRegistryJpaImpl:2843) - Adding candidate service org.opencastproject.inspection@https://worker2.node:8443 for processing of job of type 'org.opencastproject.inspection'
2022-11-03T17:31:36,180 | DEBUG | (ServiceRegistryJpaImpl:2843) - Adding candidate service org.opencastproject.inspection@https://worker5.node:8443 for processing of job of type 'org.opencastproject.inspection'
2022-11-03T17:31:36,180 | DEBUG | (ServiceRegistryJpaImpl:2843) - Adding candidate service org.opencastproject.inspection@https://worker6.node:8443 for processing of job of type 'org.opencastproject.inspection'
2022-11-03T17:31:36,180 | DEBUG | (ServiceRegistryJpaImpl:2843) - Adding candidate service org.opencastproject.inspection@https://worker7.node:8443 for processing of job of type 'org.opencastproject.inspection'
2022-11-03T17:31:36,181 | DEBUG | (ServiceRegistryJpaImpl:1110) - Job {id:62589630, operation:Inspect, status:DISPATCHING} has host 'https://worker5.node:8443': setting processor service to 'org.opencastproject.inspection@https://worker5.node:8443'
2022-11-03T17:31:36,183 | DEBUG | (ServiceRegistryJpaImpl$JobDispatcher:3194) - Trying to dispatch Job {id:62589630, operation:Inspect, status:DISPATCHING} type 'org.opencastproject.inspection' load 0.2 to https://worker5.node:8443
2022-11-03T17:31:36,233 | DEBUG | (ServiceRegistryJpaImpl$JobDispatcher:3106) - Job {id:62589630, operation:Inspect, status:DISPATCHING} dispatched to https://worker5.node:8443
2022-11-03T17:31:36,234 | DEBUG | (ServiceRegistryJpaImpl$JobDispatcher:2995) - Finished job dispatching
2022-11-03T17:31:38,235 | DEBUG | (ServiceRegistryJpaImpl$JobDispatcher:2916) - Starting job dispatching
2022-11-03T17:31:38,237 | DEBUG | (ServiceRegistryJpaImpl$JobDispatcher:2995) - Finished job dispatching
Screenshot showing output from "top" while opencast being unresponsive.
I think, it could be a resource thing. It seems, system is low on memory. I now extended memory to 24g. Hopefully this will solve the problem.
Regards
Sven
Greg Logan
Nov 3, 2022, 4:57:52 PM11/3/22
to Opencast Users
Hi Sven,
It occurs to me that you've got thread details here. Are you by any chance getting those via JMX? Our JMX bits are known to be problematic, which is why they're disabled by default. They also, incidentally, caused errors stemming from the admin UI endpoints IIRC (it's been a *long* time at this point).
G
s.la...@googlemail.com
Nov 4, 2022, 2:45:46 AM11/4/22
to Opencast Users, Greg Logan
Hi Greg,
no I'm not doing any JMX magic.
All I've done was using the /metrics endpoint and gathering those metrics with prometheus. The visualisation comes from grafana.
By the way, giving the node more memory resources didn't change the behaviour. The node stuck two times this night.
Regards
Sven
s.la...@googlemail.com
Nov 7, 2022, 10:48:08 AM11/7/22
to Opencast Users, Greg Logan
Hi Greg,
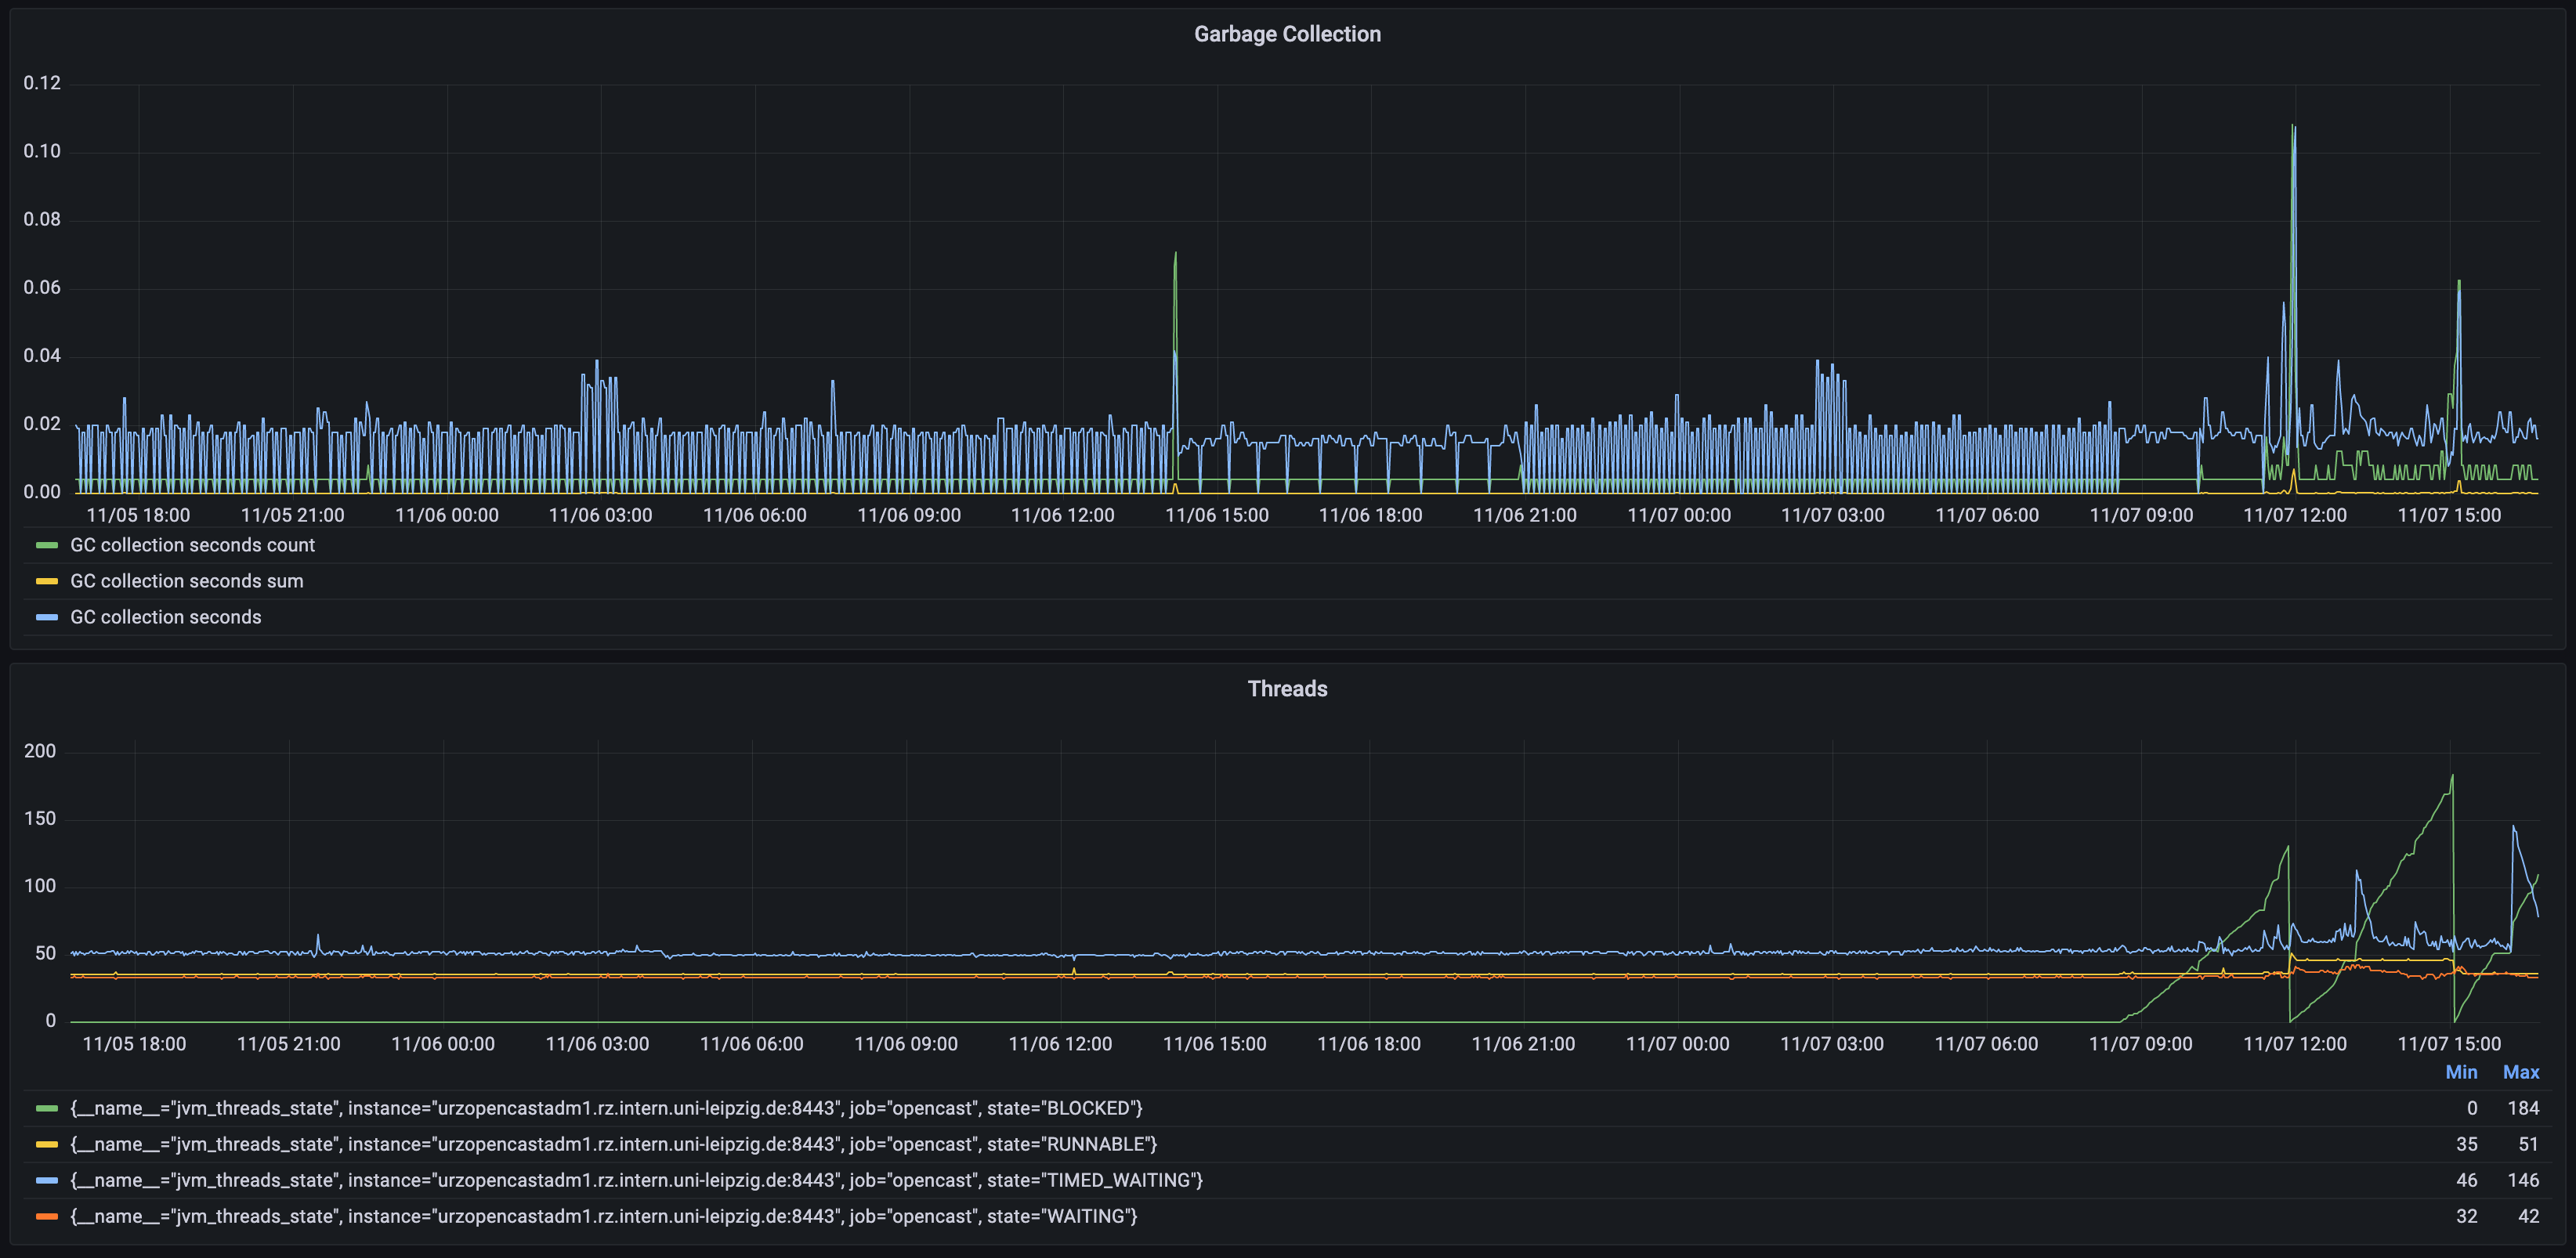
today I extended my check script for doing a java thread dump (found coincidentally at a project using the same foundation as opencast https://github.com/openhab/openhab-core/issues/1998).
I've attached the thread dump from the last hiccup.
Maybe this helps identifying the problem? Unfortunately I'm not that deep into java.
I also tried to visualize the JVM garbage collection from prometheus data, you'll find the resulting image attached too.
Regards
Sven
Sven Laudel
Dec 2, 2022, 2:49:00 AM12/2/22
to us...@opencast.org, Greg Logan
Hi Greg,
yes indeed it is.
Do you remember me mentioning „opencast behind institutional proxy“ (https://groups.google.com/a/opencast.org/g/users/c/JUgKHorOGt8/m/N9qTppQPCQAJ)?
This is our opencast, it is inside the private university network and can only talk to outside via our proxy.
What could I do to mitigate this issue? Can I disable this somehow?
Kind regards
Sven
Am 01.12.2022 um 22:55 schrieb Greg Logan <gregor...@gmail.com>:Ah, interesting. There are a *lot* of threads blocked on VersionEndpoint.updateVersion(), which happens to talk to GitHub to fetch the latest Opencast version - this is what backs the UI bubble that complains when you're running an out of date version. Is your admin node by any chance firewalled off from GitHub?Technical details: the method is syncrhonized, but if the call that's active is somehow tarpitted during its request to GitHub then the rest would just block. Add a deep enough pit, and enough queries from the UI and....G
Hi Greg,today I extended my check script for doing a java thread dump (found coincidentally at a project using the same foundation as opencast https://github.com/openhab/openhab-core/issues/1998).I've attached the thread dump from the last hiccup.Maybe this helps identifying the problem? Unfortunately I'm not that deep into java.I also tried to visualize the JVM garbage collection from prometheus data, you'll find the resulting image attached too.
Sven Laudel
Dec 15, 2022, 3:58:22 AM12/15/22
to us...@opencast.org, Greg Logan
Hi Greg,
I’m running opencast 11.12 now but I’m still getting the following error message logged:
2022-12-15T09:30:13,590 | ERROR | (ScheduledDataCollector:209) - Error occurred while processing adopter general data.
org.apache.http.conn.HttpHostConnectException: Connect to register.opencast.org:443 [register.opencast.org/131.173.22.86] failed: Die Wartezeit für die Verbindung ist abgelaufen (Connection timed out)
at org.apache.http.impl.conn.DefaultHttpClientConnectionOperator.connect(DefaultHttpClientConnectionOperator.java:156) ~[!/:4.5.13]
at org.apache.http.impl.conn.PoolingHttpClientConnectionManager.connect(PoolingHttpClientConnectionManager.java:376) ~[!/:4.5.13]
at org.apache.http.impl.execchain.MainClientExec.establishRoute(MainClientExec.java:393) ~[!/:4.5.13]
at org.apache.http.impl.execchain.MainClientExec.execute(MainClientExec.java:236) ~[!/:4.5.13]
at org.apache.http.impl.execchain.ProtocolExec.execute(ProtocolExec.java:186) ~[!/:4.5.13]
at org.apache.http.impl.execchain.RetryExec.execute(RetryExec.java:89) ~[!/:4.5.13]
at org.apache.http.impl.execchain.RedirectExec.execute(RedirectExec.java:110) ~[!/:4.5.13]
at org.apache.http.impl.client.InternalHttpClient.doExecute(InternalHttpClient.java:185) ~[!/:4.5.13]
at org.apache.http.impl.client.CloseableHttpClient.execute(CloseableHttpClient.java:83) ~[!/:4.5.13]
at org.apache.http.impl.client.CloseableHttpClient.execute(CloseableHttpClient.java:108) ~[!/:4.5.13]
at org.apache.http.impl.client.CloseableHttpClient.execute(CloseableHttpClient.java:56) ~[!/:4.5.13]
at org.opencastproject.adopter.statistic.Sender.send(Sender.java:143) ~[!/:?]
at org.opencastproject.adopter.statistic.Sender.send(Sender.java:120) ~[!/:?]
at org.opencastproject.adopter.statistic.Sender.sendGeneralData(Sender.java:82) ~[!/:?]
at org.opencastproject.adopter.statistic.ScheduledDataCollector.run(ScheduledDataCollector.java:207) [!/:?]
at java.util.TimerThread.mainLoop(Timer.java:556) [?:?]
at java.util.TimerThread.run(Timer.java:506) [?:?]
Caused by: java.net.ConnectException: Die Wartezeit für die Verbindung ist abgelaufen (Connection timed out)
at java.net.PlainSocketImpl.socketConnect(Native Method) ~[?:?]
at java.net.AbstractPlainSocketImpl.doConnect(AbstractPlainSocketImpl.java:412) ~[?:?]
at java.net.AbstractPlainSocketImpl.connectToAddress(AbstractPlainSocketImpl.java:255) ~[?:?]
at java.net.AbstractPlainSocketImpl.connect(AbstractPlainSocketImpl.java:237) ~[?:?]
at java.net.SocksSocketImpl.connect(SocksSocketImpl.java:392) ~[?:?]
at java.net.Socket.connect(Socket.java:609) ~[?:?]
at org.apache.http.conn.ssl.SSLConnectionSocketFactory.connectSocket(SSLConnectionSocketFactory.java:368) ~[!/:4.5.13]
at org.apache.http.impl.conn.DefaultHttpClientConnectionOperator.connect(DefaultHttpClientConnectionOperator.java:142) ~[!/:4.5.13]
... 16 more
The proxy to use is set via environment variables. Do I need to explicitly tell opencast to use the proxy and if so, how do I do this?
Kind regards
Sven
Sven Laudel
Dec 15, 2022, 6:25:24 AM12/15/22
to us...@opencast.org
Hi Greg,
it’s me again.
I had the idea to log for „org.opencastproject.adminui.endpoint.VersionEndpoint" and changed the logging.
After that the log regularly sees the following entries:
2022-12-15T12:17:08,309 | DEBUG | (VersionEndpoint:113) - Could not get version from GitHub
org.apache.http.conn.HttpHostConnectException: Connect to api.github.com:443 [api.github.com/140.82.121.6] failed: Die Wartezeit für die Verbindung ist abgelaufen (Connection timed out)
at org.apache.http.impl.conn.DefaultHttpClientConnectionOperator.connect(DefaultHttpClientConnectionOperator.java:156) ~[!/:4.5.13]
at org.apache.http.impl.conn.PoolingHttpClientConnectionManager.connect(PoolingHttpClientConnectionManager.java:376) ~[!/:4.5.13]
at org.apache.http.impl.execchain.MainClientExec.establishRoute(MainClientExec.java:393) ~[!/:4.5.13]
at org.apache.http.impl.execchain.MainClientExec.execute(MainClientExec.java:236) ~[!/:4.5.13]
at org.apache.http.impl.execchain.ProtocolExec.execute(ProtocolExec.java:186) ~[!/:4.5.13]
at org.apache.http.impl.execchain.RetryExec.execute(RetryExec.java:89) ~[!/:4.5.13]
at org.apache.http.impl.execchain.RedirectExec.execute(RedirectExec.java:110) ~[!/:4.5.13]
at org.apache.http.impl.client.InternalHttpClient.doExecute(InternalHttpClient.java:185) ~[!/:4.5.13]
at org.apache.http.impl.client.CloseableHttpClient.execute(CloseableHttpClient.java:83) ~[!/:4.5.13]
at org.apache.http.impl.client.CloseableHttpClient.execute(CloseableHttpClient.java:108) ~[!/:4.5.13]
at org.apache.http.impl.client.CloseableHttpClient.execute(CloseableHttpClient.java:56) ~[!/:4.5.13]
at org.opencastproject.adminui.endpoint.VersionEndpoint.updateVersion(VersionEndpoint.java:109) [!/:?]
at org.opencastproject.adminui.endpoint.VersionEndpoint.getVersion(VersionEndpoint.java:96) [!/:?]
at jdk.internal.reflect.GeneratedMethodAccessor102.invoke(Unknown Source) ~[?:?]
at jdk.internal.reflect.DelegatingMethodAccessorImpl.invoke(DelegatingMethodAccessorImpl.java:43) ~[?:?]
at java.lang.reflect.Method.invoke(Method.java:566) ~[?:?]
at org.apache.cxf.service.invoker.AbstractInvoker.performInvocation(AbstractInvoker.java:179) [!/:3.4.3]
at org.apache.cxf.service.invoker.AbstractInvoker.invoke(AbstractInvoker.java:96) [!/:3.4.3]
at org.apache.cxf.jaxrs.JAXRSInvoker.invoke(JAXRSInvoker.java:201) [!/:3.4.3]
at org.apache.cxf.jaxrs.JAXRSInvoker.invoke(JAXRSInvoker.java:104) [!/:3.4.3]
at org.apache.cxf.interceptor.ServiceInvokerInterceptor$1.run(ServiceInvokerInterceptor.java:59) [!/:3.4.3]
at org.apache.cxf.interceptor.ServiceInvokerInterceptor.handleMessage(ServiceInvokerInterceptor.java:96) [!/:3.4.3]
at org.apache.cxf.phase.PhaseInterceptorChain.doIntercept(PhaseInterceptorChain.java:308) [!/:3.4.3]
at org.apache.cxf.transport.ChainInitiationObserver.onMessage(ChainInitiationObserver.java:121) [!/:3.4.3]
at org.apache.cxf.transport.http.AbstractHTTPDestination.invoke(AbstractHTTPDestination.java:265) [!/:3.4.3]
at org.apache.cxf.transport.servlet.ServletController.invokeDestination(ServletController.java:234) [!/:3.4.3]
at org.apache.cxf.transport.servlet.ServletController.invoke(ServletController.java:208) [!/:3.4.3]
at org.apache.cxf.transport.servlet.ServletController.invoke(ServletController.java:160) [!/:3.4.3]
at org.apache.cxf.transport.servlet.CXFNonSpringServlet.invoke(CXFNonSpringServlet.java:225) [!/:3.4.3]
at org.apache.cxf.transport.servlet.AbstractHTTPServlet.handleRequest(AbstractHTTPServlet.java:298) [!/:3.4.3]
at org.opencastproject.kernel.rest.RestPublisher$RestServlet.handleRequest(RestPublisher.java:559) [!/:?]
at org.apache.cxf.transport.servlet.AbstractHTTPServlet.doGet(AbstractHTTPServlet.java:222) [!/:3.4.3]
at javax.servlet.http.HttpServlet.service(HttpServlet.java:687) [!/:3.1.0]
at org.apache.cxf.transport.servlet.AbstractHTTPServlet.service(AbstractHTTPServlet.java:273) [!/:3.4.3]
at org.eclipse.jetty.servlet.ServletHolder.handle(ServletHolder.java:763) [!/:9.4.28.v20200408]
at org.eclipse.jetty.servlet.ServletHandler$CachedChain.doFilter(ServletHandler.java:1631) [!/:9.4.28.v20200408]
at org.opencastproject.kernel.rest.JsonpFilter.doFilter(JsonpFilter.java:113) [!/:?]
at org.eclipse.jetty.servlet.ServletHandler$CachedChain.doFilter(ServletHandler.java:1618) [!/:9.4.28.v20200408]
at org.opencastproject.security.urlsigning.filter.UrlSigningFilter.doFilter(UrlSigningFilter.java:86) [!/:?]
at org.eclipse.jetty.servlet.ServletHandler$CachedChain.doFilter(ServletHandler.java:1618) [!/:9.4.28.v20200408]
at org.opencastproject.kernel.filter.proxy.TransparentProxyFilter.doFilter(TransparentProxyFilter.java:63) [!/:?]
at org.eclipse.jetty.servlet.ServletHandler$CachedChain.doFilter(ServletHandler.java:1618) [!/:9.4.28.v20200408]
at org.opencastproject.kernel.security.RemoteUserAndOrganizationFilter.doFilter(RemoteUserAndOrganizationFilter.java:247) [!/:?]
at org.eclipse.jetty.servlet.ServletHandler$CachedChain.doFilter(ServletHandler.java:1618) [!/:9.4.28.v20200408]
at org.opencastproject.kernel.rest.CurrentJobFilter.doFilter(CurrentJobFilter.java:87) [!/:?]
at org.eclipse.jetty.servlet.ServletHandler$CachedChain.doFilter(ServletHandler.java:1618) [!/:9.4.28.v20200408]
at org.springframework.security.web.FilterChainProxy$VirtualFilterChain.doFilter(FilterChainProxy.java:330) [!/:3.1.7.RELEASE]
at org.springframework.security.web.access.intercept.FilterSecurityInterceptor.invoke(FilterSecurityInterceptor.java:118) [!/:3.1.7.RELEASE]
at org.springframework.security.web.access.intercept.FilterSecurityInterceptor.doFilter(FilterSecurityInterceptor.java:84) [!/:3.1.7.RELEASE]
at org.springframework.security.web.FilterChainProxy$VirtualFilterChain.doFilter(FilterChainProxy.java:342) [!/:3.1.7.RELEASE]
at org.opencastproject.kernel.security.AsyncTimeoutRedirectFilter.doFilter(AsyncTimeoutRedirectFilter.java:60) [!/:?]
at org.springframework.security.web.FilterChainProxy$VirtualFilterChain.doFilter(FilterChainProxy.java:342) [!/:3.1.7.RELEASE]
at org.springframework.security.web.access.ExceptionTranslationFilter.doFilter(ExceptionTranslationFilter.java:113) [!/:3.1.7.RELEASE]
at org.springframework.security.web.FilterChainProxy$VirtualFilterChain.doFilter(FilterChainProxy.java:342) [!/:3.1.7.RELEASE]
at org.springframework.security.web.session.SessionManagementFilter.doFilter(SessionManagementFilter.java:103) [!/:3.1.7.RELEASE]
at org.springframework.security.web.FilterChainProxy$VirtualFilterChain.doFilter(FilterChainProxy.java:342) [!/:3.1.7.RELEASE]
at org.springframework.security.web.authentication.AnonymousAuthenticationFilter.doFilter(AnonymousAuthenticationFilter.java:113) [!/:3.1.7.RELEASE]
at org.springframework.security.web.FilterChainProxy$VirtualFilterChain.doFilter(FilterChainProxy.java:342) [!/:3.1.7.RELEASE]
at org.springframework.security.web.authentication.rememberme.RememberMeAuthenticationFilter.doFilter(RememberMeAuthenticationFilter.java:146) [!/:3.1.7.RELEASE]
at org.springframework.security.web.FilterChainProxy$VirtualFilterChain.doFilter(FilterChainProxy.java:342) [!/:3.1.7.RELEASE]
at org.springframework.security.web.servletapi.SecurityContextHolderAwareRequestFilter.doFilter(SecurityContextHolderAwareRequestFilter.java:54) [!/:3.1.7.RELEASE]
at org.springframework.security.web.FilterChainProxy$VirtualFilterChain.doFilter(FilterChainProxy.java:342) [!/:3.1.7.RELEASE]
at org.springframework.security.web.savedrequest.RequestCacheAwareFilter.doFilter(RequestCacheAwareFilter.java:45) [!/:3.1.7.RELEASE]
at org.springframework.security.web.FilterChainProxy$VirtualFilterChain.doFilter(FilterChainProxy.java:342) [!/:3.1.7.RELEASE]
at org.springframework.web.filter.CompositeFilter$VirtualFilterChain.doFilter(CompositeFilter.java:98) [!/:3.1.4.RELEASE]
at org.springframework.security.oauth.provider.filter.OAuthProviderProcessingFilter.doFilter(OAuthProviderProcessingFilter.java:182) [!/:?]
at org.springframework.web.filter.CompositeFilter$VirtualFilterChain.doFilter(CompositeFilter.java:102) [!/:3.1.4.RELEASE]
at org.springframework.security.web.authentication.www.BasicAuthenticationFilter.doFilter(BasicAuthenticationFilter.java:150) [!/:3.1.7.RELEASE]
at org.springframework.web.filter.CompositeFilter$VirtualFilterChain.doFilter(CompositeFilter.java:102) [!/:3.1.4.RELEASE]
at org.springframework.security.web.authentication.www.DigestAuthenticationFilter.doFilter(DigestAuthenticationFilter.java:115) [!/:3.1.7.RELEASE]
at org.springframework.web.filter.CompositeFilter$VirtualFilterChain.doFilter(CompositeFilter.java:102) [!/:3.1.4.RELEASE]
at org.springframework.web.filter.CompositeFilter.doFilter(CompositeFilter.java:82) [!/:3.1.4.RELEASE]
at org.springframework.security.web.FilterChainProxy$VirtualFilterChain.doFilter(FilterChainProxy.java:342) [!/:3.1.7.RELEASE]
at org.springframework.security.web.authentication.ui.DefaultLoginPageGeneratingFilter.doFilter(DefaultLoginPageGeneratingFilter.java:91) [!/:3.1.7.RELEASE]
at org.springframework.security.web.FilterChainProxy$VirtualFilterChain.doFilter(FilterChainProxy.java:342) [!/:3.1.7.RELEASE]
at org.springframework.security.web.authentication.AbstractAuthenticationProcessingFilter.doFilter(AbstractAuthenticationProcessingFilter.java:183) [!/:3.1.7.RELEASE]
at org.springframework.security.web.FilterChainProxy$VirtualFilterChain.doFilter(FilterChainProxy.java:342) [!/:3.1.7.RELEASE]
at org.springframework.security.web.authentication.logout.LogoutFilter.doFilter(LogoutFilter.java:105) [!/:3.1.7.RELEASE]
at org.springframework.security.web.FilterChainProxy$VirtualFilterChain.doFilter(FilterChainProxy.java:342) [!/:3.1.7.RELEASE]
at org.springframework.security.web.context.SecurityContextPersistenceFilter.doFilter(SecurityContextPersistenceFilter.java:87) [!/:3.1.7.RELEASE]
at org.springframework.security.web.FilterChainProxy$VirtualFilterChain.doFilter(FilterChainProxy.java:342) [!/:3.1.7.RELEASE]
at org.springframework.security.web.FilterChainProxy.doFilterInternal(FilterChainProxy.java:192) [!/:3.1.7.RELEASE]
at org.springframework.security.web.FilterChainProxy.doFilter(FilterChainProxy.java:160) [!/:3.1.7.RELEASE]
at org.opencastproject.kernel.security.SecurityFilter.doFilter(SecurityFilter.java:124) [!/:?]
at org.eclipse.jetty.servlet.ServletHandler$CachedChain.doFilter(ServletHandler.java:1618) [!/:9.4.28.v20200408]
at org.opencastproject.kernel.security.OrganizationFilter.doFilter(OrganizationFilter.java:135) [!/:?]
at org.eclipse.jetty.servlet.ServletHandler$CachedChain.doFilter(ServletHandler.java:1618) [!/:9.4.28.v20200408]
at org.opencastproject.kernel.filter.https.HttpsFilter.doFilter(HttpsFilter.java:73) [!/:?]
at org.eclipse.jetty.servlet.ServletHandler$CachedChain.doFilter(ServletHandler.java:1618) [!/:9.4.28.v20200408]
at org.opencastproject.kernel.rest.CleanSessionsFilter.doFilter(CleanSessionsFilter.java:89) [!/:?]
at org.eclipse.jetty.servlet.ServletHandler$CachedChain.doFilter(ServletHandler.java:1610) [!/:9.4.28.v20200408]
at org.eclipse.jetty.websocket.server.WebSocketUpgradeFilter.doFilter(WebSocketUpgradeFilter.java:226) [!/:9.4.28.v20200408]
at org.eclipse.jetty.servlet.ServletHandler$CachedChain.doFilter(ServletHandler.java:1618) [!/:9.4.28.v20200408]
at org.eclipse.jetty.servlet.ServletHandler.doHandle(ServletHandler.java:549) [!/:9.4.28.v20200408]
at org.ops4j.pax.web.service.jetty.internal.HttpServiceServletHandler.doHandle(HttpServiceServletHandler.java:71) [!/:?]
at org.eclipse.jetty.server.handler.ScopedHandler.handle(ScopedHandler.java:143) [!/:9.4.28.v20200408]
at org.eclipse.jetty.security.SecurityHandler.handle(SecurityHandler.java:602) [!/:9.4.28.v20200408]
at org.eclipse.jetty.server.handler.HandlerWrapper.handle(HandlerWrapper.java:127) [!/:9.4.28.v20200408]
at org.eclipse.jetty.server.handler.ScopedHandler.nextHandle(ScopedHandler.java:235) [!/:9.4.28.v20200408]
at org.eclipse.jetty.server.session.SessionHandler.doHandle(SessionHandler.java:1610) [!/:9.4.28.v20200408]
at org.eclipse.jetty.server.handler.ScopedHandler.nextHandle(ScopedHandler.java:233) [!/:9.4.28.v20200408]
at org.eclipse.jetty.server.handler.ContextHandler.doHandle(ContextHandler.java:1363) [!/:9.4.28.v20200408]
at org.ops4j.pax.web.service.jetty.internal.HttpServiceContext.doHandle(HttpServiceContext.java:298) [!/:?]
at org.eclipse.jetty.server.handler.ScopedHandler.nextScope(ScopedHandler.java:188) [!/:9.4.28.v20200408]
at org.eclipse.jetty.servlet.ServletHandler.doScope(ServletHandler.java:489) [!/:9.4.28.v20200408]
at org.eclipse.jetty.server.session.SessionHandler.doScope(SessionHandler.java:1580) [!/:9.4.28.v20200408]
at org.eclipse.jetty.server.handler.ScopedHandler.nextScope(ScopedHandler.java:186) [!/:9.4.28.v20200408]
at org.eclipse.jetty.server.handler.ContextHandler.doScope(ContextHandler.java:1278) [!/:9.4.28.v20200408]
at org.eclipse.jetty.server.handler.ScopedHandler.handle(ScopedHandler.java:141) [!/:9.4.28.v20200408]
at org.ops4j.pax.web.service.jetty.internal.JettyServerHandlerCollection.handle(JettyServerHandlerCollection.java:82) [!/:?]
at org.eclipse.jetty.server.handler.HandlerWrapper.handle(HandlerWrapper.java:127) [!/:9.4.28.v20200408]
at org.eclipse.jetty.server.Server.handle(Server.java:500) [!/:9.4.28.v20200408]
at org.eclipse.jetty.server.HttpChannel.lambda$handle$1(HttpChannel.java:383) [!/:9.4.28.v20200408]
at org.eclipse.jetty.server.HttpChannel.dispatch(HttpChannel.java:547) [!/:9.4.28.v20200408]
at org.eclipse.jetty.server.HttpChannel.handle(HttpChannel.java:375) [!/:9.4.28.v20200408]
at org.eclipse.jetty.server.HttpConnection.onFillable(HttpConnection.java:273) [!/:9.4.28.v20200408]
at org.eclipse.jetty.io.AbstractConnection$ReadCallback.succeeded(AbstractConnection.java:311) [!/:9.4.28.v20200408]
at org.eclipse.jetty.io.FillInterest.fillable(FillInterest.java:103) [!/:9.4.28.v20200408]
at org.eclipse.jetty.io.ssl.SslConnection$DecryptedEndPoint.onFillable(SslConnection.java:543) [!/:9.4.28.v20200408]
at org.eclipse.jetty.io.ssl.SslConnection.onFillable(SslConnection.java:398) [!/:9.4.28.v20200408]
at org.eclipse.jetty.io.ssl.SslConnection$2.succeeded(SslConnection.java:161) [!/:9.4.28.v20200408]
at org.eclipse.jetty.io.FillInterest.fillable(FillInterest.java:103) [!/:9.4.28.v20200408]
at org.eclipse.jetty.io.ChannelEndPoint$2.run(ChannelEndPoint.java:117) [!/:9.4.28.v20200408]
at org.eclipse.jetty.util.thread.strategy.EatWhatYouKill.runTask(EatWhatYouKill.java:336) [!/:9.4.28.v20200408]
at org.eclipse.jetty.util.thread.strategy.EatWhatYouKill.doProduce(EatWhatYouKill.java:313) [!/:9.4.28.v20200408]
at org.eclipse.jetty.util.thread.strategy.EatWhatYouKill.tryProduce(EatWhatYouKill.java:171) [!/:9.4.28.v20200408]
at org.eclipse.jetty.util.thread.strategy.EatWhatYouKill.run(EatWhatYouKill.java:129) [!/:9.4.28.v20200408]
at org.eclipse.jetty.util.thread.ReservedThreadExecutor$ReservedThread.run(ReservedThreadExecutor.java:375) [!/:9.4.28.v20200408]
at org.eclipse.jetty.util.thread.QueuedThreadPool.runJob(QueuedThreadPool.java:806) [!/:9.4.28.v20200408]
at org.eclipse.jetty.util.thread.QueuedThreadPool$Runner.run(QueuedThreadPool.java:938) [!/:9.4.28.v20200408]
at java.lang.Thread.run(Thread.java:829) [?:?]
Caused by: java.net.ConnectException: Die Wartezeit für die Verbindung ist abgelaufen (Connection timed out)
at java.net.PlainSocketImpl.socketConnect(Native Method) ~[?:?]
at java.net.AbstractPlainSocketImpl.doConnect(AbstractPlainSocketImpl.java:412) ~[?:?]
at java.net.AbstractPlainSocketImpl.connectToAddress(AbstractPlainSocketImpl.java:255) ~[?:?]
at java.net.AbstractPlainSocketImpl.connect(AbstractPlainSocketImpl.java:237) ~[?:?]
at java.net.SocksSocketImpl.connect(SocksSocketImpl.java:392) ~[?:?]
at java.net.Socket.connect(Socket.java:609) ~[?:?]
at org.apache.http.conn.ssl.SSLConnectionSocketFactory.connectSocket(SSLConnectionSocketFactory.java:368) ~[!/:4.5.13]
at org.apache.http.impl.conn.DefaultHttpClientConnectionOperator.connect(DefaultHttpClientConnectionOperator.java:142) ~[!/:4.5.13]
... 130 more
2022-12-15T12:17:10,120 | DEBUG | (AbstractEventEndpoint:2524) - No events match the given filters.
2022-12-15T12:17:12,812 | DEBUG | (AbstractEventEndpoint:2524) - No events match the given filters.
2022-12-15T12:17:15,929 | DEBUG | (AbstractEventEndpoint:2524) - No events match the given filters.
2022-12-15T12:17:18,806 | DEBUG | (AbstractEventEndpoint:2524) - No events match the given filters.
Maybe this helps?
Where do I need to configure the proxy to be used by opencast? As already told, I’ve set the environment variables.
Also I did set a maven settings file which was needed to start opencast and let it download from the repositories.
<settings>
<proxies>
<proxy>
<id>Uni Proxy http</id>
<active>true</active>
<protocol>http</protocol>
<host>PROXY-IP</host>
<port>3128</port>
</proxy>
</proxies>
</settings>
Hope we will find the solution.
Kind regards
Sven
Greg Logan
Dec 17, 2022, 12:32:54 PM12/17/22
to us...@opencast.org
Hi Sven,
Ok, so we know that the underlying OS is setup right since curl works - there's some kind of system-level proxy and curl knows how to get the appropriate configuration out of the environment so that it can use it. This means that Opencast isn't, for whatever reason, picking up those settings correctly.
If I had to guess, the issue here is that the proxy environment variables aren't being passed to Opencast. Try modifying the start-opencast script and adding whatever environment variables are needed? If that resolves things, then we know it's environment related. Look for `OPTS=` at the top of the run() method, add them in there.
G
s.la...@googlemail.com
Jan 16, 2023, 6:57:58 AM1/16/23
to Opencast Users, Greg Logan
Finally I solved it.
I tried adding "-Dhttp.proxyHost=proxy.url -Dhttp.proxyPort=3128" but that didn't do the trick until I noticed it needed "-Dhttps.proxyHost=proxy.url -Dhttps.proxyPort=3128" to work succesful. It was only the small "https" - s.
Thanks for all your help, we can "close" this thread and also the one with the adopter registration via proxy.
Kind regards
Sven
Reply all
Reply to author
Forward
0 new messages