Proofs for NDVI Colormaps
420 views
Skip to first unread message

Craig Versek
May 20, 2013, 10:06:39 PM5/20/13
to Chris Fastie, Ned Horning, plots-i...@googlegroups.com
Chris, Ned, (or others),
I am looking for a simple set of images: originals and a few NDVIs with Ned's colormaps so that I can try to replicate the conversion in a simple python script. I know they must be somewhere, but I'm having trouble finding the originals. Thanks,
- Craig
I am looking for a simple set of images: originals and a few NDVIs with Ned's colormaps so that I can try to replicate the conversion in a simple python script. I know they must be somewhere, but I'm having trouble finding the originals. Thanks,
- Craig

Chris Fastie
May 20, 2013, 10:53:46 PM5/20/13
to plots-i...@googlegroups.com
Craig,
Are you looking for superblue originals? And the NDVI images derived from them? Using which one of Ned's LUTs? Will your NDVI values be scaled from -1 to +1?
Ned's colorful look up tables are not continuous gradients but have 15 or 20 classes (colors). Continuous gradients retain more detail from the original photo.
Craig Versek
May 20, 2013, 11:03:11 PM5/20/13
to Chris Fastie, plots-i...@googlegroups.com
On Mon, May 20, 2013 at 10:53 PM, Chris Fastie <cfa...@gmail.com> wrote:
Craig,Are you looking for superblue originals?
Yes.
And the NDVI images derived from them?
Yes.
Using which one of Ned's LUTs?
Whatever you guys think is currently the best for a demo webapp.
Will your NDVI values be scaled from -1 to +1?
Yes.
Ned's colorful look up tables are not continuous gradients but have 15 or 20 classes (colors). Continuous gradients retain more detail from the original photo.
Understood.
--
You received this message because you are subscribed to the Google Groups "plots-infrared" group.
To unsubscribe from this group and stop receiving emails from it, send an email to plots-infrare...@googlegroups.com.
To post to this group, send email to plots-i...@googlegroups.com.
Visit this group at http://groups.google.com/group/plots-infrared?hl=en.
Craig Versek
May 20, 2013, 11:04:32 PM5/20/13
to Chris Fastie, plots-i...@googlegroups.com
In terms of contiguous gradients what is you recommended starting place?
Jeffrey Warren
May 20, 2013, 11:42:43 PM5/20/13
to Craig Versek, Chris Fastie, plots-i...@googlegroups.com
I think an HSV color wheel (usually from blue to violet) with black instead of violet would be nice...
HSV refers to hue, saturation, value, but we're only really concerned with the outside edge of the wheel, where only hue is changing
An example of NDVI with such a wheel is here: http://publiclab.org/notes/cfastie/04-20-2013/superblue#c4585
For the wheel itself, i uploaded a PNG to this page: http://publiclab.org/wiki/ndvi-gradients
code to generate a red to green to blue wheel: http://stackoverflow.com/questions/5905129/converting-rgb-to-hsl-for-higher-resolution-c
Finally, we imagine using different gradients for different effects and analysis, so abstracting the wheel itself as an image would be cool (where the x-dimension of the image is the % value) so we could offer different gradients as options.
However, for the purposes of the quick demo, I'd just use one gradient and keep things simple -- one demo in hand is worth two in the bush, or something.
Jeff

Craig Versek
May 21, 2013, 1:38:32 AM5/21/13
to Jeffrey Warren, plots-i...@googlegroups.com
Jeff,
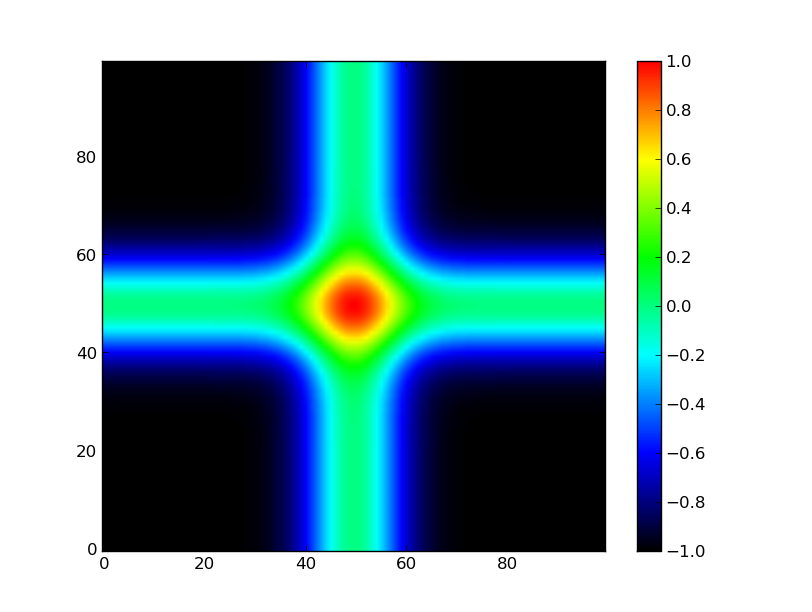
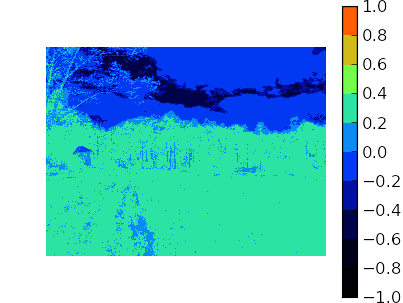
I like your aesthetic sensibilities... it took my a while to figure out how to do this in matplotlib's convoluted scheme. My weightings are a little different than your's at the top and bottom of the scale...we will see if that makes a difference or not. Here is some demo code that produces the first entirely artificial attached example.
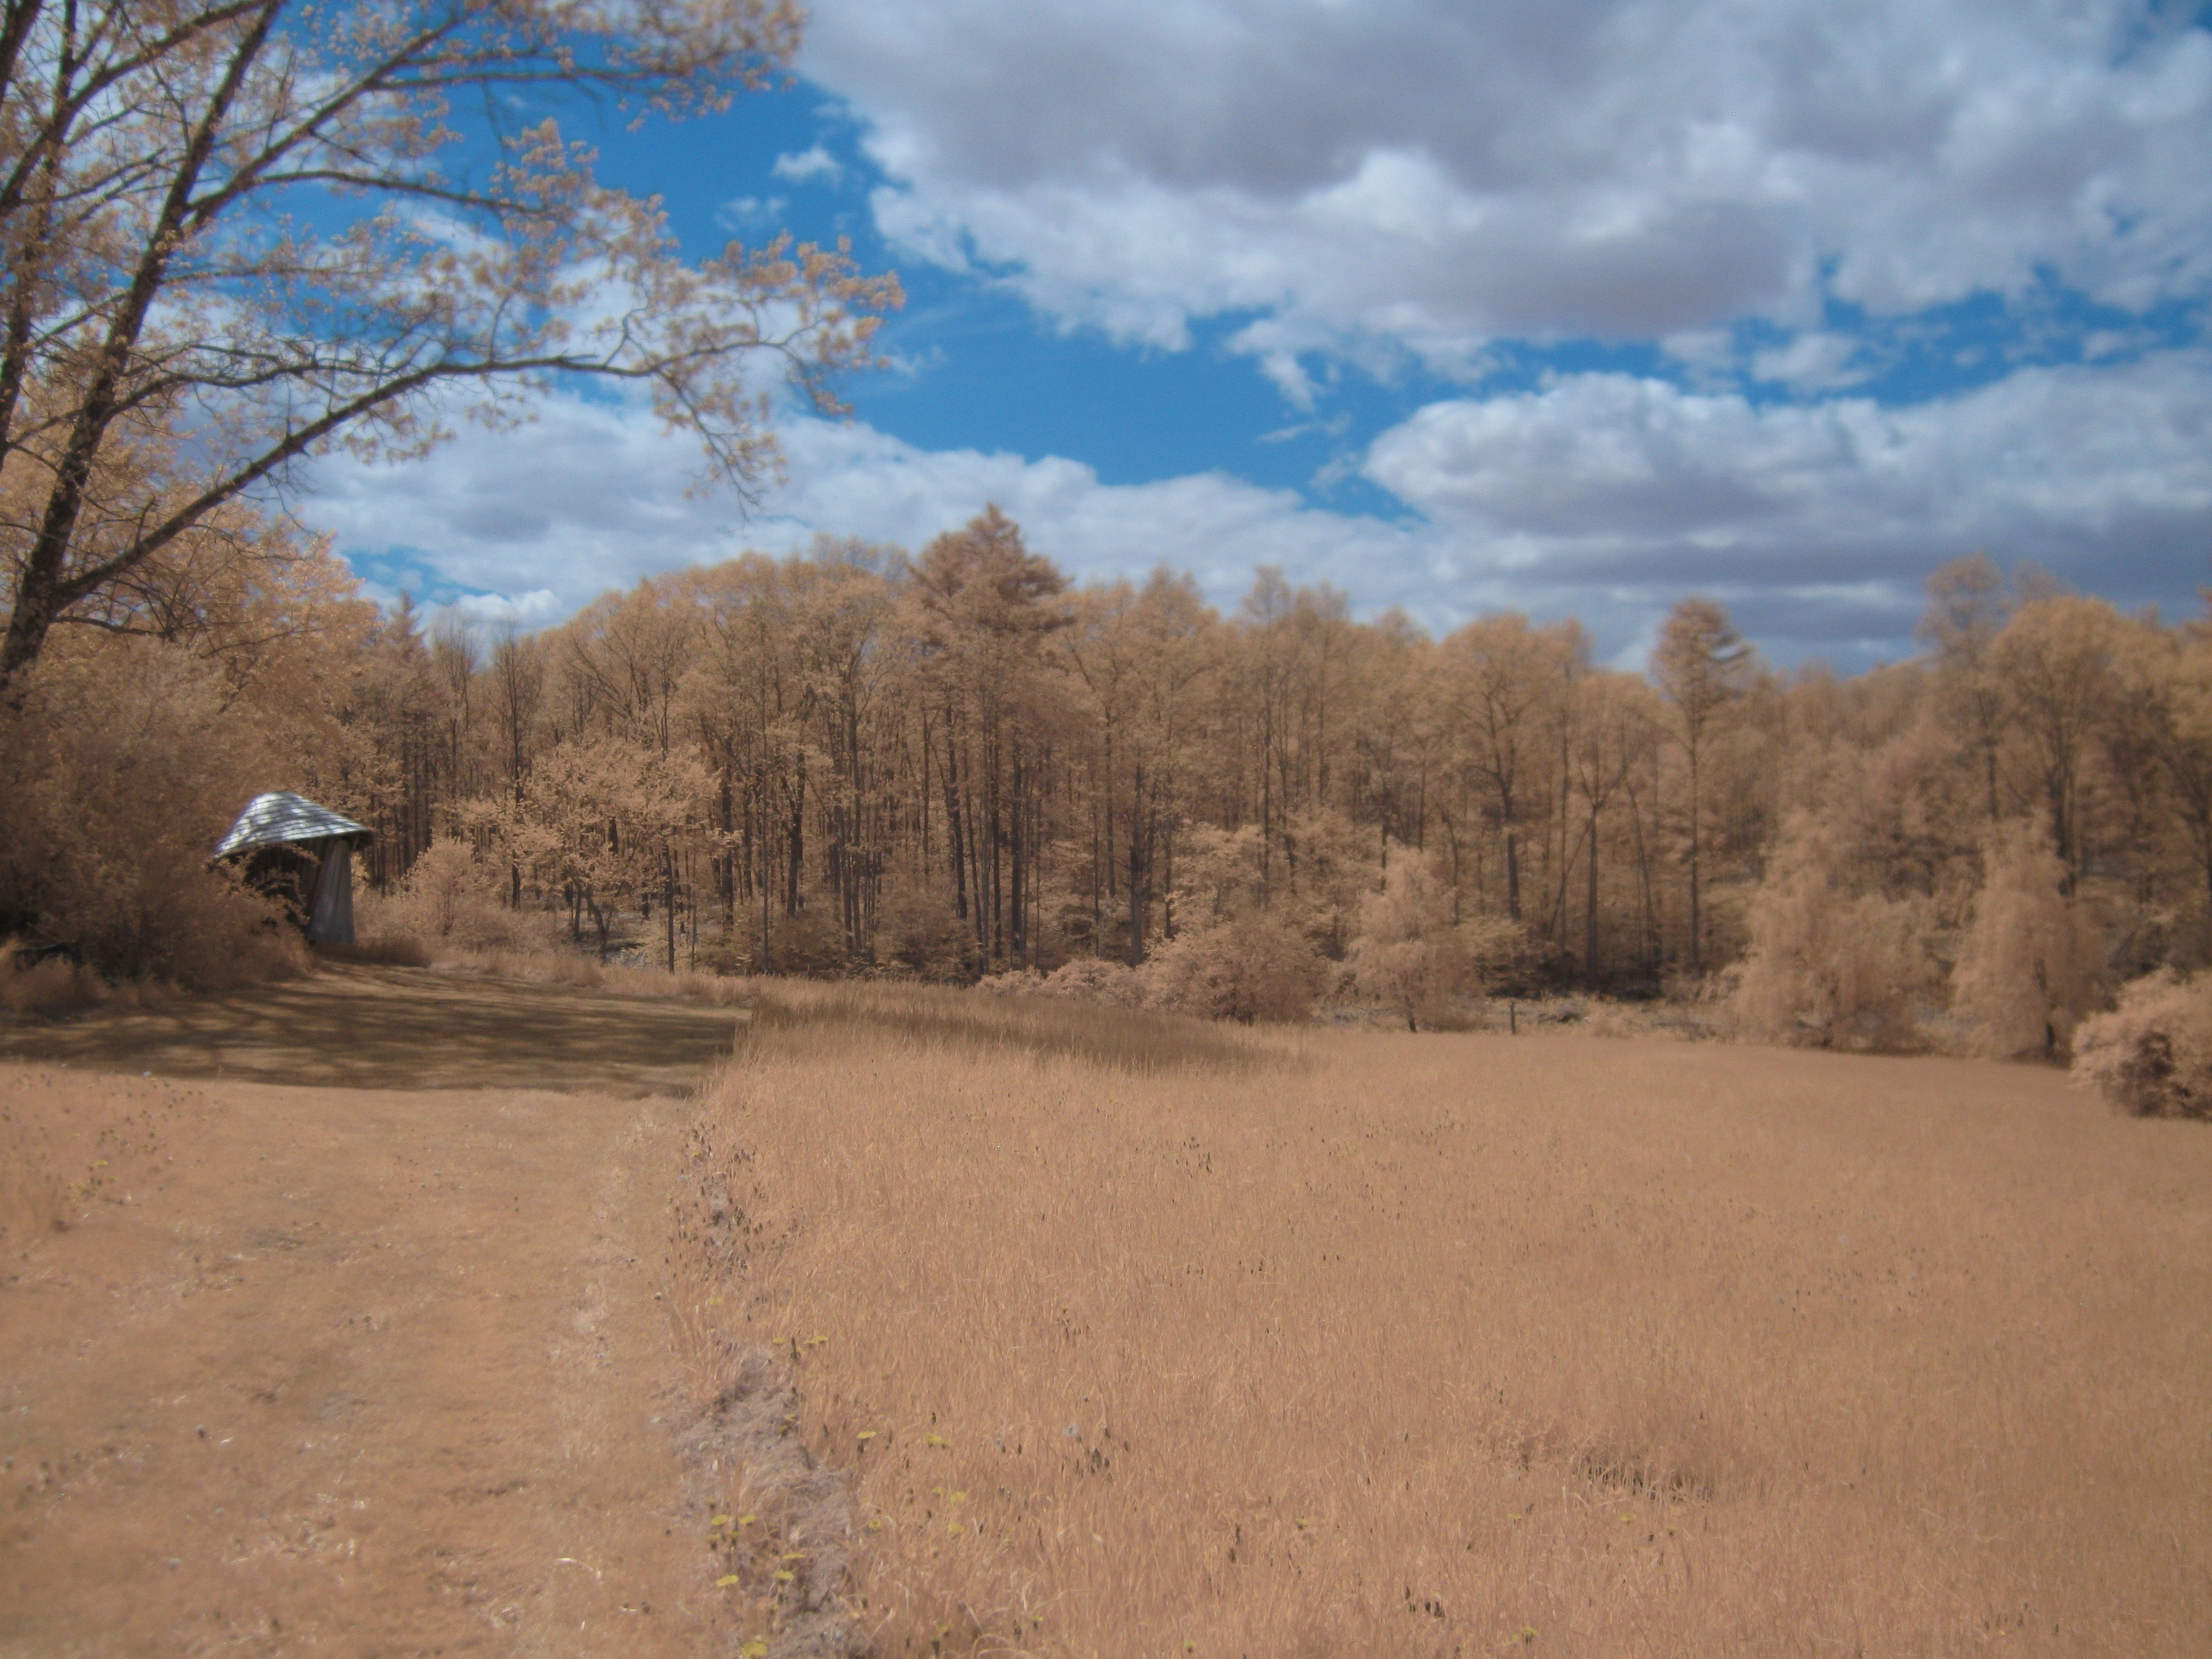
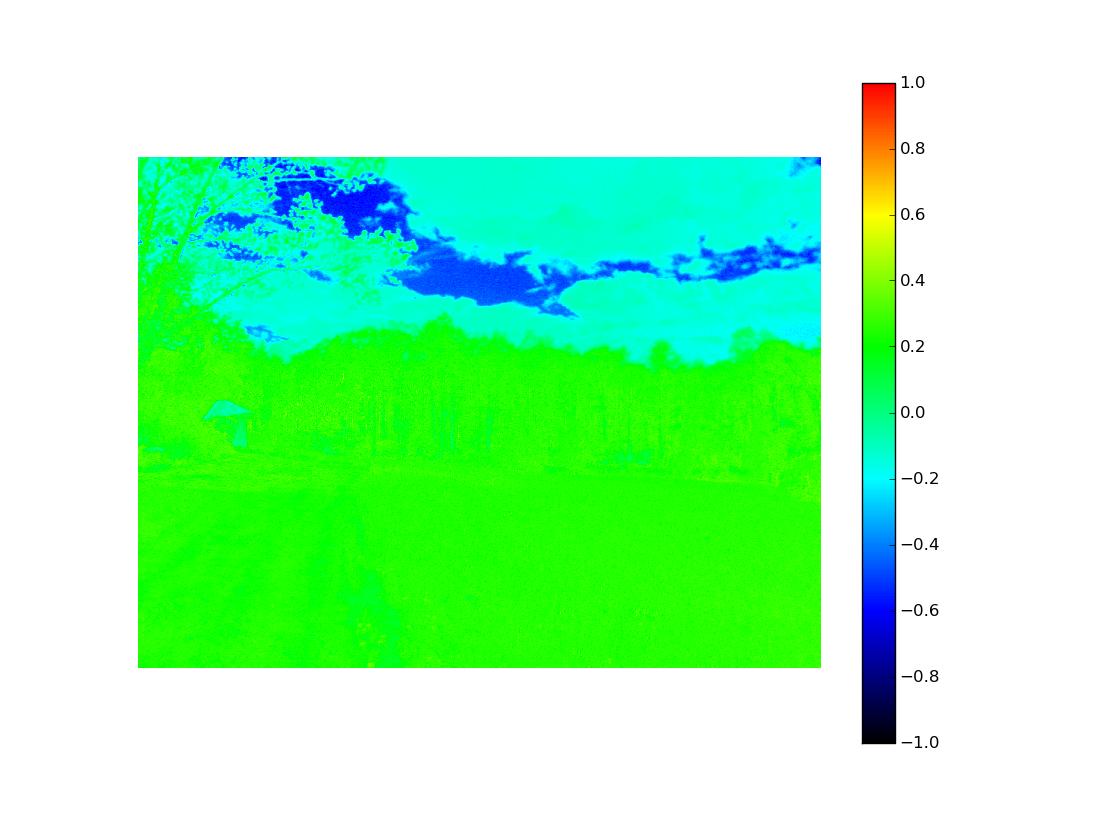
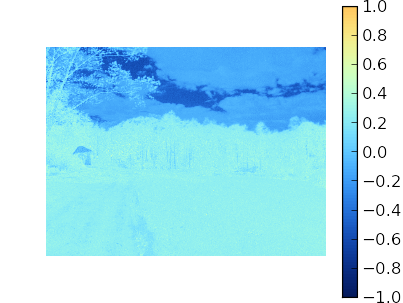
Also I've thrown up a rendered NDVI version one of your StuporBlue kite shots - I think; the lack of contrast washes out most of the detail which means we will probably have to have some tweaking factors. For a full look at all the standard matplotlib colormaps on this image download this torrent:
magnet:?xt=urn:btih:8dacc676d96b1ba63e02c27765e7f18a71415915&dn=cmaps-test
- Craig
Craig Versek
May 21, 2013, 1:40:23 AM5/21/13
to Jeffrey Warren, plots-i...@googlegroups.com
...and yes matplotlib has the annoying tendency to lower the image resolution and put a bunch of margin space in this plotting mode and I haven't yet figured out how to get it to use the whole figure at full res.

Ned Horning
May 21, 2013, 8:08:43 AM5/21/13
to plots-i...@googlegroups.com
Just for clarification, there is a
continuous LUT with the photo monitoring plugin but it's pretty
dull. ImageJ/Fiji also has a few continuous LUTs including one
called Rainbow. It's easy to create a new LUT and I'm happy to do
that if someone give me colors (preferably RGB values) for each
pixel values from 0 - 255 or at least some samples along that
gradient that I can interpolate. The LUTs I've implemented are my
interpretation of the (more or less) standard NDVI LUTs but they
often don't work well with landscape shots. I am lacking in
aesthetic sensibilities but can add color tables to the plugin is
that's helpful.
A good place to get ideas for color schemes is the COLORBREWER web site - http://colorbrewer2.org/. They use color classes since it's geared toward map classification schemes but it's easy to interpolate between the colors to make it a gradient.
Ned
A good place to get ideas for color schemes is the COLORBREWER web site - http://colorbrewer2.org/. They use color classes since it's geared toward map classification schemes but it's easy to interpolate between the colors to make it a gradient.
Ned
Chris Fastie
May 21, 2013, 8:44:41 AM5/21/13
to plots-i...@googlegroups.com
Craig, see if this magnet works. It is a directory with a half dozen superblue kite images and the resulting NDVI using Ned's ndviClassesCB_-1_1 lookup table:
magnet:?xt=urn:btih:60EF2336E44F1B6DA08F48AF68685BB022E5C573&dn=7-1%2b1cb-1%2b1&tr=udp%3a%2f%2ftracker.openbittorrent.com%3a80%2fannounce&tr=udp%3a%2f%2ftracker.publicbt.com%3a80%2fannounce&tr=udp%3a%2f%2ftracker.ccc.de%3a80%2fannounce
Craig Versek
May 21, 2013, 2:16:30 PM5/21/13
to Chris Fastie, plots-i...@googlegroups.com
Thanks Chris, but I never was able to get that torrent started. Did you leave your client running?
On Tue, May 21, 2013 at 8:44 AM, Chris Fastie <cfa...@gmail.com> wrote:
Craig, see if this magnet works. It is a directory with a half dozen superblue kite images and the resulting NDVI using Ned's ndviClassesCB_-1_1 lookup table:magnet:?xt=urn:btih:60EF2336E44F1B6DA08F48AF68685BB022E5C573&dn=7-1%2b1cb-1%2b1&tr=udp%3a%2f%2ftracker.openbittorrent.com%3a80%2fannounce&tr=udp%3a%2f%2ftracker.publicbt.com%3a80%2fannounce&tr=udp%3a%2f%2ftracker.ccc.de%3a80%2fannounce
Craig Versek
May 21, 2013, 3:46:53 PM5/21/13
to Don Blair, Jeffrey Warren, Mathew Lippincott, plots-i...@googlegroups.com
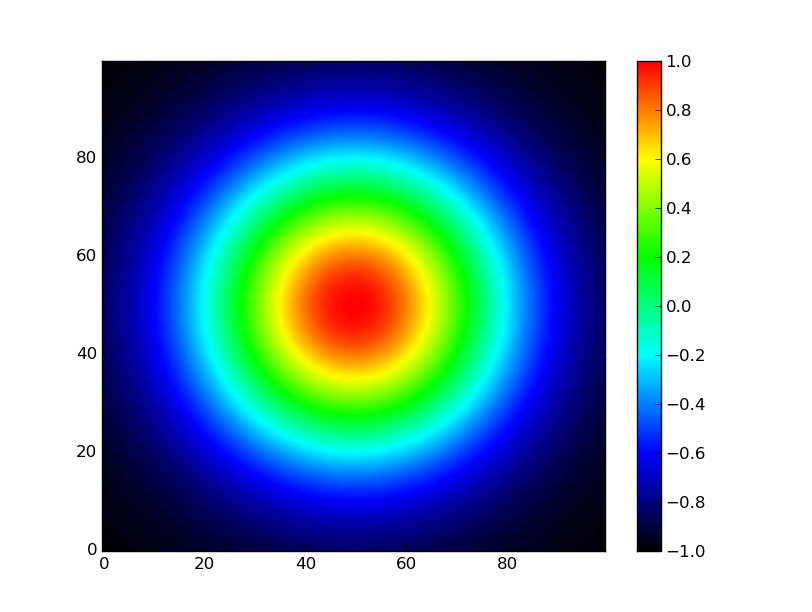
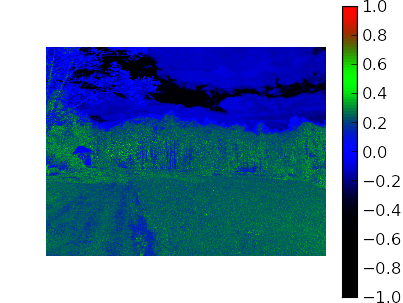
Hmm, I think I'm slowly getting better at this. The reason why the last picture sucked was because there was no variation in the color in certain bands of NDVI values. This gave me the idea to try to generate the cmaps using more complicated functions than lines and plateaus. The idea of a gaussian peak with a bandwith and variable center location on the NDVI range for each color channel R,G,B particularly appeals to me. The result is a highly tunable colormap generating function that can accentuate and wash out detail based on Jeff's aesthetic idea - it can also be discretized (made into less color classes). Here are a few examples with some parameter variations.
Craig Versek
May 21, 2013, 4:00:00 PM5/21/13
to Don Blair, Jeffrey Warren, Mathew Lippincott, plots-i...@googlegroups.com
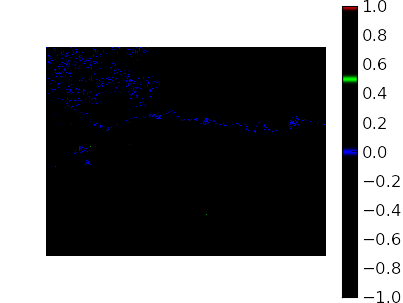
Here is taking the bandwidth to the narrow extreme... its a spectrograph! I am thinking a webapp with sliders that control these parameters might be a real neat tool to help with NDVI image processing for presentation and maybe even image segmentation.
Reply all
Reply to author
Forward
0 new messages