dodged geom_bar labels
Alexander Shenkin
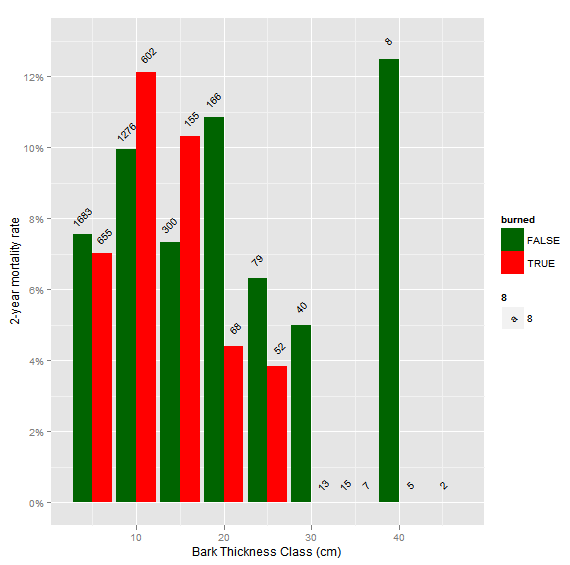
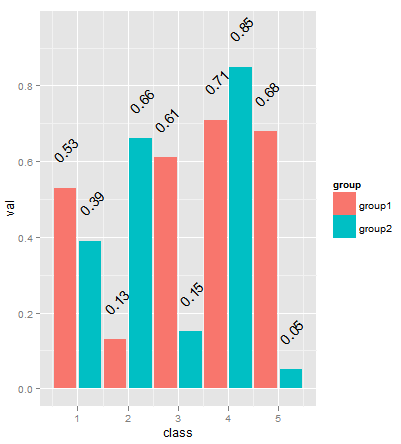
I have most of this working, but a weirdness occurs when I paste labels. In that case, it seems the order of the dodging gets screwy. See below for what is happening. Notice that, in the second plot the bar labels seem to get their dodging reversed at some point.
A secondary question is how to change the legend for the bar labels...
Any thoughts are greatly appreciated!
Thanks,
Allie
ggplot(data = bark_mort_tab, aes(x=bark_t_class, y=mort23.mean, fill=burned)) +
geom_bar(stat="identity", position="dodge") + scale_fill_manual(values=c("darkgreen","red")) +
geom_text(aes(label=mort23.nobs, y=mort23.mean+0.005, size=8), angle=45, position = position_dodge(width=bark_class_width)) +
ylab("2-year mortality rate") + xlab("Bark Thickness Class (cm)") + scale_y_continuous(labels=percent)

ggplot(data = bark_mort_tab, aes(x=bark_t_class, y=mort23.mean, fill=burned)) +
geom_bar(stat="identity", position="dodge") + scale_fill_manual(values=c("darkgreen","red")) +
geom_text(aes(label=bar_labels, y=mort23.mean+0.005, size=8), angle=45, position = position_dodge(width=bark_class_width)) +
ylab("2-year mortality rate") + xlab("Bark Thickness Class (cm)") + scale_y_continuous(labels=percent)

> bark_mort_tab
   bark_t_class burned mort23.mean mort23.nobs mort23.sum bar_labels
1             5  FALSE  0.07546049        1683        127   127/1683
2             5   TRUE  0.07022901         655         46     46/655
3            10  FALSE  0.09952978        1276        127   127/1276
4            10   TRUE  0.12126246         602         73     73/602
5            15  FALSE  0.07333333         300         22     22/300
6            15   TRUE  0.10322581         155         16     16/155
7            20  FALSE  0.10843373         166         18     18/166
8            20   TRUE  0.04411765          68          3       3/68
9            25  FALSE  0.06329114          79          5       5/79
10           25   TRUE  0.03846154          52          2       2/52
11           30  FALSE  0.05000000          40          2       2/40
12           30   TRUE  0.00000000          13          0       0/13
13           35  FALSE  0.00000000          15          0       0/15
14           35   TRUE  0.00000000           7          0        0/7
15           40  FALSE  0.12500000           8          1        1/8
16           40   TRUE  0.00000000           5          0        0/5
17           45  FALSE  0.00000000           2          0        0/2
Alexander Shenkin
Thanks,
Allie
df = data.frame(class = c(1,1,2,2,3,3,4,4,5,5), val = round(runif(10),2), group = c("group1", "group2"))
df$text_labels = as.character(sprintf("%2.2f", df$val))
# labels correctly
ggplot(data = df, aes(x=class, y=val, fill=group)) + geom_bar(stat="identity", position=position_dodge(width=1)) +
geom_text(aes(label = val, y = val + 0.1), angle = 45, position = position_dodge(width=1))

# labels incorrectly
ggplot(data = df, aes(x=class, y=val, fill=group)) + geom_bar(stat="identity", position=position_dodge(width=1)) +
geom_text(aes(label = text_labels, y = val + 0.1), angle = 45, position = position_dodge(width=1))

--
You received this message because you are subscribed to the ggplot2 mailing list.
Please provide a reproducible example: http://gist.github.com/270442
To post: email ggp...@googlegroups.com
To unsubscribe: email ggplot2+u...@googlegroups.com
More options: http://groups.google.com/group/ggplot2
Winston Chang
Kohske Takahashi
Try to give a group explicitly:
ggplot(data = df, aes(x=class, y=val, fill=group)) +
geom_bar(stat="identity", position=position_dodge(width=1)) +
geom_text(aes(label = text_labels, y = val + 0.1, group = group),
angle = 45, alpha = 0.5, position = position_dodge(width=1))
I'm not sure but probably the text labels are ordered by their value
unless explicit group variable is defined.
kohske
2012年4月4日0:57 Winston Chang <winsto...@gmail.com>:
> --
> You received this message because you are subscribed to the ggplot2 mailing
> list.
> Please provide a reproducible example: http://gist.github.com/270442
>
> To post: email ggp...@googlegroups.com
> To unsubscribe: email ggplot2+u...@googlegroups.com
> More options: http://groups.google.com/group/ggplot2
--
--
Kohske Takahashi <takahash...@gmail.com>
Research Center for Advanced Science and Technology,
The University of Tokyo, Japan.
http://www.fennel.rcast.u-tokyo.ac.jp/profilee_ktakahashi.html
