Dot plots and violin plots
99 views
Skip to first unread message
Winston Chang
Dec 11, 2011, 4:16:21 PM12/11/11
to ggplot2
Hi everyone -
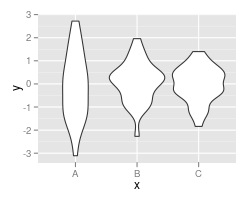
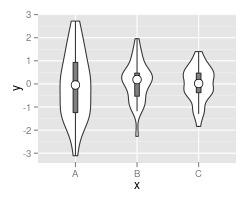
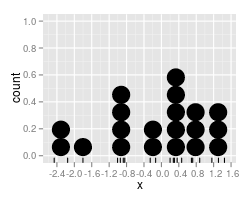
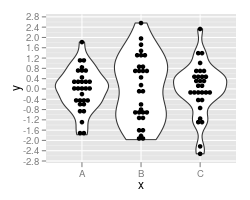
I've recently implemented violin plots and dot plots for ggplot2. Here's a sampling of what you can do with them:


For more information, see:
If you want to try them out, you can install this development branch without interfering with your regular installation of ggplot2:
install.packages("devtools")
library(devtools)dev_mode()
install_github("ggplot2", "wch", "feature/wdotplot")
In each R session where you want to use this version, just run:
library(devtools)
dev_mode()
library(ggplot2)
To use your regular ggplot2 installation, just restart R.
I'm still working on these things, so keep in mind that they may change (and break) in the near future.
Feedback is welcome!
-Winston
Reply all
Reply to author
Forward
0 new messages
