Issues with Facetgrid.pcolormesh subplot kws inputs
102 views
Skip to first unread message

Jenna Pearson
Sep 29, 2020, 2:18:41 PM9/29/20
to xarray
Hello, I am finding some issues using arrays Facetgric.pcolormesh to plot sea level anomaly climatologies. I wanted to include a land mask in my plots and have found small problems with x/ylabels that I cannot seem to fix. I would also appreciate any other tips you have, as I am new to python and Xarray.
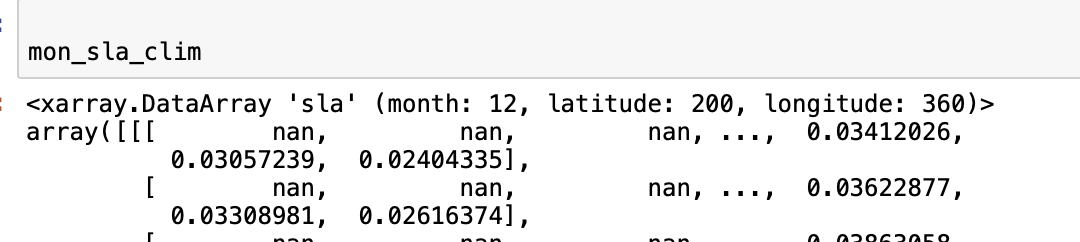
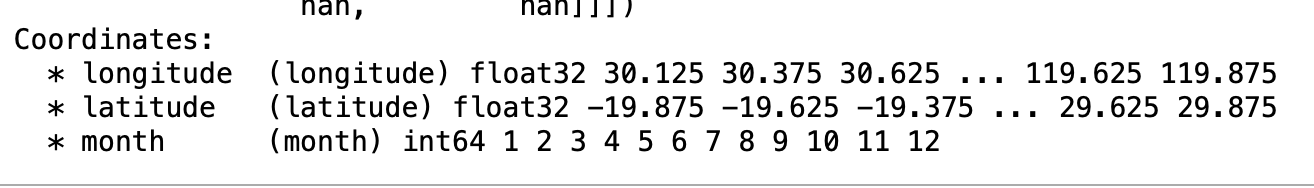
First, here is a snippet of the array I am plotting.
...
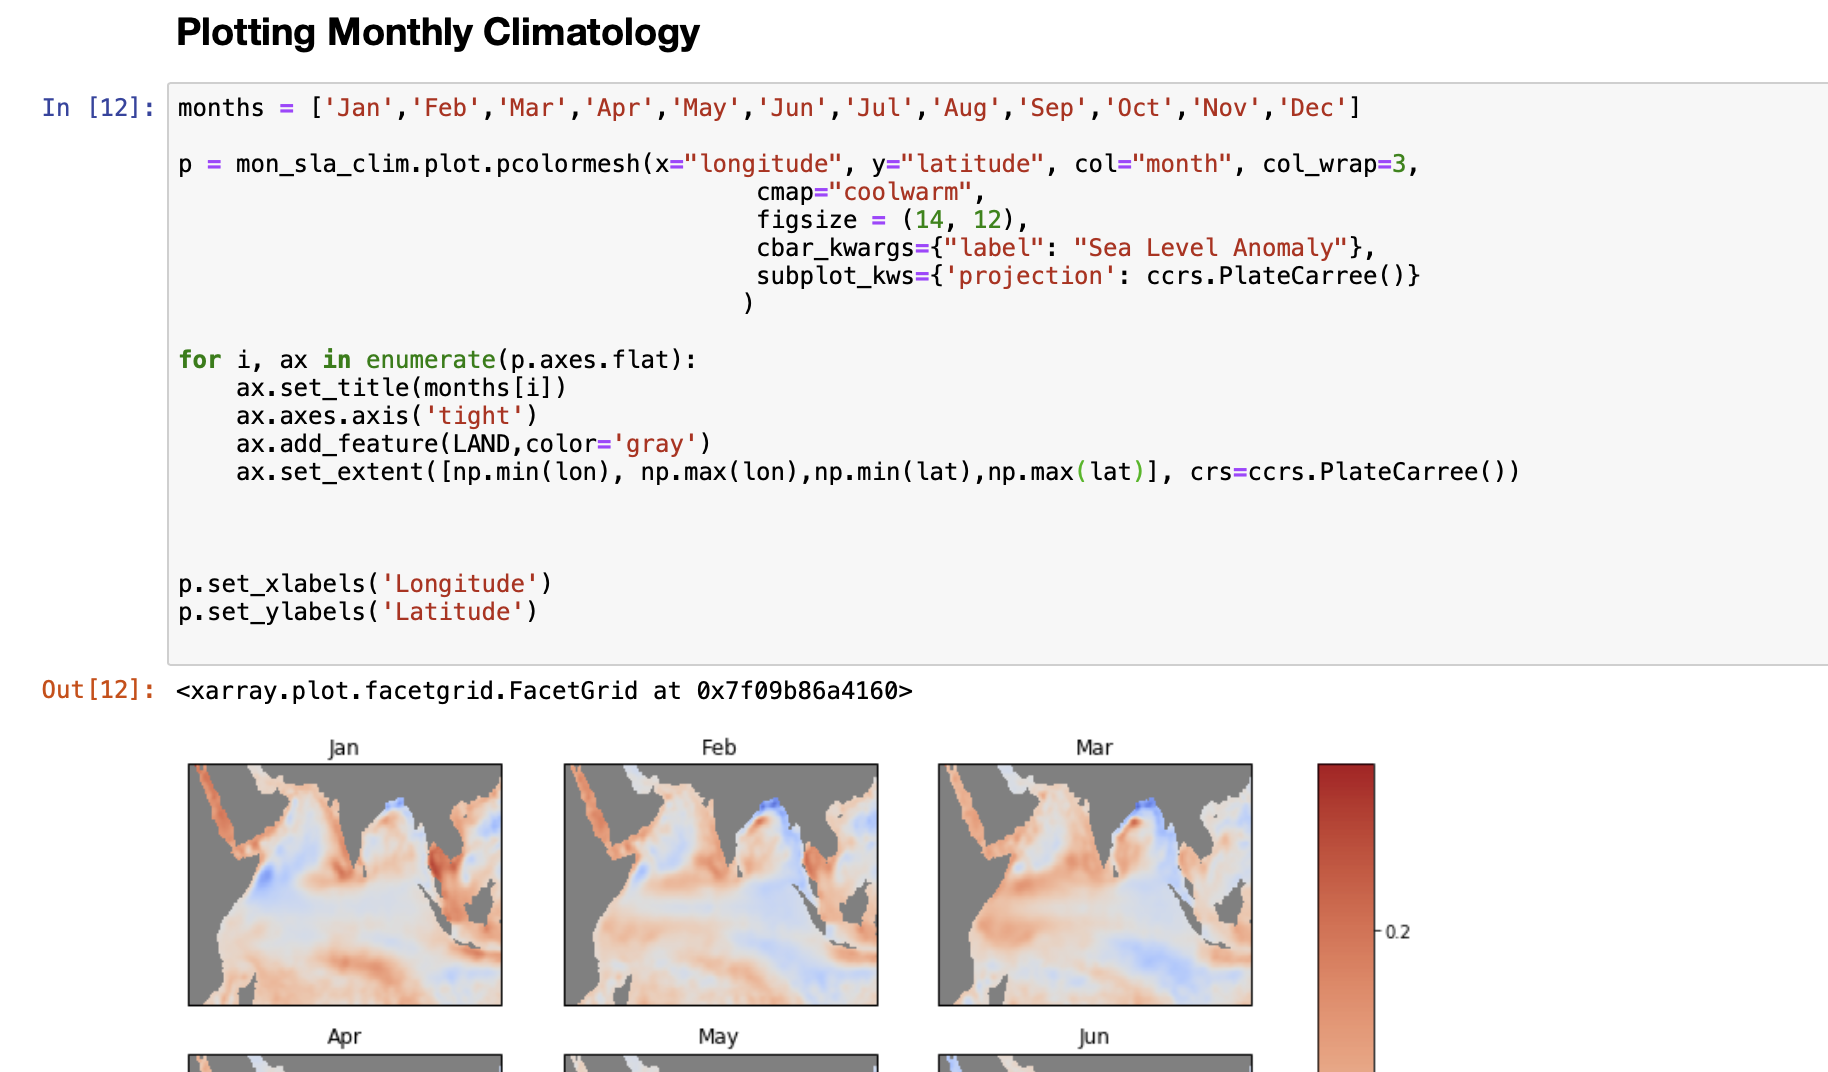
When I include a transform argument, it removes all the x and y labels, and even if I put in arguments to set each axes in the loop below, or use the set_xlabels call at the end of my plot it will not include them again. All of the examples I can seem to find online also have them removed. Do I need to set a grid or something? With non-array plotting I have not had to do this in the past. Here is an example of code used where I set them after.
I appreciate any help you can provide!

Mathias Hauser
Sep 29, 2020, 2:30:39 PM9/29/20
to xar...@googlegroups.com
As far as I know cartopy axes do not allow to add x- and y-labels directly (or it at least makes it more difficult); see this stackoverflow question: https://stackoverflow.com/questions/35479508
> With non-array plotting I have not had to do this in the past.
How do you add the x-/ y-labels outside of xarray?
--
You received this message because you are subscribed to the Google Groups "xarray" group.
To unsubscribe from this group and stop receiving emails from it, send an email to xarray+un...@googlegroups.com.
To view this discussion on the web visit https://groups.google.com/d/msgid/xarray/a6b20204-a7cf-4f40-9785-64998f93393bn%40googlegroups.com.
Jenna Pearson
Sep 29, 2020, 3:46:51 PM9/29/20
to xarray
Hi Mathias,
Thank you for your reply! I did not realize that was a limitation of Cartopy to begin with....I actually just ended up changing the facecolor of my subplots as a quick fix, and I suppose I will keep that given your linked question!
Reply all
Reply to author
Forward
0 new messages