breach_depressions_least_cost(fill = TRUE) unexpectedly fills neighbouring watersheds
561 views
Skip to first unread message

Hugh Allan
Oct 6, 2021, 12:38:16 AM10/6/21
to WhiteboxTools
Hi All,
I am using R's frontend for _WhiteBox Tools_, the `whitebox` package. Firstly, I have to say this is a great package that has many great functionalities that are otherwise unavailable or more complicated in R, so thank you for all your time and hard work!
Ultimately, I am interested in extracting streams and catchment sizes/areas, so my workflow looks like: _import dem > fill single cell pits > breach depressions > flow accumulation and pointer grids > extract streams > extract watersheds_. I'm following a tutorial from Chapters 15 and 16 here.
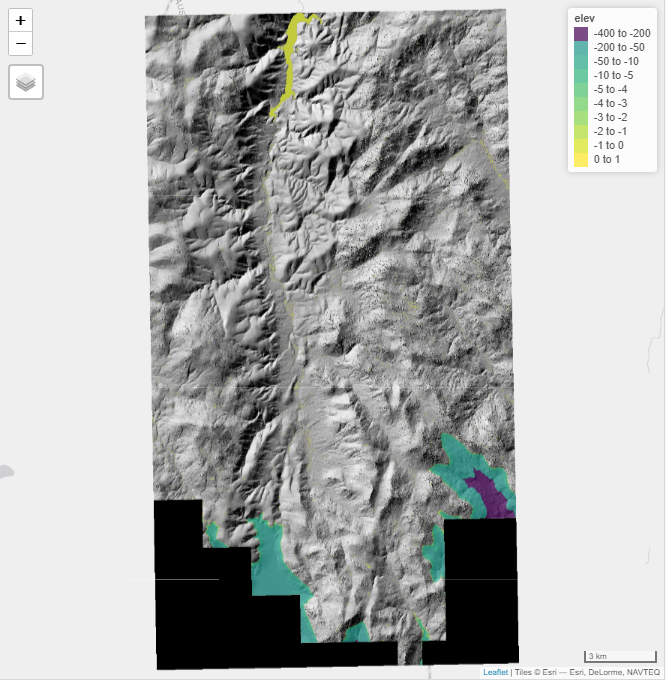
I'm getting unexpected results from the `wbt_breach_depressions_least_cost()` function. Basically, my dem has one main watershed (watershed 1) plus the headwaters of another (watershed 2) near the edge of the dem. When I run `wbt_breach_depressions_least_cost(.., dist = 5)` the headwaters of watershed 2 are filled (large areas, several kilometres across), so the resulting output incorrectly drains watershed 2 into watershed 1 - see image below. Problem area is at the bottom of the image; turquoise and purple indicate filling of up to 400 m (vertical) of watershed 2.
It seems the default inclusion of `fill = TRUE` causes this issue, I guess because the function incorrectly assumes watershed 2 is a depression which needs filling. So if I override defaults and run `wbt_breach_depressions_least_cost(..., fill = FALSE)` the filling doesn't occur, as expected. However, the resulting dem has depressions in watershed 1 which preclude the calculation of flow accumulation grids and subsequent stream extraction.
So my next thought was, what if I use `wbt_breach_depressions_least_cost(..., fill = FALSE)`, and then I fill in depressions using `wbt_fill_depressions(..., max_depth = my_depth)`. However, after trying values for `max_depth` of 0.1, 5, and NULL (default), this seems to fill the entire dem in and completely reshapes the catchment (and all 3 values produce an almost identical output).
So in summary my main questions are:
- Are there parameters in `wbt_breach_depressions_least_cost()` that can prevent watershed 2 from being filled? It sounds like `max_cost` and `fill` parameters might do this; the WhiteboxTools manual mentions situations such as a large open mine pit which are unsuitable for breaching - but I suspect in this hypothetical example the mine pit is to be filled, unlike my watershed 2.
- What might be some appropriate values to use as `max_depth` in `wbt_fill_depressions()` to fill in only small depressions?
- Are there other method(s) that could be a solution to this situation?
Thanks for the help team
Hugh Allan
Oct 7, 2021, 5:40:56 PM10/7/21
to WhiteboxTools
Sorry for the formatting, I thought it was going to adhere to markdown syntax but instead we get the raw version.

Jean-François Bourdon
Oct 12, 2021, 4:26:07 PM10/12/21
to WhiteboxTools
One issue I see is that your `dist` value seems a bit low for me, at least if your DEM is at 1 m resolution (the `dist` parameter is in pixel and not unit of distance) as it doesn't give a lot of chances for a solution if a stream needs to cross a road for example. If your DEM is at 5 m resolution, then it may be more appropriate. We are using a value of 50 with a 1 m DEM for our current process.
To resolve the remaining pits after the Breach Depressions Least Cost pass, I suggest running Breach Depressions instead of Fill Depressions. It will only touch the remaining pits and make sure that the water can flow downstream without bringing (too much) water from your other watersheds.
Hugh Allan
Oct 13, 2021, 11:48:11 PM10/13/21
to WhiteboxTools
To clarify, yes I am using a DEM with resolution 1 m. I have reprocessed the data this morning, and using `dist = 50` along with `fill = FALSE` does ultimately result in the expected stream networks, so that's great - thanks Jean.
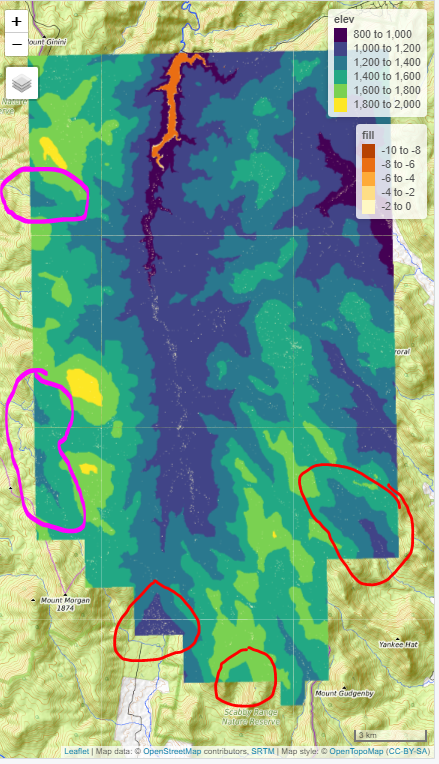
Since the first post, I have also been able to use `wbt_fill_depressions()` using `max_depth` values of 20, 200, 500 and 1000 with success too. Obviously this is slightly different to filling and breaching, but may still be suitable in some instances. Surprisingly, even with `max_fill` set to 500 and 1000, the neighbouring watersheds were not filled in. This was unexpected, as I thought this might have been the process by which the default `wbt_breach_depression_least_cost(..., fill = TRUE)` was filling them in. For example, in the image below is the result of `max_depth = 1000`. I would expect the red and pink circled areas to fill, especially those in red as these were among those filled in the original post. I am trying to avoid these being filled anyway, so this is not a problem, but I thought it might have helped narrow down the reason for the filling in the first instance. The orange filled area at the top of the image is a reservoir, which was filled as expected (vertical filling approx 8 m).
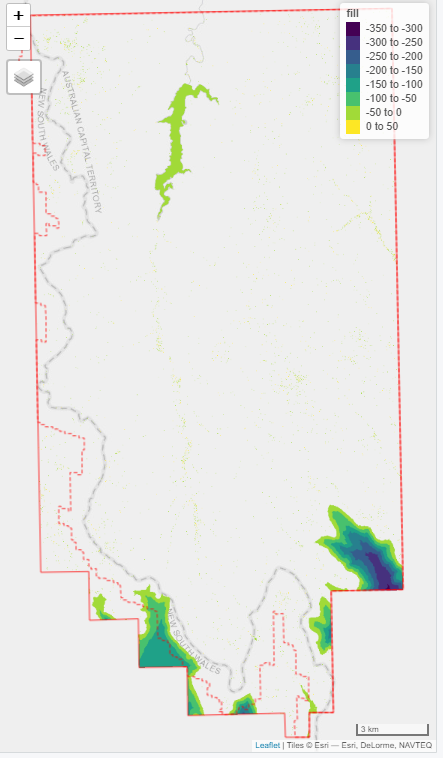
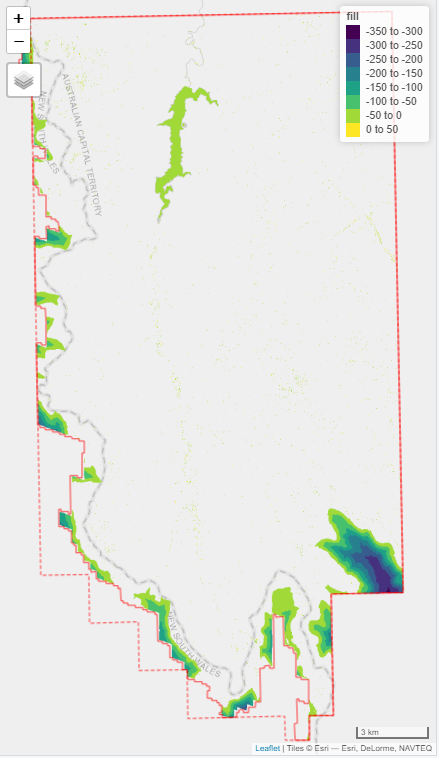
Additionally, when using `wbt_breach_depression_least_cost(..., fill = TRUE)` I have noticed different filling behaviour depending on the extent of the raster being breached, specifically the amount of the neighbouring watershed included in the raster. When more of the neighbouring watershed is included filling doesn't occur, but when only a small amount is included (smaller raster) filling occurs. For example, consider the two images below. Image on the left shows the same filling as the original post; several neighbouring watersheds are filled at the bottom of the image. Image on the right is the filled parts of a raster with an extent slightly smaller than the original (solid red line in right image, dashed red line in left image). Notice now that smaller parts of neighbouring watersheds are on the edge of the raster, more places get filled. FYI the grey dashed line is the jurisdictional boundary, and is also the watershed boundary; the outline of the raster on the right was determined from a buffer zone of approx 750 m around the watershed boundary.
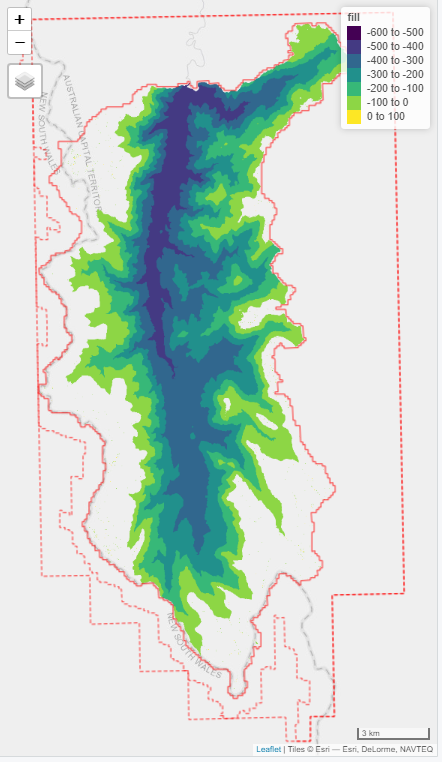
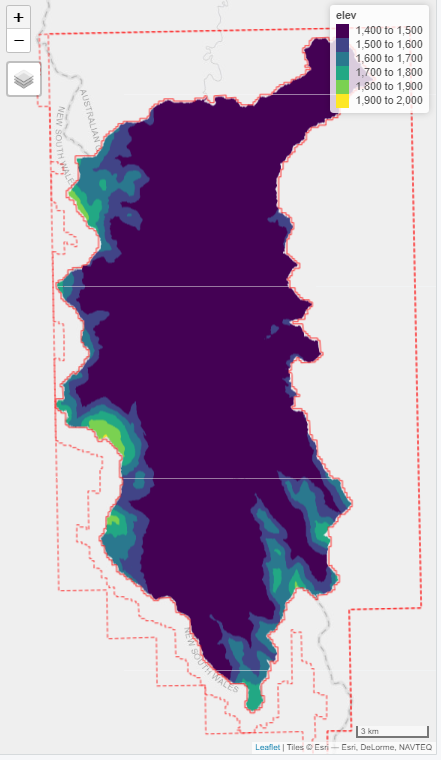
Furthering this, when the raster only covers the exact area of the watershed, `wbt_breach_depressions_least_cost()` fills in all of the lower lying areas of the whole catchment! It looks like it forces the outlet point to the top right of the raster; see images below. Dashed lines are boundaries of the above examples, solid red line is the boundary of this raster (watershed boundary). Left image shows that a much larger area has been filled! Image on the right is the resulting DEM, coloured by elevation (compare this to original DEM above with topo basemaps and red & pink circles - very very different!).
Although we can avoid this behaviour using `fill = FALSE`, I am interested to see if other people have experienced this same behaviour. Given that `fill = TRUE` is the default inclusion in `wbt_breach_depressions_least_cost()`, I'm wondering if my examples are different to what this is intended for, or if there's something else going on that I don't know about. Hopefully someone finds these examples useful.
Jean-François Bourdon
Oct 17, 2021, 4:55:09 PM10/17/21
to WhiteboxTools
The different filling behaviour depending on the extent is propably just because the iterative nature of the breaching process. The extents being different, when WBT scan for pit cells to breach, it's very likely that the first cell it will try to breach won't be the same in both cases which will inevitably have an impact on other nearby pit cells. In fact, any difference in the sequence of pit cells to breach may have an impact on the solution found for next cells in line. The filling process itseft should not be affected by the extent, only by the breaching procedure occuring before.
I can't explain your last example with the complete filling of the watershed. It's as if almost no cells have been breached and that the exterior NoData north of the valley could not be reached. I would need your DEM and exact parameters to dig into that.
As for the `fill = TRUE` being the default... well that's both currently true and false. When calling WBT in command-line, both `fill` and `min_dist` are set to FALSE if not explicitly specified as TRUE, but with the Python and R frontend, those parameters are instead set to TRUE unless specified as FALSE. See my PR: https://github.com/jblindsay/whitebox-tools/pull/194
Hugh Allan
Oct 28, 2021, 11:11:02 PM10/28/21
to WhiteboxTools
Thanks for the info, the different starting cell makes sense as to why different results might be seen from different DEMs. Regarding `fill = TRUE`, I see it's just an R and Python thing. This makes a bit more sense, and I'll be steering towards adding `fill = FALSE` in future.
If you are interested in the complete watershed filling, the DEM I used can be downloaded from my Google Drive here (700 mb). The DEM has resolution of 1 m, and interestingly when I aggregated to 100 m resolution (thinking it would be easier to share) the complete filling did not occur (with `dist = 2`). Please don't worry about this for my sake, as I know now to include `fill = FALSE`. I have also seen this issue come up recently on GIS StackExchange here.
Thanks for the help Jean
If you're interested, my R code is as follows
```
library(tidyverse)
library(terra)
library(tmap)
tmap_mode('view')
# import original dem
rast('testing_1/20211012_upper_cotter_catchment.tif') %>%
{. ->> dem_3}
# fill singles
wbt_fill_single_cell_pits(
dem = 'testing_1/20211012_upper_cotter_catchment.tif',
output = 'testing_1/t3_3_1.tif'
)
# breach depressions
wbt_breach_depressions_least_cost(
dem = 'testing_1/t3_3_1.tif',
output = 'testing_1/t3_3_2.tif',
dist = 50
)
# import filled & breached dem
rast('testing_1/t3_3_2.tif') %>%
{. ->> t3_3}
# calculate differences
diff_3 <- dem_3 - t3_3
# reclassify (make 0s NAs)
classify(diff_3, cbind(0, 0, NA), right = NA) %>%
{. ->> diff_3_a}
# change name of layer to 'fill'
diff_3_a %>%
`names<-`('fill') %>%
{. ->> diff_3_b}
# map both rasters
tm_shape(diff_3_b)+
tm_raster(alpha = 0.5)+
tm_shape(dem_3)+
tm_raster(alpha = 0.5, palette = 'viridis')
```
Reply all
Reply to author
Forward
0 new messages