3-hours wfrog rendering with sqlite3
41 views
Skip to first unread message

PK
Oct 20, 2014, 2:47:06 PM10/20/14
to wfrog...@googlegroups.com
Hi,
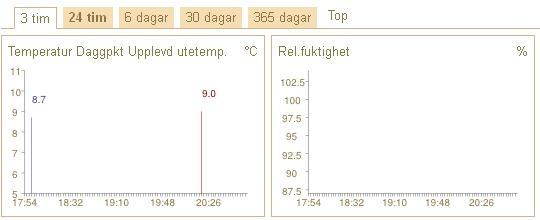
I have recently updated my Raspberry Pi with Raspbian (Linux 3.12.28+) to sqlite3 (3.17.13) with my fairly patched wfrog installatioin and it works fine - Except för rendering 3-hours diagrams where only rain diagram is rendered ok.
On temperatures only min and max point is shown, and on wind only max point is shown - that is no curves.
The values are there, as can be seen under the "Tabell" button.
You can study it here: http://www.pk2.se/wfrog/3hours.php#obs
Anyone has a clue where to look for curing this?
Thanks in advance.

Jordi Puigsegur Figueras
Oct 21, 2014, 3:47:25 PM10/21/14
to wfrog...@googlegroups.com
Did you change the config files (i.e. chart_accumulator, etc.). Maybe you can post the config files that you have modified?
Jordi.
--
You received this message because you are subscribed to the Google Groups "wfrog-users" group.
To unsubscribe from this group and stop receiving emails from it, send an email to wfrog-users...@googlegroups.com.
For more options, visit https://groups.google.com/d/optout.
PK
Oct 25, 2014, 3:05:27 PM10/25/14
to wfrog...@googlegroups.com
Hello
The 3-hours values are there, as can be seen in the 3-hours table view (click Tabell, info button).
Moreover, the config files are not changed from the earlier state with mysql database.
Anyway, I am very grateful if you would like to look into config files you mention, see attached zip file wfrog-pk2-se.zip and 3-hours partial image.
Thanks in advance
Reply all
Reply to author
Forward
0 new messages