INP on static pages?
391 views
Skip to first unread message

Terence Eden
Jul 11, 2023, 9:06:49 AM7/11/23
to web-vitals-feedback
I understand that INP looks at the latency of user interactions with a page.
A lot of my pages are rated "amber" with a time of 230 ms.
But my pages have no interactive content. I run a WordPress blog - https://shkspr.mobi/ - there are no interactive widgets, no shopping baskets, nothing which requires visual feedback. Just text and images - all fairly heavily cached.
For example, one of the pages Web Vitals reports on is https://shkspr.mobi/blog/tag/emoji/ - it's literally just a list of posts.
What is INP actually measuring on this page?

Michal Mocny
Jul 11, 2023, 9:29:21 AM7/11/23
to Terence Eden, web-vitals-feedback
Interacting with an <a href=>, <button>, or <form> elements are all very important interactions that also get measured. Even if you don't attach custom JavaScript event handlers, the browser has default actions that it provides for these elements, and if the page is busy with work, the browser will still not be able to act on those.
--
You received this message because you are subscribed to the Google Groups "web-vitals-feedback" group.
To unsubscribe from this group and stop receiving emails from it, send an email to web-vitals-feed...@googlegroups.com.
To view this discussion on the web visit https://groups.google.com/d/msgid/web-vitals-feedback/2b922f64-d318-4ef1-99cd-7b178b7ae532n%40googlegroups.com.

Barry Pollard
Jul 11, 2023, 9:29:43 AM7/11/23
to Terence Eden, web-vitals-feedback
Hi Terence,
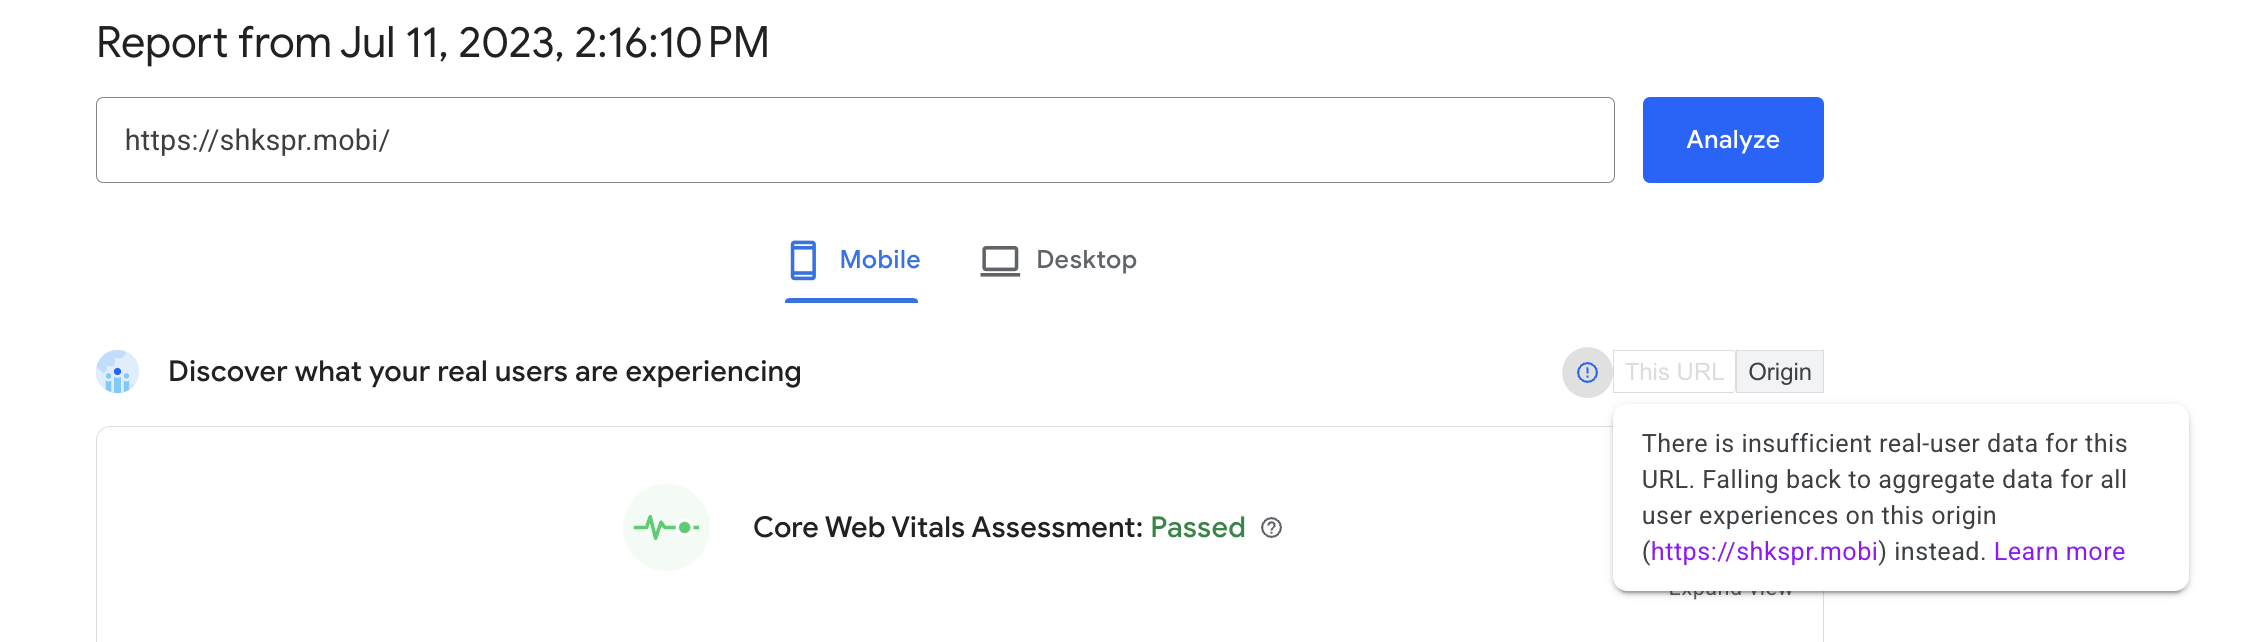

I'm not sure where you are gathering you INP information from (PageSpeed Insights? Google Search Console?) but I look at your page in PageSpeed Insights I notice it is not returning INP for that page, but for the origin as a whole:
This suggests you do not have enough traffic to record page-level data for the URL entered and instead are seeing an aggregated view across your whole origin.
So that's one potential cause of misunderstanding, as you may have interactive widgets on other, high trafficked pages on your site which may be lowering your overall origin-level INP score.
I see you have a comment system on your blog on the posts themselves and not sure how that works, but if it makes a synchronous post and blocks the main thread then it could be contributing to a high INP. Similarly you have a lot of share buttons in your post, so maybe they are the cause?
Additionally, it looks like a lot event handlers on your links:
The code is minified, so again it's a little difficult for me to tell what that is doing but if it delays the page load somehow, then that could be a reason.
Finally, it looks like your issues are only on mobile, and not on desktop. It's worth looking at your mobile traffic and trying to understand if your readers are on constrained devices which makes, even seemingly fast on desktop experiences, a bit slower.
The best way of getting the real answer is to look gather helping metrics in the field as detailed here: https://web.dev/debug-performance-in-the-field/
Good luck in identifying the issue and would love to hear what it is once you figure it out!
Thanks,
Barry
--
Terence Eden
Jul 11, 2023, 2:33:25 PM7/11/23
to web-vitals-feedback
I got an email from the Google Search Console. I also tried it on Page Speed Insights.
Search Console lists only 304 URLs (out of thousands) with "INP issue: longer than 200 ms (mobile)".
I do not have any interactive widgets on my page. It is a blog.
I do not have comments on the pages listed on Google's report. Where I do have comments, it is a standard POST form.
I think the best way to resolve this is for Google to provide a bit more transparency on its metrics. And, perhaps, some proper tools and documentation. It isn't very nice to get an email saying something is wrong without providing any way to fix it. If I have misunderstood what's going on, perhaps Google could provide some clearer explanations?
Thanks.
Barry Pollard
Jul 11, 2023, 4:25:45 PM7/11/23
to web-vitals-feedback
The fact that the vast majority of your pages are meeting the good threshold, and a small number are just outside of this threshold is great and shows that the site is, on the whole, very performant!
As I mentioned PageSpeed Insights is unable to provide page-level data for those particular URLs and is giving aggregated data for your whole site. So it may not be the pages you have selected.
Similarly, Google Search Console (GSC) groups pages into certain "page groups" and assigns the aggregate Core Web Vitals numbers to all pages in the group. It could be there are a few pages in that group, with more intensive JavaScript, or a video widget or a podcast widget, that are pulling the group score down. The page grouping is a best efforts guess as to pages that likely are similar, but it may be it's listed simple "tag" pages with more complex heavy pages incorrectly. GSC also lists sample URLs in order of popularity as a best guess of the pages to concentrate on, but as you've seen these may not be the pages actually causing the issue. This can be a little confusing the first time you delve into this report.
Looking at the historical INP data for your site for mobile, it does appear the current INP scores are actually better than they have been in the past, but is does appear in general your mobile responsiveness is below best practices, so something seems up, despite this being a seemingly simple blog.
Perhaps with the understanding that the example pages may not be the pages with the issue, and with your knowledge of your own site you pin point what the potential issue could be? Alternatively, as I suggested, you can gather more data yourself to understand this better (and yes I get the irony of adding more JavaScript to identify a problem likely caused by JavaScript!). Even without that, it pays to look at your most popular pages and see if any of them are heavier than these examples and maybe those are ones that could be improvement.
One finally, general thing I noticed is that the Lighthouse part of PageSpeed Insights does identify pages as having a large DOM size, which can cause performance issue. It looks like often over half the page is made up of your "Explore the Archives" section with a lot of elements. I was hesitant to mention it, as it's not truly massive, and I'm sure most of the time it's fine, but it could be one a cause of the browser have to do a lot of work when rendering or updating the page. Perhaps some of this could be hidden under a "show older archive" button to keep the page size smaller? But that's more a design decision for you. As I say, on the whole your site is very responsive, with just some outlier pages it seems.
There is extensive documentation on the Core Web Vitals initiative at https://web.dev/vitals/ and https://web.dev/fast/ and on INP in particular at https://web.dev/inp/ and https://web.dev/optimize-inp/ but this is certainly one of the trickier performance metrics to optimize for! The tooling in GSC, Lighthouse and the CrUX Dashboard I've linked above are just some of the ways that Google is trying to help site owners optimize their performance for their users.
Terence Eden
Jul 11, 2023, 5:08:25 PM7/11/23
to web-vitals-feedback
Perhaps you could tell your colleagues in the GSC team that their website and emails are needlessly confusing and causing a great deal of unnecessary stress?
If you can't tell me which of my pages are failing this test and why, then there's no meaningful action I can take.
Reply all
Reply to author
Forward
0 new messages