[Smoothness Metrics] Thoughts on what makes a good frame rate metric
629 views
Skip to first unread message

Anthony Morris
May 28, 2023, 10:50:43 PM5/28/23
to web-vital...@googlegroups.com
Hi Web Vitals,
I work at Canva on improving performance and we're looking at getting better metrics around performance while using the editor. One specific area we're looking at is measuring the performance of continuous interactions like scroll, zoom, drag, etc (where continuous is in contrast to discrete interactions like click, tap, keypress etc. which are covered by Interaction to Next Paint and PerformanceEventTiming).
I've read through https://web.dev/smoothness but I'm still left a bit confused by how "Percent Dropped Frames" is defined, in particular if it were just (expected_frames - actual_frames)/expected_frames then isn't that mathematically equivalent to 1 - fps/60 (or 1 - fps/expected_fps). The article discusses partial frames but doesn't really explain how this factors into the calculation. Is there more detail on this (e.g., what is used for the Performance HUD)?
One of the big issues I've observed with FPS (or similar) when trying to use it as a summary metric is that it is ultimately only an average (mean) over the given time period and perceived smoothness is far more affected by outliers. In order to play around with a few ways of summarizing frame rate into a metric, I made a small demo page with a few different scenarios and some metrics for each: https://5kwby0.csb.app/ (sandbox). I drew a few conclusions from this:
- FPS/Percent Dropped Frames is unable to distinguish between consistent 33ms frames and the occasional very slow frame among a lot of fast frames (both are 30fps/50% dropped frames). But the former feels quite smooth and the latter feels very janky.
- Percentile approaches require choosing an arbitrary percentile (90? 95? 98?) and then are only sensitive around that percentile. E.g., with 98th percentile (a la INP), every frame taking 500ms is the same as one 500ms and thirty 16ms frames but they feel very different again in terms of smoothness. It's also expensive to compute accurately over a large number of frames.
- Mean + z*SD (i.e., z scores for distributions) seem quite effective at capturing both average frame rate and also penalizing very slow frames
My current plan is to compute Mean + 2*SD of frame duration for each interaction and then aggregate that over a browser session using an average (weighted by interaction duration). We plan to implement this in production only during user interactions (with manual instrumentation given there are no built-in APIs for this currently) where we know there are continuous JS driven rendering updates.
- Anthony Morris, Canva
Empowering the world to design We're hiring, apply here! Check out the latest news and learnings from our team on the Canva Newsroom. |


Michal Mocny
Jun 20, 2023, 10:55:29 AM6/20/23
to Anthony Morris, Noam Rosenthal, web-vital...@googlegroups.com
Hello! Thanks for the feedback, comments inline below.
On Sun, May 28, 2023 at 10:50 PM 'Anthony Morris' via web-vitals-feedback <web-vital...@googlegroups.com> wrote:
Hi Web Vitals,I work at Canva on improving performance and we're looking at getting better metrics around performance while using the editor. One specific area we're looking at is measuring the performance of continuous interactions like scroll, zoom, drag, etc (where continuous is in contrast to discrete interactions like click, tap, keypress etc. which are covered by Interaction to Next Paint and PerformanceEventTiming).
Makes sense. In your application is scrolling/zooming handled directly by the compositor thread or driven through the main thread? In other words, do you need the complexity of defining "partial frame" updates or just looking at main thread rendering performance?
I've read through https://web.dev/smoothness but I'm still left a bit confused by how "Percent Dropped Frames" is defined, in particular if it were just (expected_frames - actual_frames)/expected_frames then isn't that mathematically equivalent to 1 - fps/60 (or 1 - fps/expected_fps). The article discusses partial frames but doesn't really explain how this factors into the calculation. Is there more detail on this (e.g., what is used for the Performance HUD)?
You are correct that at a fixed frame rate that these could be considered mathematically equivalent (dropped = frame_rate - produced). However, in a world where we have more states than just produced frames and dropped frames, e.g.:
- Idle time, where no frames are "produced" but are still not considered dropped
- partial frame updates, where some frame update is produced but it may or may not have the primary content
- no frame update, but which is still not considered as "affecting smoothness" (for example, delays to render a static page updates -- a loading/responsiveness problem, but not a continuous animation problem)
So in a world where there are at least 3 states for a frame:
- Produced
- Dropped
- Not produced, but not "affecting smoothness"
...then there becomes a difference between these two metrics.
We could have just reported a higher FPS than really rendered, but that felt less appropriate than the inverse, and report only actual measured drops, implying the other not dropped frames were either produced or something in between.
Does that make sense? Do you agree?
One of the big issues I've observed with FPS (or similar) when trying to use it as a summary metric is that it is ultimately only an average (mean) over the given time period and perceived smoothness is far more affected by outliers. In order to play around with a few ways of summarizing frame rate into a metric, I made a small demo page with a few different scenarios and some metrics for each: https://5kwby0.csb.app/ (sandbox). I drew a few conclusions from this:
Nice!
Yes, labelling frames as dropped or not is only part of the puzzle. The other part is figuring out how to aggregate into an overall metric. One of the strategies we played with was a N-second rolling average and then taking max/high-percentile value over the timeline -- but it gets tricky with long idle periods.
Another set of smoothness metrics that are working well (at least in large aggregate data right now) is to measure each animation type independently, sampled at 5s intervals (of active animation), and just report the dropped_frames% for each 5s sample-- aggregate all those samples into a histogram over the whole experience, and then look at various percentiles.
- FPS/Percent Dropped Frames is unable to distinguish between consistent 33ms frames and the occasional very slow frame among a lot of fast frames (both are 30fps/50% dropped frames). But the former feels quite smooth and the latter feels very janky.
Agreed. We had some ideas about measuring frame latency of each produced frame and to use some strategy like RMS instead of arithmetic mean.
- Percentile approaches require choosing an arbitrary percentile (90? 95? 98?) and then are only sensitive around that percentile. E.g., with 98th percentile (a la INP), every frame taking 500ms is the same as one 500ms and thirty 16ms frames but they feel very different again in terms of smoothness. It's also expensive to compute accurately over a large number of frames.
Agreed, again. It is certainly important to consider more than a single frame latency value. We tend to use a window of time and count all frames within that time period. Some of the "time windows" we tried were "sliding windows" or even "the entire page lifecycle"... but the latter risks over-indexing on idle time periods.
(Unlike INP metric, where it is valuable to report a single discrete interaction, for smoothness it feels acceptable, maybe even necessary, to do a blended metric over many frames almost by definition.)
- Mean + z*SD (i.e., z scores for distributions) seem quite effective at capturing both average frame rate and also penalizing very slow frames
I have not looked nor am I aware of anyone trying that strategy. Looking at the demo you shared, I do agree that the scores are sorted in the same order as I would rate the smoothness, perceptually. Cool! I'll spend some more time looking into it.
My current plan is to compute Mean + 2*SD of frame duration for each interaction and then aggregate that over a browser session using an average (weighted by interaction duration). We plan to implement this in production only during user interactions (with manual instrumentation given there are no built-in APIs for this currently) where we know there are continuous JS driven rendering updates.
That makes a lot of sense to me. It is also a lot simpler to define such a case when you only require to measure main thread rendering updates, and if you only have one active measured animation at a time. Please keep us in the loop!
Given that you are measuring main thread updates, I'm wondering if the new Long Animation Frame reporting API could be useful? At the moment, that API will report any time a frame has more latency than 50ms-- but perhaps we could support custom thresholds as low as 16ms for your use case.
This way, rather than using rAF to measure each frame inside the rendering loop, you could just measure of duration of known long frames after rendering has completed. The LoAF api will also potentially do a better job marking the true start/end points of the main thread rendering loop (such as including the time spent in style/layout/paint/commit).
- Anthony Morris, Canva
--
You received this message because you are subscribed to the Google Groups "web-vitals-feedback" group.
To unsubscribe from this group and stop receiving emails from it, send an email to web-vitals-feed...@googlegroups.com.
To view this discussion on the web visit https://groups.google.com/d/msgid/web-vitals-feedback/CAC_0iJzUaYxgTgtJsyr_sQY6P%3DoWOd1EWqPUmAouT4Fo7Fs4bQ%40mail.gmail.com.
Anthony Morris
Jun 22, 2023, 12:15:39 AM6/22/23
to Michal Mocny, Noam Rosenthal, web-vital...@googlegroups.com
Thanks Michal - some great points here. Some further responses inline below.
On Sun, May 28, 2023 at 10:50 PM 'Anthony Morris' via web-vitals-feedback <web-vital...@googlegroups.com> wrote:Hi Web Vitals,I work at Canva on improving performance and we're looking at getting better metrics around performance while using the editor. One specific area we're looking at is measuring the performance of continuous interactions like scroll, zoom, drag, etc (where continuous is in contrast to discrete interactions like click, tap, keypress etc. which are covered by Interaction to Next Paint and PerformanceEventTiming).Makes sense. In your application is scrolling/zooming handled directly by the compositor thread or driven through the main thread? In other words, do you need the complexity of defining "partial frame" updates or just looking at main thread rendering performance?
Ah - it varies! Zooming is always driven by the main thread. Scrolling is a mix of both. So yes - we probably need a mix of both to get this correct.
I've read through https://web.dev/smoothness but I'm still left a bit confused by how "Percent Dropped Frames" is defined, in particular if it were just (expected_frames - actual_frames)/expected_frames then isn't that mathematically equivalent to 1 - fps/60 (or 1 - fps/expected_fps). The article discusses partial frames but doesn't really explain how this factors into the calculation. Is there more detail on this (e.g., what is used for the Performance HUD)?You are correct that at a fixed frame rate that these could be considered mathematically equivalent (dropped = frame_rate - produced). However, in a world where we have more states than just produced frames and dropped frames, e.g.:
- Idle time, where no frames are "produced" but are still not considered dropped
- partial frame updates, where some frame update is produced but it may or may not have the primary content
- no frame update, but which is still not considered as "affecting smoothness" (for example, delays to render a static page updates -- a loading/responsiveness problem, but not a continuous animation problem)
So in a world where there are at least 3 states for a frame:
- Produced
- Dropped
- Not produced, but not "affecting smoothness"
...then there becomes a difference between these two metrics.We could have just reported a higher FPS than really rendered, but that felt less appropriate than the inverse, and report only actual measured drops, implying the other not dropped frames were either produced or something in between.Does that make sense? Do you agree?
Ah yes - I like the idea that percent dropped naturally excludes idle time (though you could, and probably should, exclude idle time from an FPS calculation which I think gets us back to them being equivalent). The part I'm less familiar with is partial frame updates and I can see how that might more naturally fall into percent dropped (though again, if the partial update is 50% of the frame, then that is naturally translated to 0.5 for number of frames in the numerator of the FPS calculation and I think they remain equivalent).
One of the big issues I've observed with FPS (or similar) when trying to use it as a summary metric is that it is ultimately only an average (mean) over the given time period and perceived smoothness is far more affected by outliers. In order to play around with a few ways of summarizing frame rate into a metric, I made a small demo page with a few different scenarios and some metrics for each: https://5kwby0.csb.app/ (sandbox). I drew a few conclusions from this:Nice!Yes, labelling frames as dropped or not is only part of the puzzle. The other part is figuring out how to aggregate into an overall metric. One of the strategies we played with was a N-second rolling average and then taking max/high-percentile value over the timeline -- but it gets tricky with long idle periods.Another set of smoothness metrics that are working well (at least in large aggregate data right now) is to measure each animation type independently, sampled at 5s intervals (of active animation), and just report the dropped_frames% for each 5s sample-- aggregate all those samples into a histogram over the whole experience, and then look at various percentiles.
- FPS/Percent Dropped Frames is unable to distinguish between consistent 33ms frames and the occasional very slow frame among a lot of fast frames (both are 30fps/50% dropped frames). But the former feels quite smooth and the latter feels very janky.
Agreed. We had some ideas about measuring frame latency of each produced frame and to use some strategy like RMS instead of arithmetic mean.
- Percentile approaches require choosing an arbitrary percentile (90? 95? 98?) and then are only sensitive around that percentile. E.g., with 98th percentile (a la INP), every frame taking 500ms is the same as one 500ms and thirty 16ms frames but they feel very different again in terms of smoothness. It's also expensive to compute accurately over a large number of frames.
Agreed, again. It is certainly important to consider more than a single frame latency value. We tend to use a window of time and count all frames within that time period. Some of the "time windows" we tried were "sliding windows" or even "the entire page lifecycle"... but the latter risks over-indexing on idle time periods.(Unlike INP metric, where it is valuable to report a single discrete interaction, for smoothness it feels acceptable, maybe even necessary, to do a blended metric over many frames almost by definition.)
- Mean + z*SD (i.e., z scores for distributions) seem quite effective at capturing both average frame rate and also penalizing very slow frames
I have not looked nor am I aware of anyone trying that strategy. Looking at the demo you shared, I do agree that the scores are sorted in the same order as I would rate the smoothness, perceptually. Cool! I'll spend some more time looking into it.
I actually really like RMS (Quadratic Mean) and have added it to the demo and I think it also properly penalizes longer frames while being an even simpler mathematical construct. And it has a very clear name and non-arbitrary definition - I've really struggled to name mean + z*SD as a metric to the point where I'm considering going back to the simpler FPS because everyone understands what that means.
My current plan is to compute Mean + 2*SD of frame duration for each interaction and then aggregate that over a browser session using an average (weighted by interaction duration). We plan to implement this in production only during user interactions (with manual instrumentation given there are no built-in APIs for this currently) where we know there are continuous JS driven rendering updates.That makes a lot of sense to me. It is also a lot simpler to define such a case when you only require to measure main thread rendering updates, and if you only have one active measured animation at a time. Please keep us in the loop!Given that you are measuring main thread updates, I'm wondering if the new Long Animation Frame reporting API could be useful? At the moment, that API will report any time a frame has more latency than 50ms-- but perhaps we could support custom thresholds as low as 16ms for your use case.This way, rather than using rAF to measure each frame inside the rendering loop, you could just measure of duration of known long frames after rendering has completed. The LoAF api will also potentially do a better job marking the true start/end points of the main thread rendering loop (such as including the time spent in style/layout/paint/commit).
Yes - LoAF would be better if it can be more sensitive and we have good control over the start and end points. Will LoAF take into account compositor thread animations or just main thread animations?
Michal Mocny
Jun 23, 2023, 11:37:05 AM6/23/23
to Anthony Morris, Noam Rosenthal, web-vital...@googlegroups.com
On Thu, Jun 22, 2023 at 12:15 AM Anthony Morris <amo...@canva.com> wrote:
Thanks Michal - some great points here. Some further responses inline below.On Sun, May 28, 2023 at 10:50 PM 'Anthony Morris' via web-vitals-feedback <web-vital...@googlegroups.com> wrote:Hi Web Vitals,I work at Canva on improving performance and we're looking at getting better metrics around performance while using the editor. One specific area we're looking at is measuring the performance of continuous interactions like scroll, zoom, drag, etc (where continuous is in contrast to discrete interactions like click, tap, keypress etc. which are covered by Interaction to Next Paint and PerformanceEventTiming).Makes sense. In your application is scrolling/zooming handled directly by the compositor thread or driven through the main thread? In other words, do you need the complexity of defining "partial frame" updates or just looking at main thread rendering performance?Ah - it varies! Zooming is always driven by the main thread. Scrolling is a mix of both. So yes - we probably need a mix of both to get this correct.
I've read through https://web.dev/smoothness but I'm still left a bit confused by how "Percent Dropped Frames" is defined, in particular if it were just (expected_frames - actual_frames)/expected_frames then isn't that mathematically equivalent to 1 - fps/60 (or 1 - fps/expected_fps). The article discusses partial frames but doesn't really explain how this factors into the calculation. Is there more detail on this (e.g., what is used for the Performance HUD)?You are correct that at a fixed frame rate that these could be considered mathematically equivalent (dropped = frame_rate - produced). However, in a world where we have more states than just produced frames and dropped frames, e.g.:
- Idle time, where no frames are "produced" but are still not considered dropped
- partial frame updates, where some frame update is produced but it may or may not have the primary content
- no frame update, but which is still not considered as "affecting smoothness" (for example, delays to render a static page updates -- a loading/responsiveness problem, but not a continuous animation problem)
So in a world where there are at least 3 states for a frame:
- Produced
- Dropped
- Not produced, but not "affecting smoothness"
...then there becomes a difference between these two metrics.We could have just reported a higher FPS than really rendered, but that felt less appropriate than the inverse, and report only actual measured drops, implying the other not dropped frames were either produced or something in between.Does that make sense? Do you agree?Ah yes - I like the idea that percent dropped naturally excludes idle time (though you could, and probably should, exclude idle time from an FPS calculation which I think gets us back to them being equivalent). The part I'm less familiar with is partial frame updates and I can see how that might more naturally fall into percent dropped (though again, if the partial update is 50% of the frame, then that is naturally translated to 0.5 for number of frames in the numerator of the FPS calculation and I think they remain equivalent).
This is an area that hasn't had enough experimentation yet, but here were some ideas I think we could explore in the future:
- Each frame is not a boolean, but has some value/score, comprised of the following:
- "Partial" frames (compositor thread update without main thread update)
- Missing rendered content (i.e. content that needs rasterization is not complete in time, e.g. image decode, SVG, checkerboarded tiles...)
- Number of active animations, the visual size of those animations, and/or the semantic value of those animations
- Sometimes, certain animations are worth more/less depending on other animations. For example, main document animation updates are just not as important during a rapid full viewport scroll (because they are imperceptible)... unless those animations are viewport sticky and/or scroll timeline aligned, etc.
- Each frame update has a latency, in ms. Over time, we want frame latencies to balance off overall throughput (mean latency), outliers (max latency), and consistency (standard deviation).
Other factors which complicate smoothness metrics are: even when a page is technically smooth based on frame rate, the contents of the animation frames may not feel smooth to the user. For example, a poorly implemented animation which jitters. A custom scroller that feels unnatural. A canvas based game which renders all frames quickly but where the contents of the canvas is not filled correctly. Or just a typical web page which may not block the main thread but could still have content loading / styling / layout shift issues which affect the perceived visual stability of the page overall.
One of the big issues I've observed with FPS (or similar) when trying to use it as a summary metric is that it is ultimately only an average (mean) over the given time period and perceived smoothness is far more affected by outliers. In order to play around with a few ways of summarizing frame rate into a metric, I made a small demo page with a few different scenarios and some metrics for each: https://5kwby0.csb.app/ (sandbox). I drew a few conclusions from this:Nice!Yes, labelling frames as dropped or not is only part of the puzzle. The other part is figuring out how to aggregate into an overall metric. One of the strategies we played with was a N-second rolling average and then taking max/high-percentile value over the timeline -- but it gets tricky with long idle periods.Another set of smoothness metrics that are working well (at least in large aggregate data right now) is to measure each animation type independently, sampled at 5s intervals (of active animation), and just report the dropped_frames% for each 5s sample-- aggregate all those samples into a histogram over the whole experience, and then look at various percentiles.
- FPS/Percent Dropped Frames is unable to distinguish between consistent 33ms frames and the occasional very slow frame among a lot of fast frames (both are 30fps/50% dropped frames). But the former feels quite smooth and the latter feels very janky.
Agreed. We had some ideas about measuring frame latency of each produced frame and to use some strategy like RMS instead of arithmetic mean.
- Percentile approaches require choosing an arbitrary percentile (90? 95? 98?) and then are only sensitive around that percentile. E.g., with 98th percentile (a la INP), every frame taking 500ms is the same as one 500ms and thirty 16ms frames but they feel very different again in terms of smoothness. It's also expensive to compute accurately over a large number of frames.
Agreed, again. It is certainly important to consider more than a single frame latency value. We tend to use a window of time and count all frames within that time period. Some of the "time windows" we tried were "sliding windows" or even "the entire page lifecycle"... but the latter risks over-indexing on idle time periods.(Unlike INP metric, where it is valuable to report a single discrete interaction, for smoothness it feels acceptable, maybe even necessary, to do a blended metric over many frames almost by definition.)
- Mean + z*SD (i.e., z scores for distributions) seem quite effective at capturing both average frame rate and also penalizing very slow frames
I have not looked nor am I aware of anyone trying that strategy. Looking at the demo you shared, I do agree that the scores are sorted in the same order as I would rate the smoothness, perceptually. Cool! I'll spend some more time looking into it.I actually really like RMS (Quadratic Mean) and have added it to the demo and I think it also properly penalizes longer frames while being an even simpler mathematical construct. And it has a very clear name and non-arbitrary definition - I've really struggled to name mean + z*SD as a metric to the point where I'm considering going back to the simpler FPS because everyone understands what that means.
So it looks like RMS does well for the most part in your demo. It seems to be consistent in ordering with Mean + 2SD, except for the very last 2 animations where RMS labels "stable 10fps" example as slighly better than "janky 30fps", where Mean + 2SD labels "janky 30fps" as ~2x worse. I guess it's up to interpretation which is worse, my subjective opinion is somewhere in the middle, janky 30 is "slightly worse" but both are bad!
My current plan is to compute Mean + 2*SD of frame duration for each interaction and then aggregate that over a browser session using an average (weighted by interaction duration). We plan to implement this in production only during user interactions (with manual instrumentation given there are no built-in APIs for this currently) where we know there are continuous JS driven rendering updates.That makes a lot of sense to me. It is also a lot simpler to define such a case when you only require to measure main thread rendering updates, and if you only have one active measured animation at a time. Please keep us in the loop!Given that you are measuring main thread updates, I'm wondering if the new Long Animation Frame reporting API could be useful? At the moment, that API will report any time a frame has more latency than 50ms-- but perhaps we could support custom thresholds as low as 16ms for your use case.This way, rather than using rAF to measure each frame inside the rendering loop, you could just measure of duration of known long frames after rendering has completed. The LoAF api will also potentially do a better job marking the true start/end points of the main thread rendering loop (such as including the time spent in style/layout/paint/commit).Yes - LoAF would be better if it can be more sensitive and we have good control over the start and end points. Will LoAF take into account compositor thread animations or just main thread animations?
LoAF will not currently measure compositor-only ("partial") frames, it only measures the main-thread.
At the moment LoAF also does not even measure presentation times even for main thread updates (the same way that LCP/Element Timing or Event Timing will), it only measures main thread scheduling + Paint. Potentially that could be supported if it were important, though I'm not sure. If LoAF did start to include presentation times in its overall duration, then perhaps then it could also report compositor-only frames which go long... even if there were no attribution tp report, just knowing duration (latency) could still be useful.
(But at that point, you probably also want to know about active animations, and measure whole frame sequences including fast frames, and really you just want a smoothness metric not a long frame diagnostic)
Anthony Morris
Aug 22, 2023, 3:19:22 AM8/22/23
to Michal Mocny, Noam Rosenthal, web-vital...@googlegroups.com
A few updates here:
Naming
We've come up with a better name for this metric: "Perceived Frame Duration (PFD)". It feels meaningful/relatable without further explanation and accurately reflects what the number is trying to measure. While you could take the reciprocal to get a "Perceived FPS", I think that's generally worse for visualizing (at least on a linear scale - all the interesting behavior is compressed to a very low range below 30FPS) and for aggregating (FPS is not a very linear measure [10->20FPS is a much more valuable improvement than 50->60FPS] so taking means can be misleading).
I also note that this name could be used regardless of the formula chosen for calculation (e.g., it could apply to Mean, RMS, Mean + 2*SD).
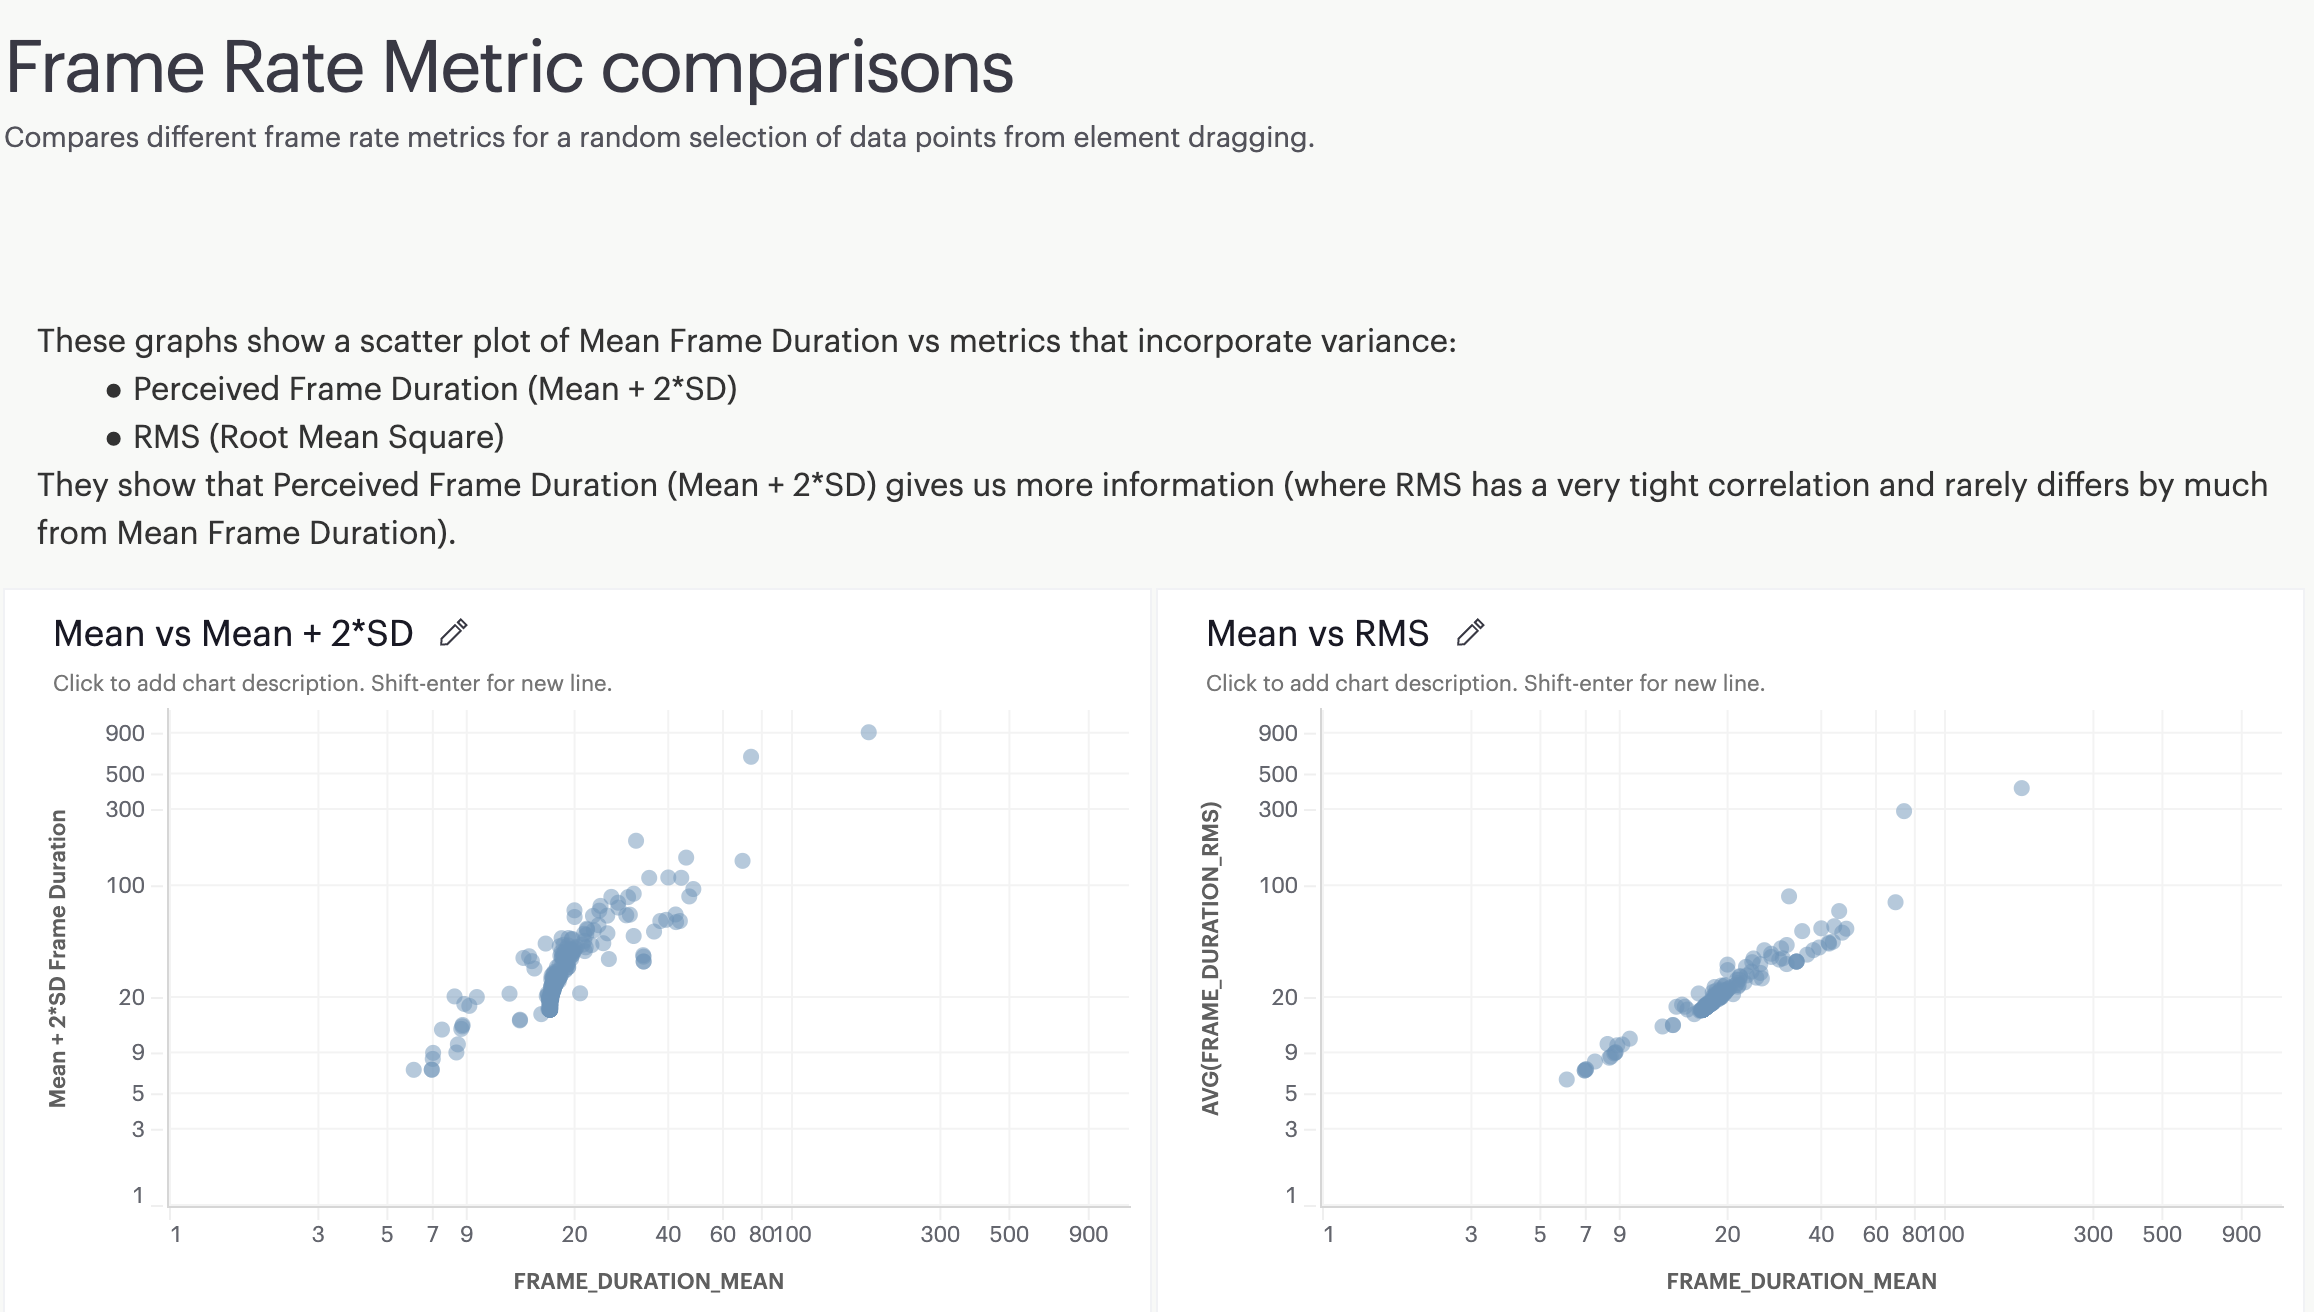
Calculation
We've also looked at some real world data from dragging elements to see how our proposed Perceived Frame Duration calculation (Mean + 2*SD) compares to other calculations (Mean, RMS). Comparing them against each other, we see that Mean + 2*SD shows more variation (though this is mostly a mathematical consequence of Mean < RMS < Mean + SD < Mean + 2*SD).
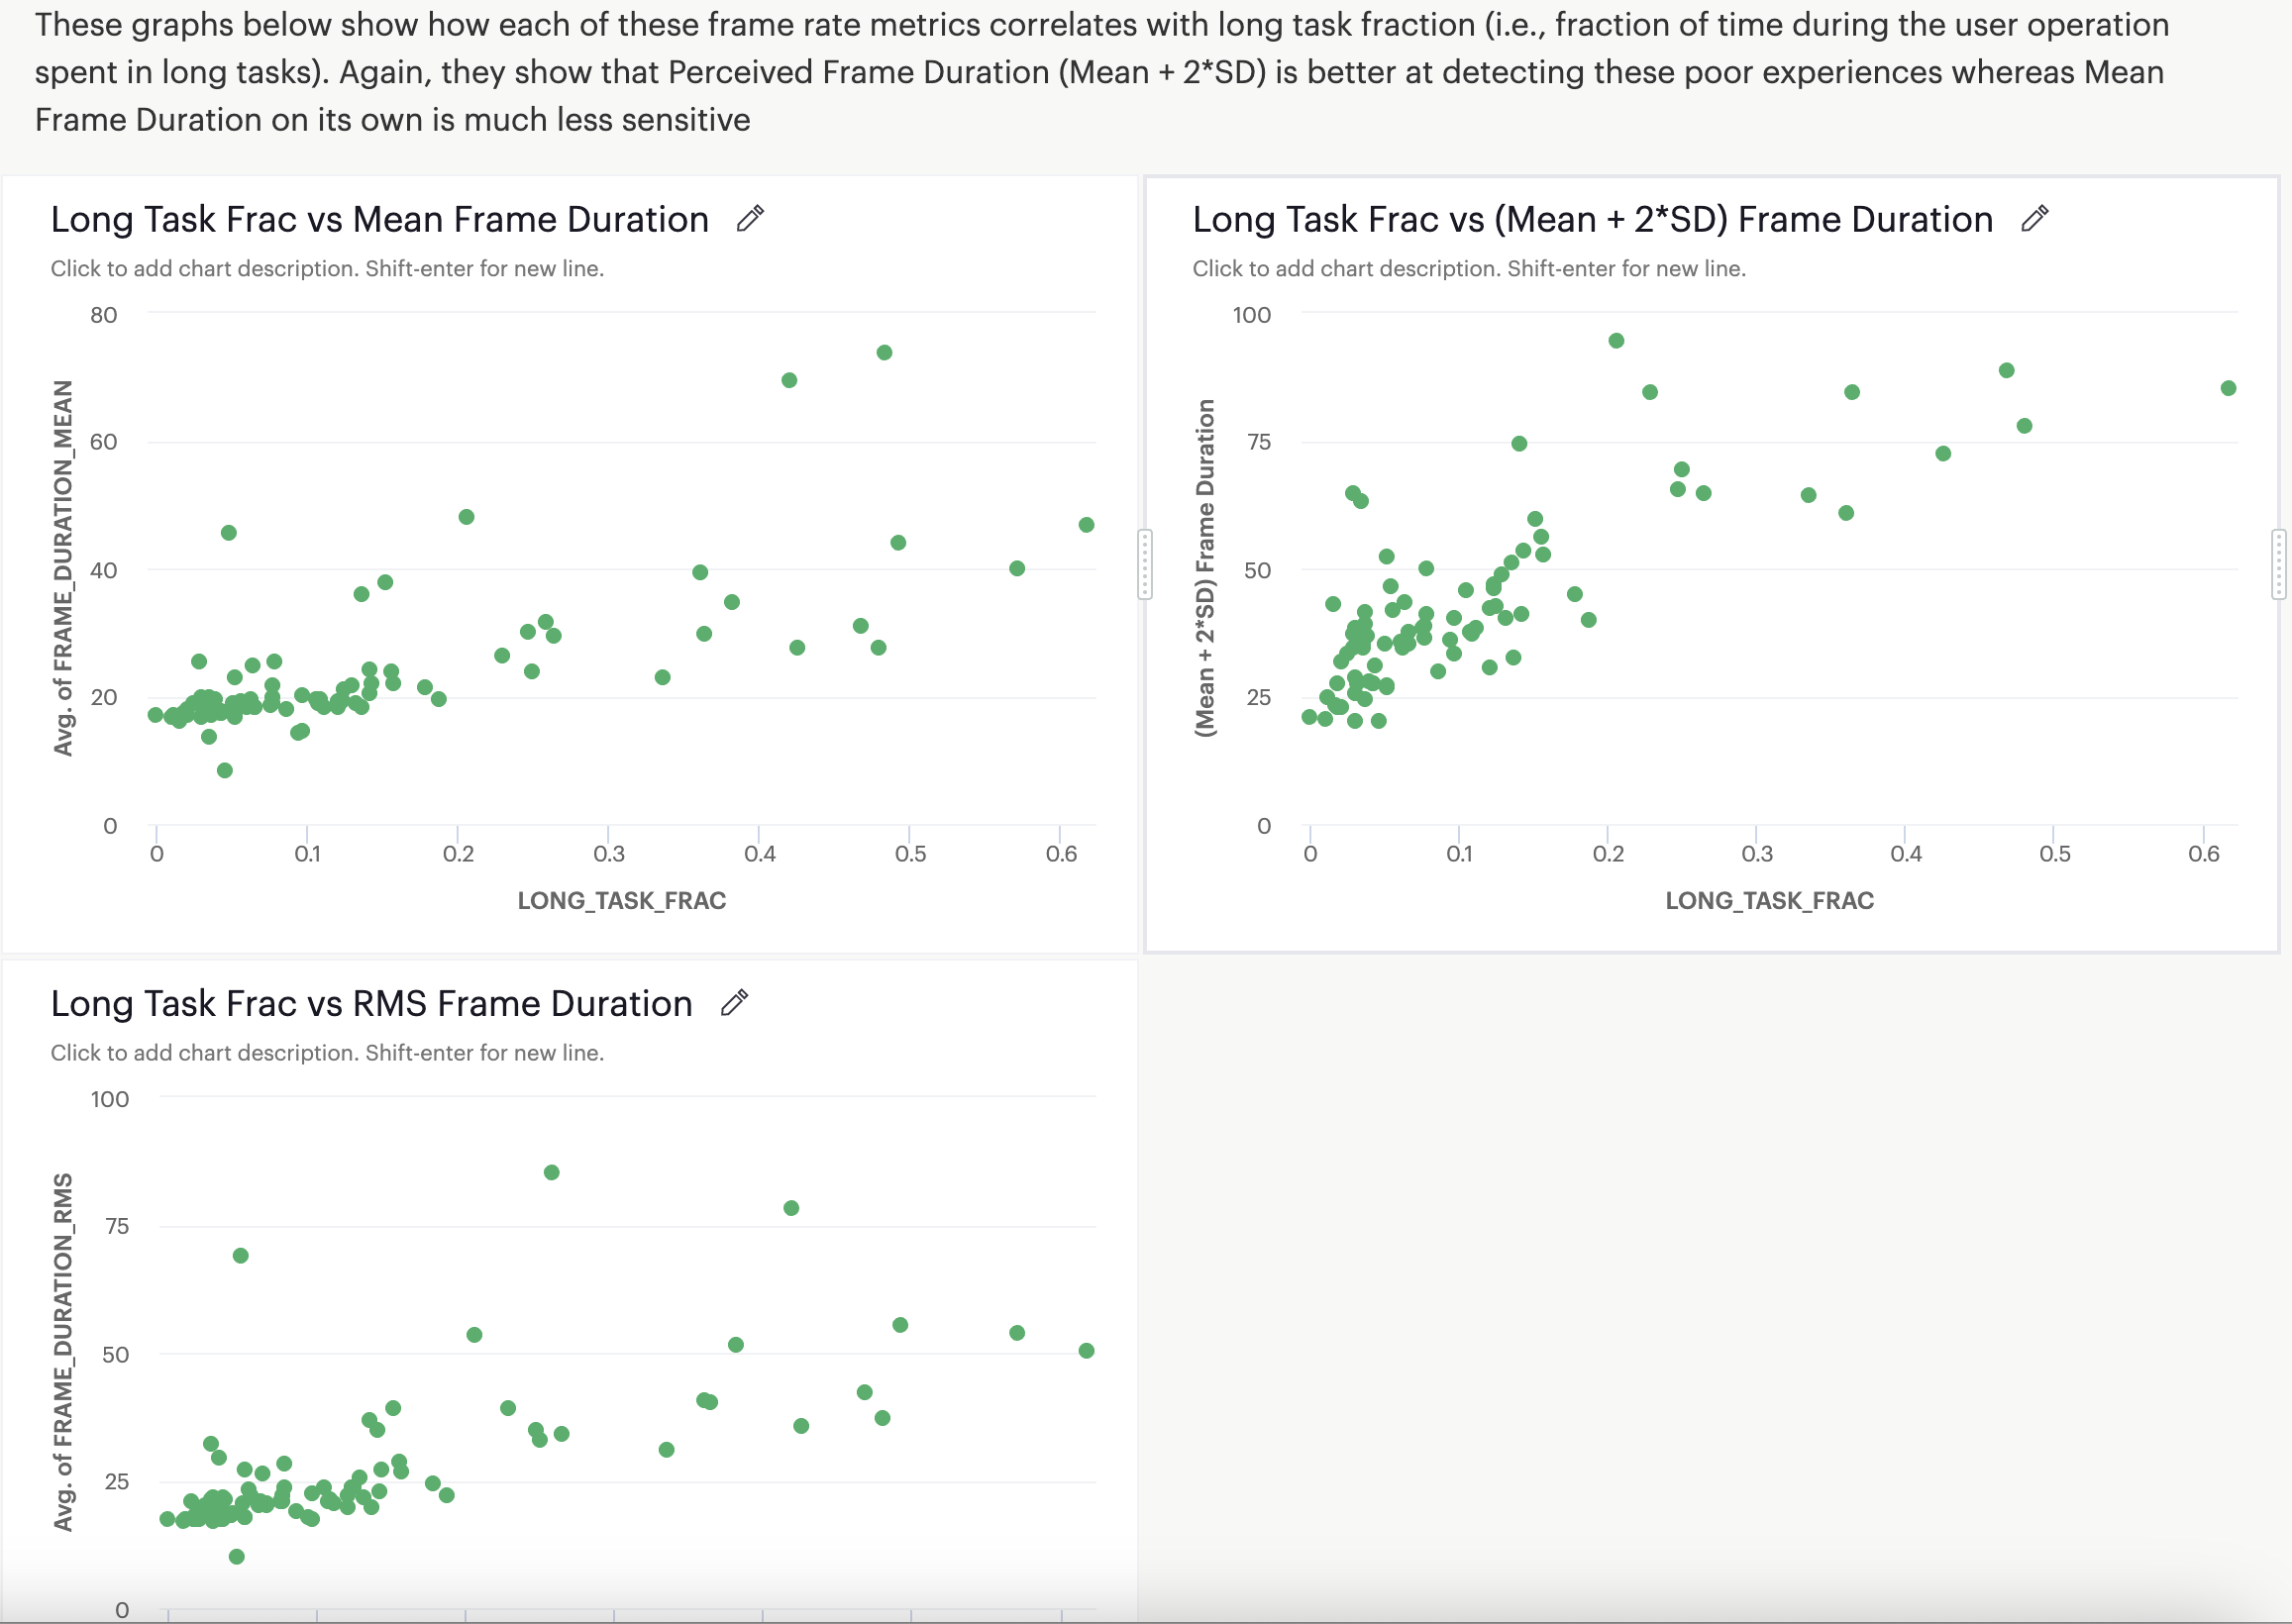
I also looked at how these metrics compared against an alternative metric of fraction of time in long tasks during the interaction and again Mean + 2*SD was more sensitive to these poor experiences.
Both these sets of data (along with the bouncing dots examples) suggest that Mean + 2*SD is a good reflection of user perceived performance during animations.
Michal Mocny
Aug 22, 2023, 11:16:59 AM8/22/23
to Anthony Morris, Noam Rosenthal, web-vital...@googlegroups.com
On Tue, Aug 22, 2023 at 3:19 AM Anthony Morris <amo...@canva.com> wrote:
A few updates here:NamingWe've come up with a better name for this metric: "Perceived Frame Duration (PFD)".
I like it.
It feels meaningful/relatable without further explanation and accurately reflects what the number is trying to measure. While you could take the reciprocal to get a "Perceived FPS", I think that's generally worse for visualizing (at least on a linear scale - all the interesting behavior is compressed to a very low range below 30FPS) and for aggregating (FPS is not a very linear measure [10->20FPS is a much more valuable improvement than 50->60FPS] so taking means can be misleading).
This reminds me of the debate between L/100km and MPG for fuel efficiency :)
I also note that this name could be used regardless of the formula chosen for calculation (e.g., it could apply to Mean, RMS, Mean + 2*SD).CalculationWe've also looked at some real world data from dragging elements to see how our proposed Perceived Frame Duration calculation (Mean + 2*SD) compares to other calculations (Mean, RMS). Comparing them against each other, we see that Mean + 2*SD shows more variation (though this is mostly a mathematical consequence of Mean < RMS < Mean + SD < Mean + 2*SD).I also looked at how these metrics compared against an alternative metric of fraction of time in long tasks during the interaction and again Mean + 2*SD was more sensitive to these poor experiences.Both these sets of data (along with the bouncing dots examples) suggest that Mean + 2*SD is a good reflection of user perceived performance during animations.


Thanks for sharing the data, I'll have to spend some more time unpacking!
QQ: for the "Long Task fraction", have you considered using the new Long Animation Frame (LoAF) API, now in origin trial, which is not only just a better evolution of Long Tasks, but also likely broadly useful for any animation-focused analysis?
---
Are you already using this smoothness metric somehow that led to interesting results?
Anthony Morris
Sep 14, 2023, 8:30:21 AM9/14/23
to Michal Mocny, Noam Rosenthal, web-vital...@googlegroups.com
We have seen the LoAF proposal but haven't had a chance to try it out yet. We'll discuss when we can test that out.
For the Perceived Frame Duration smoothness metric, we have instrumented a number of our key continuous interactions and have started to get some userful, actionable data. A couple of highlights:
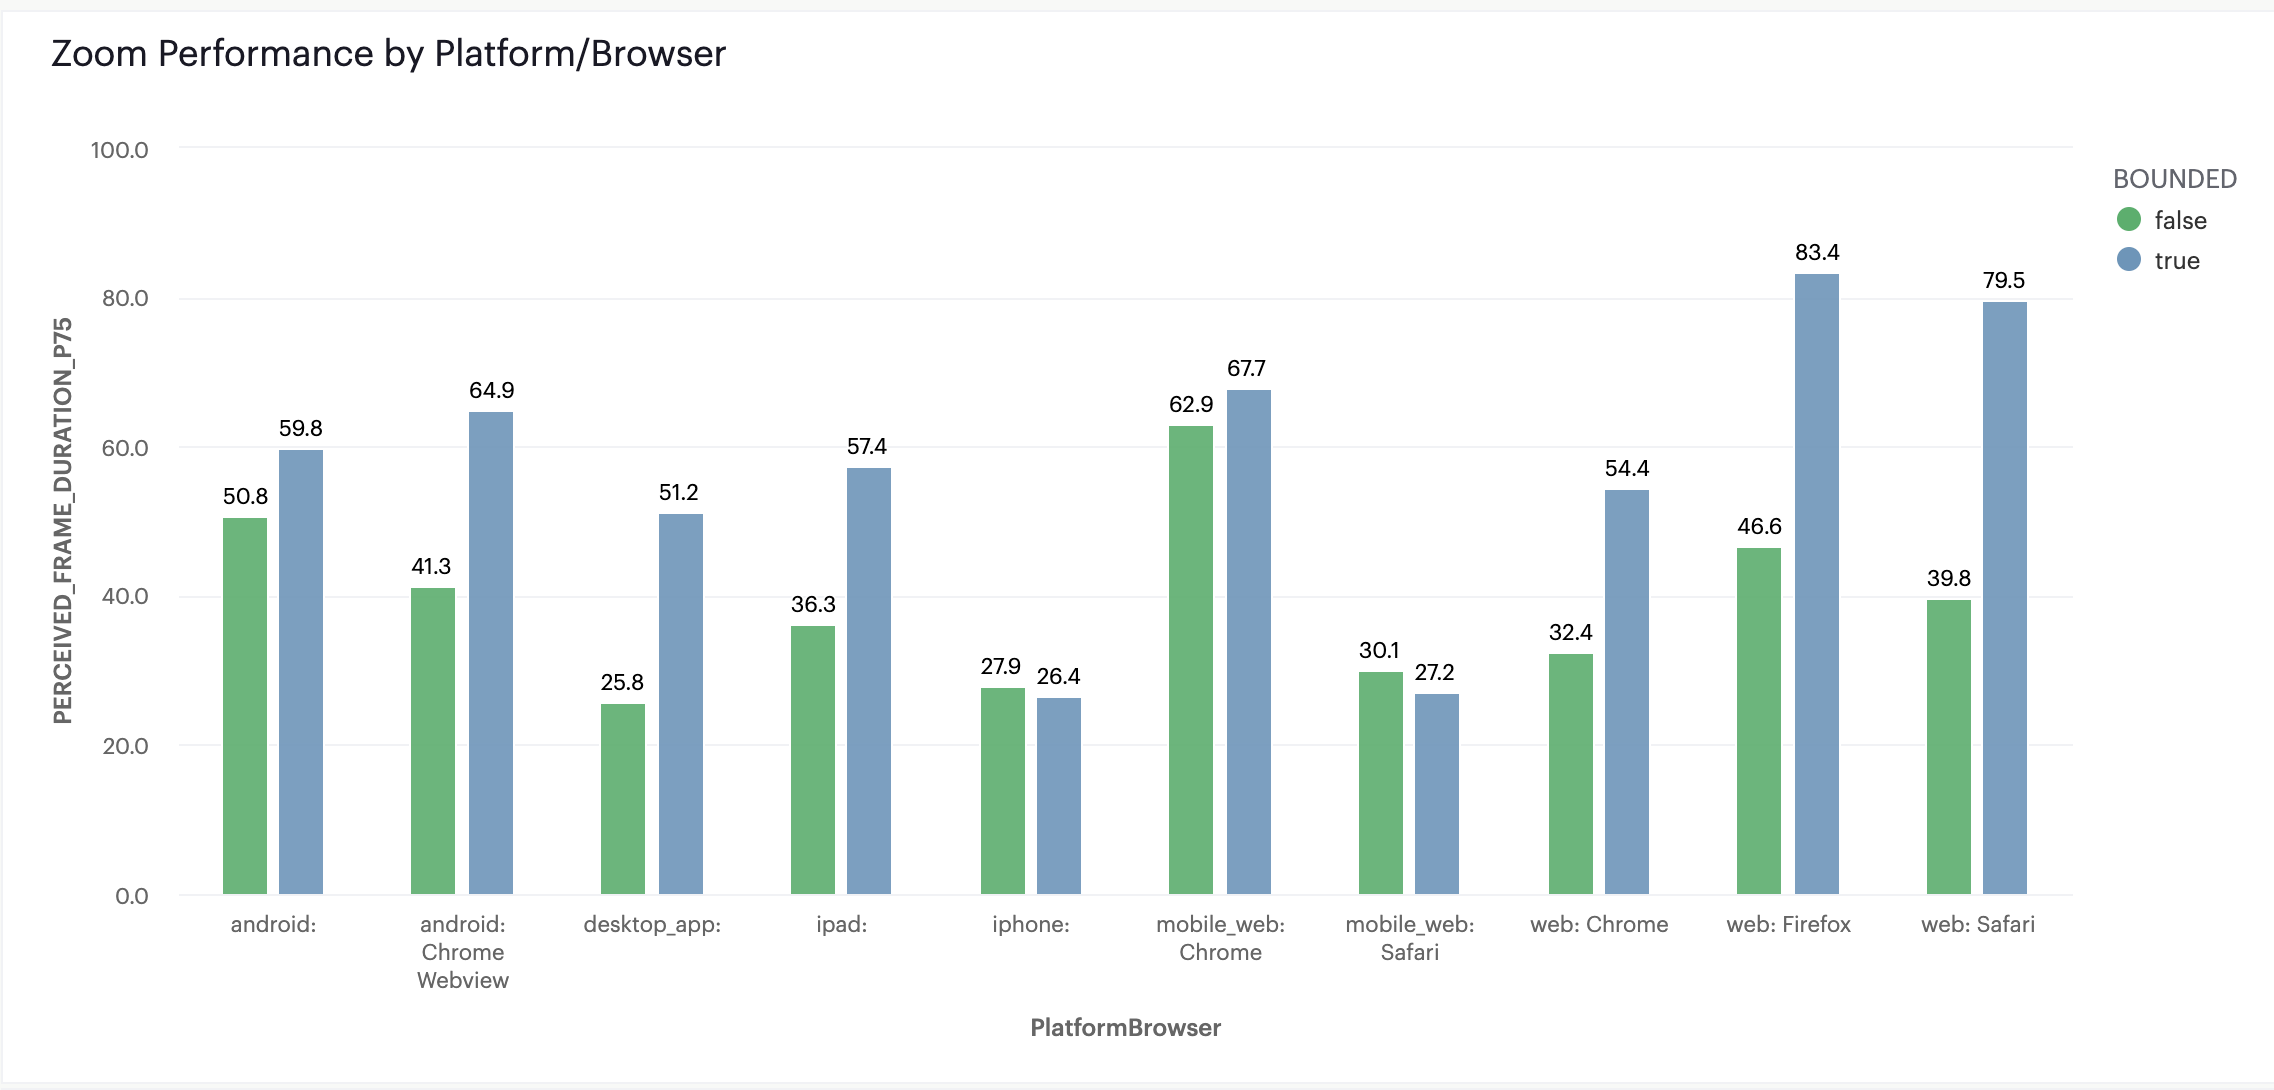
- We've identified some slow operations E.g., zooming on the main canvas (P75 of ~50ms =~20fps) and scrolling through the thumbnail strip (P75 of ~100ms = ~10fps)
- In looking into zooming on canvas, we've noticed it to be particularly slow on Firefox and Safari on desktop web. Looking into it, we learned that Safari and Firefox do not throttle wheel events to rAF and so we would end up processing multiple wheel events within a single frame. We're about to experiment with a fix for this and we'll be looking closely at this metric.
Michal Mocny
Sep 14, 2023, 11:14:35 AM9/14/23
to Anthony Morris, Noam Rosenthal, web-vitals-feedback
Thank you for sharing!
Just to clarify: you used LoAF to find insights on Chrome.. Then, using those insights, created custom metrics that were cross platform (or just lab?), and that let you surface/address even larger issues (or at least are in progress)?
That's... Amazing!
Anthony Morris
Sep 14, 2023, 7:05:59 PM9/14/23
to Michal Mocny, Noam Rosenthal, web-vitals-feedback
Sorry, to clarify - we used our perceived frame duration metric (that just uses rAF to measure the time between frames) to measure the performance in the field. We haven't tried out LoAF yet.
Michal Mocny
Sep 15, 2023, 5:05:47 AM9/15/23
to Anthony Morris, Noam Rosenthal, web-vitals-feedback
Thanks for the clarification.
Was the new metric specifically useful here? Like, would just raf polling and taking number is drops have worked as well?
Cheers!
Anthony Morris
Sep 15, 2023, 7:15:48 AM9/15/23
to Michal Mocny, Noam Rosenthal, web-vitals-feedback
Here's some comparisons (my Dropped Frame % calculation is a little hacky and is just derived from mean frame duration: 1 - 16.6/mean_frame)
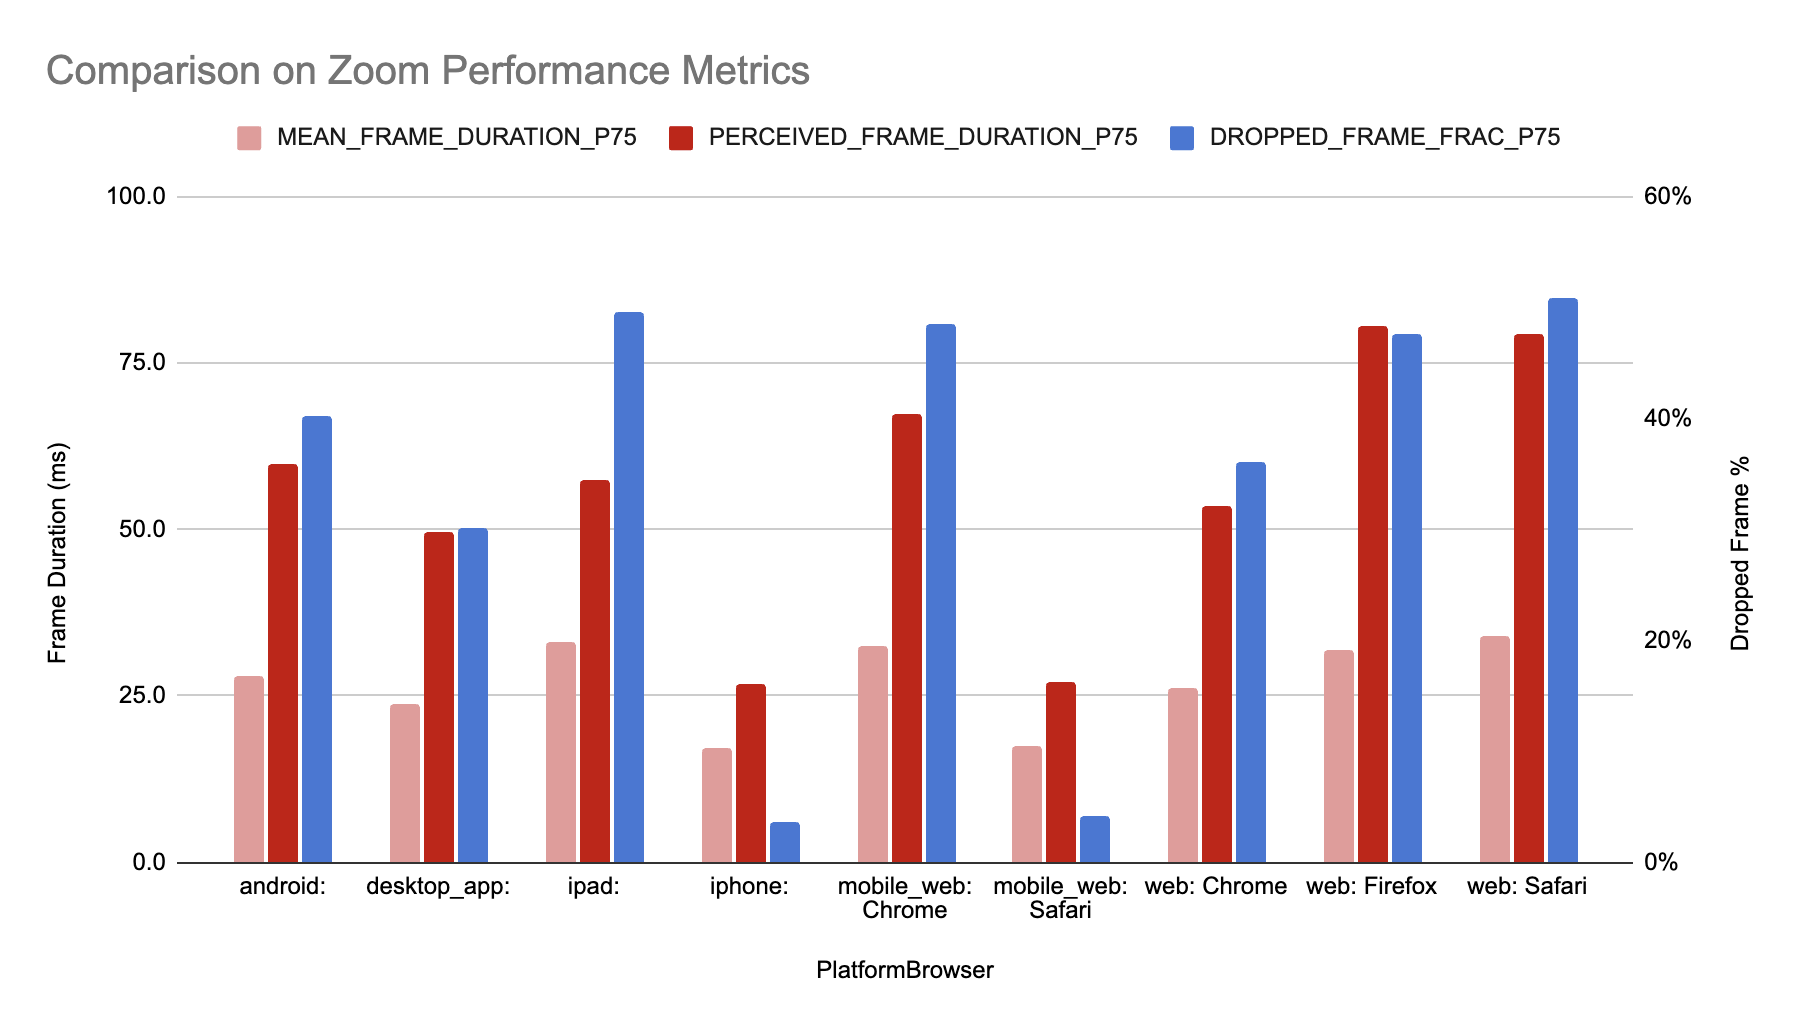
They are naturally reasonably correlated (it's mathematically very hard for them not to have some level of correlation) but there are some differences:
- Comparing webSafari vs webChrome: Perceived Frame Duration has greater relative difference (50% higher) than Dropped Frames Frac (42% higher) or Mean Frame Duration (30% higher).
- Comparing ipad vs webSafari: Mean Frame Duration & Dropped Frame % are very similar but Perceived Frame Duration is 37% higher
Ultimately this does come down to how much we think variability in frame duration matters in terms of perceived performance (and this will tell us whether it should be factored into the metric that we use). E.g., is consistent 33ms frames better than 16ms, 16ms, 67ms (both have mean of 33 and 50% dropped frames but perceived frame duration is much higher in the latter).
At the moment, I think we are getting some value by including variability in the calculation of perceived frame duration.
Michal Mocny
Sep 15, 2023, 8:31:52 AM9/15/23
to Anthony Morris, Noam Rosenthal, web-vitals-feedback
Thanks for the explanation.
On Fri, Sep 15, 2023 at 1:15 PM Anthony Morris <amo...@canva.com> wrote:
Here's some comparisons (my Dropped Frame % calculation is a little hacky and is just derived from mean frame duration: 1 - 16.6/mean_frame)They are naturally reasonably correlated (it's mathematically very hard for them not to have some level of correlation) but there are some differences:- Comparing webSafari vs webChrome: Perceived Frame Duration has greater relative difference (50% higher) than Dropped Frames Frac (42% higher) or Mean Frame Duration (30% higher).- Comparing ipad vs webSafari: Mean Frame Duration & Dropped Frame % are very similar but Perceived Frame Duration is 37% higherUltimately this does come down to how much we think variability in frame duration matters in terms of perceived performance (and this will tell us whether it should be factored into the metric that we use). E.g., is consistent 33ms frames better than 16ms, 16ms, 67ms (both have mean of 33 and 50% dropped frames but perceived frame duration is much higher in the latter).At the moment, I think we are getting some value by including variability in the calculation of perceived frame duration.

+1
Reply all
Reply to author
Forward
0 new messages