Pagespeed CLS of 0.001 vs 0.48 in GTmetrix
114 views
Skip to first unread message

janos csorik
Dec 21, 2021, 3:52:29 AM12/21/21
to web-vitals-feedback
Hello!
I am experiencing a strange CLS problem. PageSpeed gives my pages a CLS of 0.001 - but if i test the same page with Gtmetrix i get an CLS of around 0.48.
Which one is accurate?
Please check here:
https://www.vapori.ro/kit-vaporesso-gtx-go-40
Thank you in advance for any insight!
Csorik Janos
www.vapori.ro

Vipul Naik
Dec 21, 2021, 11:08:24 AM12/21/21
to janos csorik, web-vitals-feedback
Hi Janos,
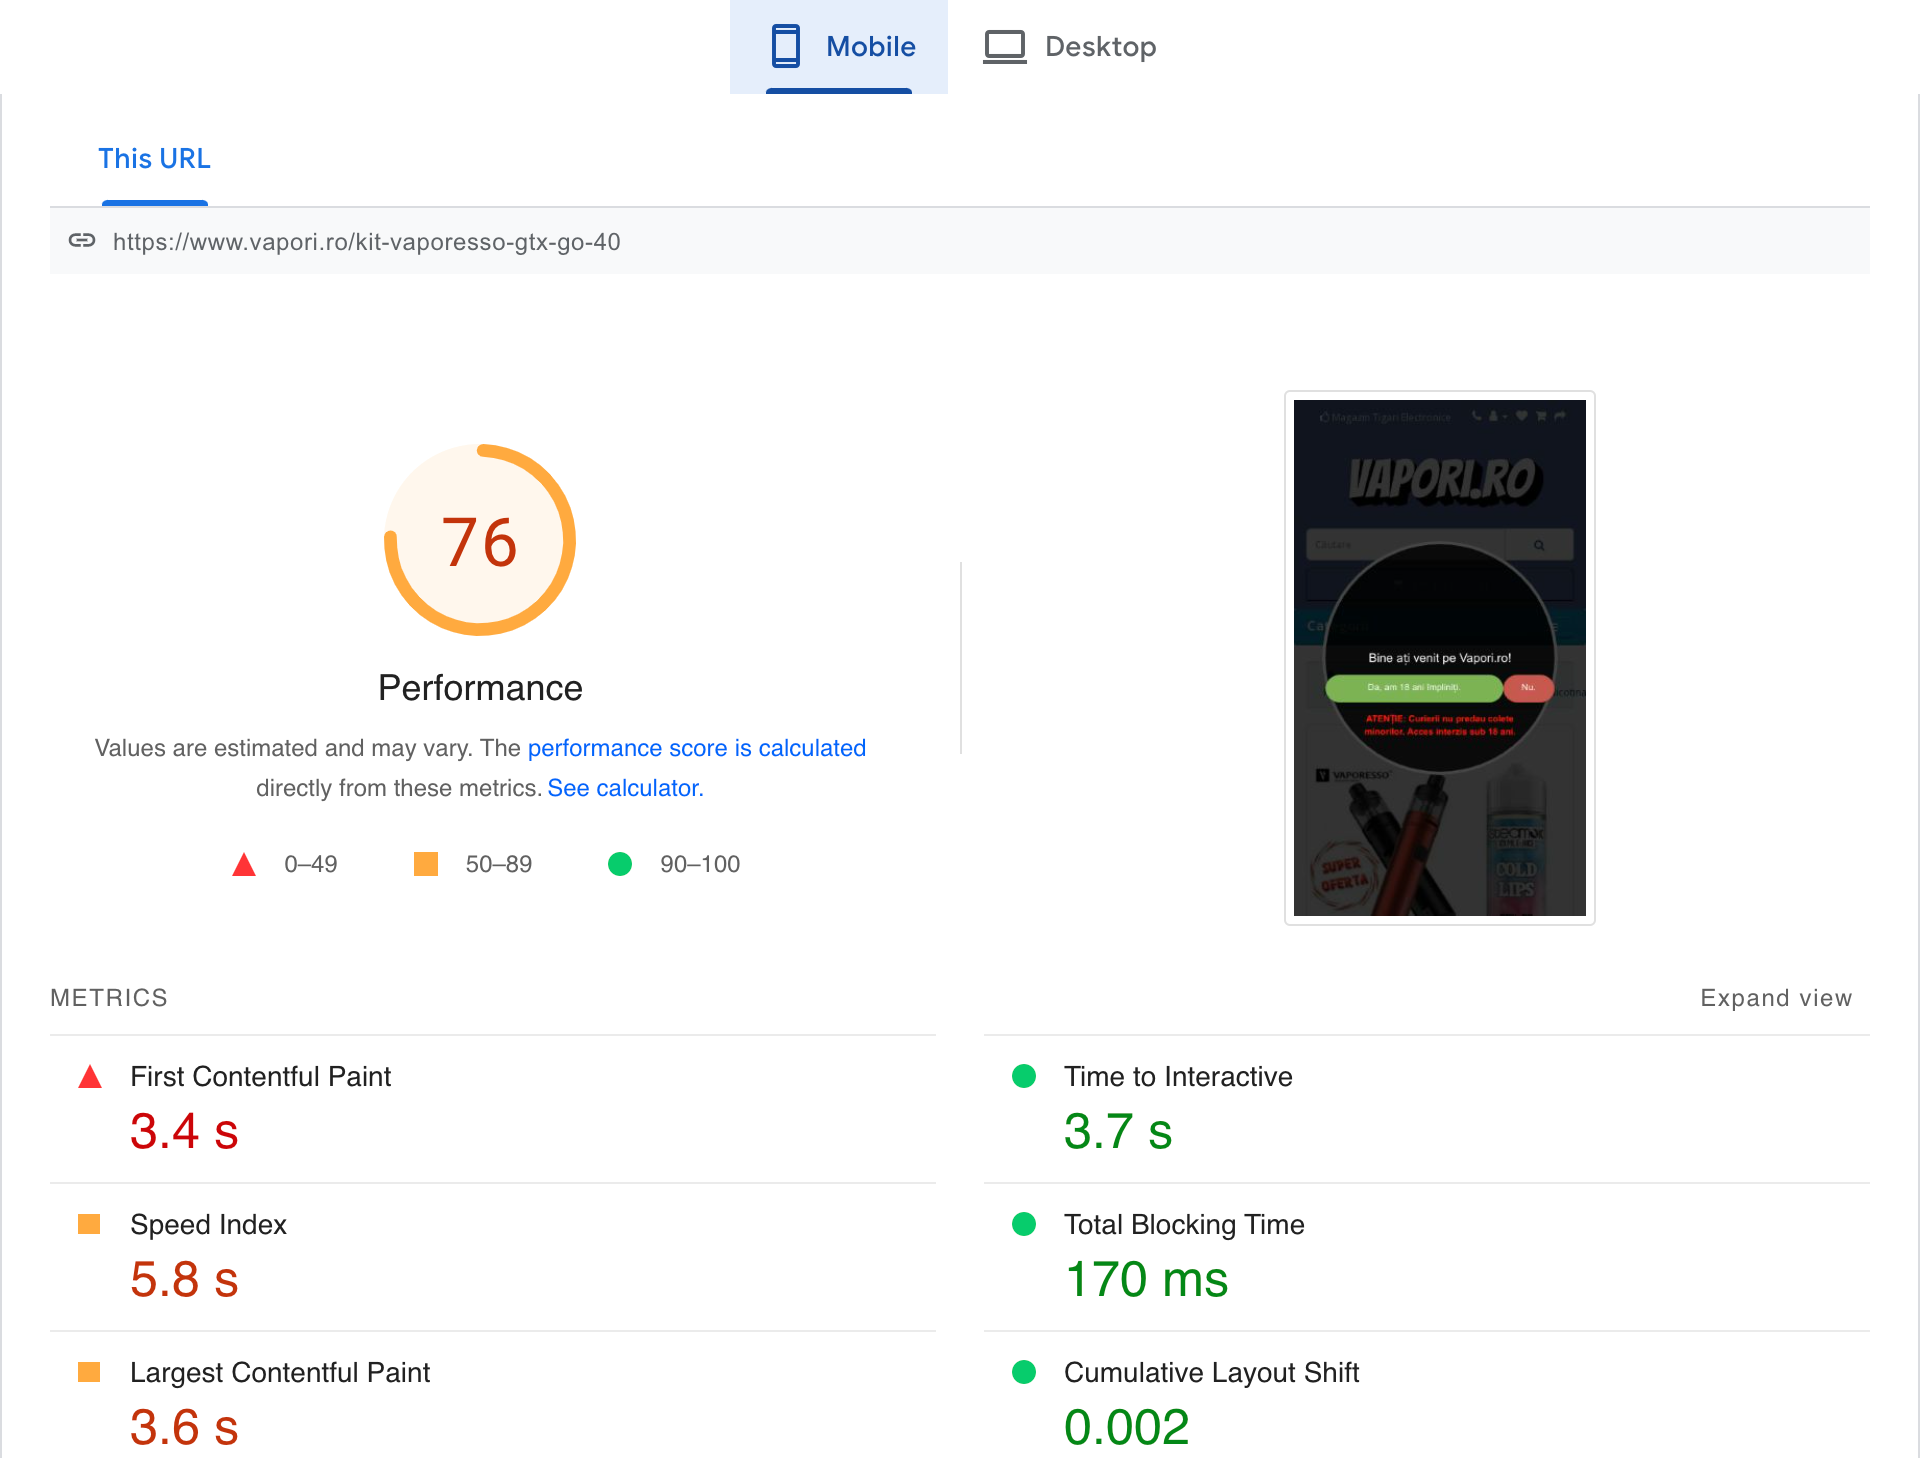
I think that PageSpeed Insights is not showing the CLS because it's getting stuck at the consent dialog, and the elements causing CLS are behind the consent dialog. If you go to https://pagespeed.web.dev/report?url=https%3A%2F%2Fwww.vapori.ro%2Fkit-vaporesso-gtx-go-40 and look at the screenshot along with the score you'll see that it's stuck at the consent dialog.
Mobile:
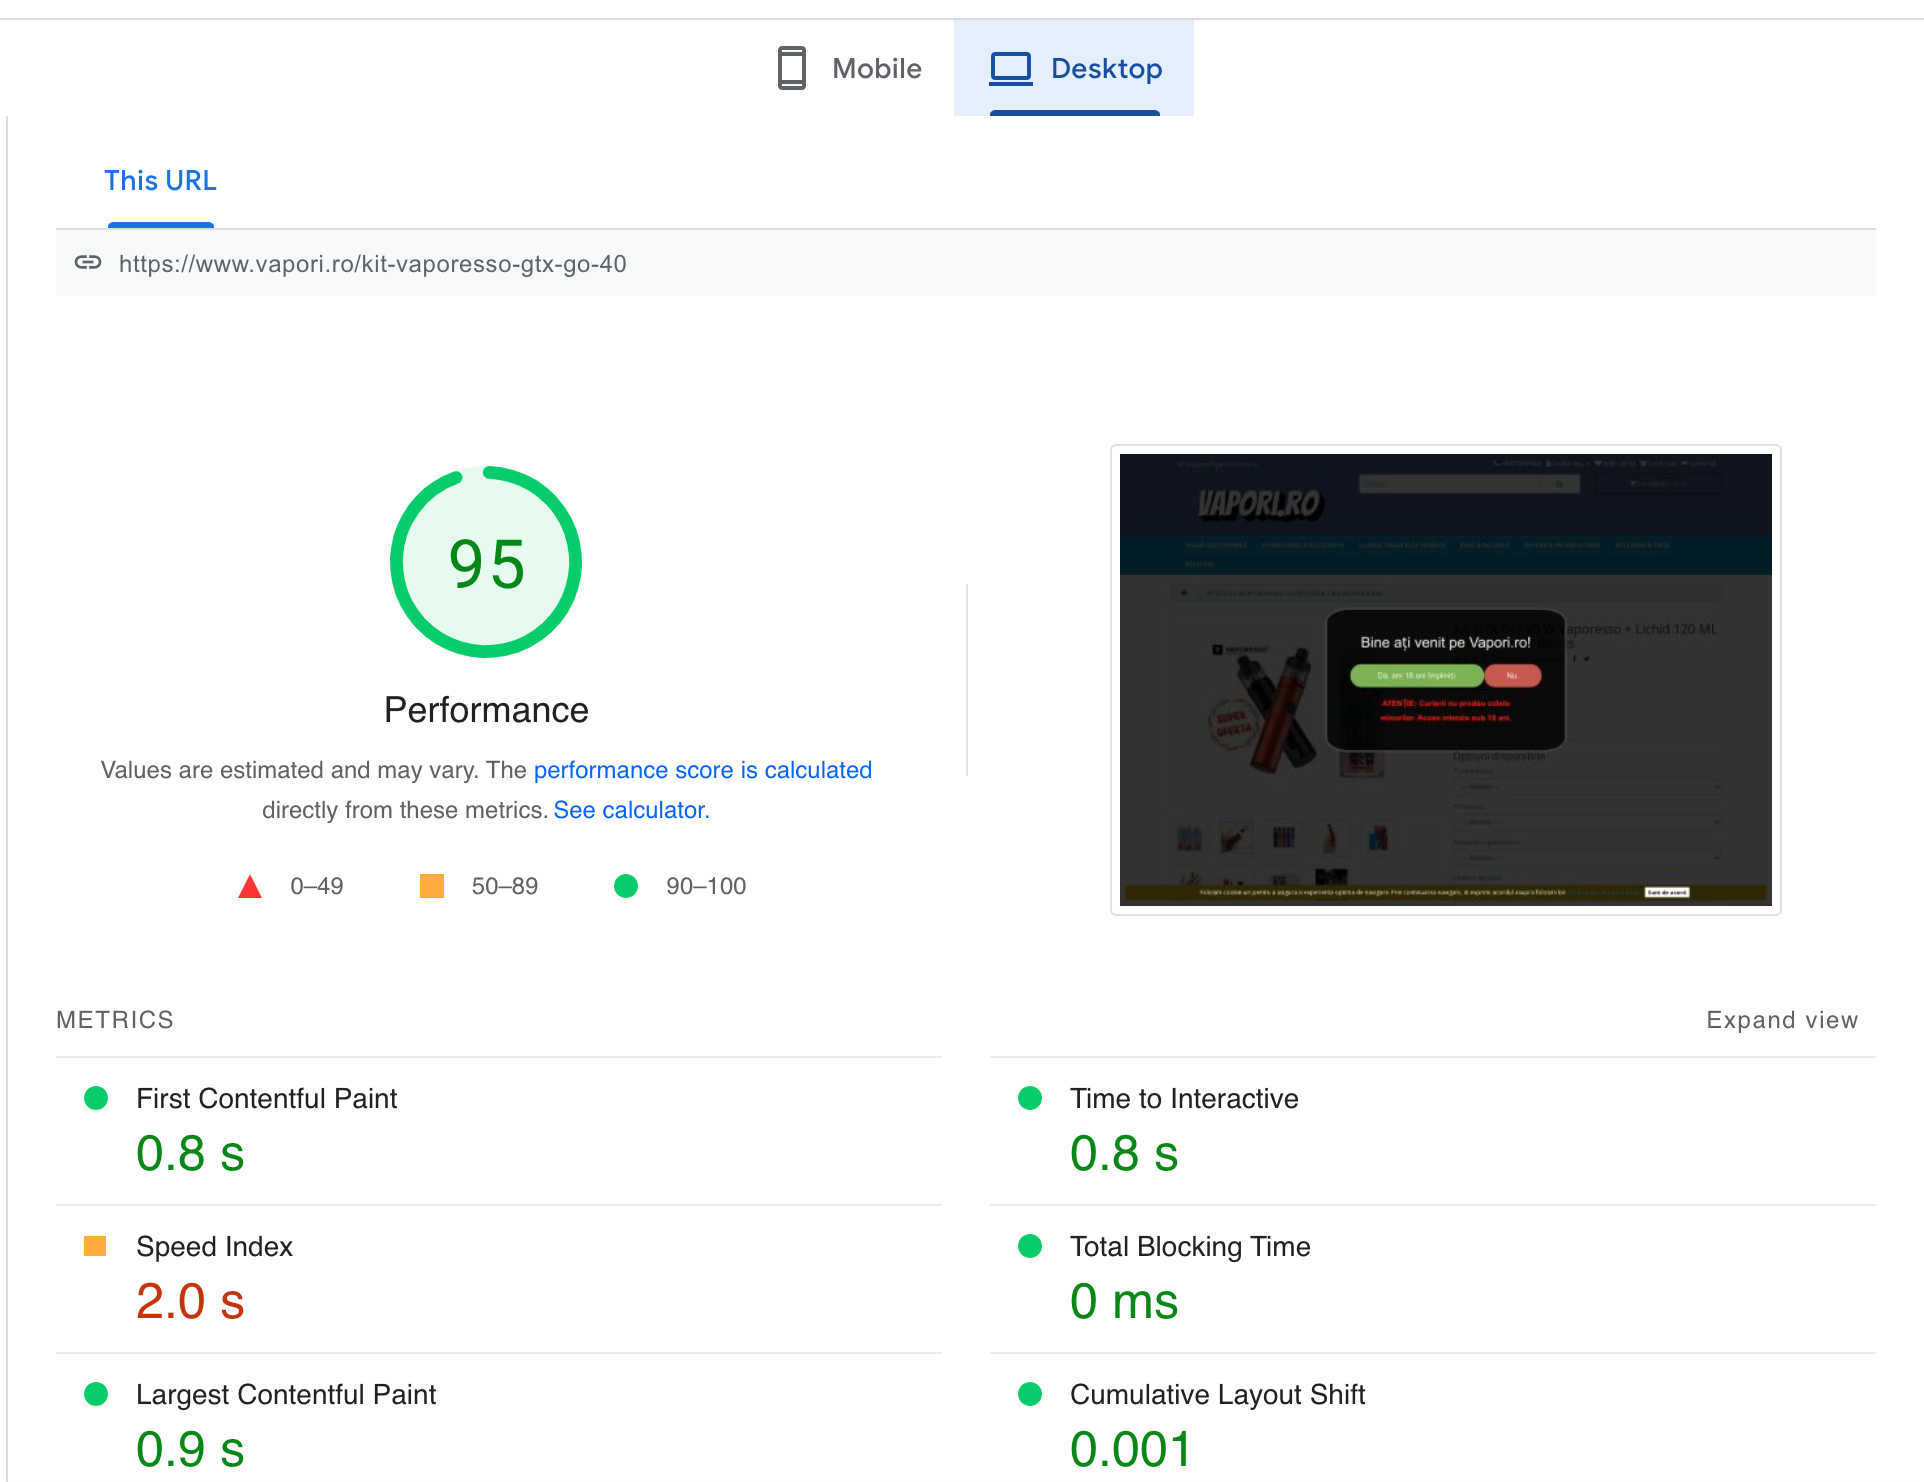
Desktop:
Interestingly when I run Lighthouse locally, even without accepting the consent dialog, I do see the CLS reported. But my Lighthouse version is 8.5.0, whereas PageSpeed Insights uses Lighthouse 9 which might behave differently.
When I reloaded the page after accepting the consent dialog, the actual CLS was easier to see. On desktop, this CLS is mostly from some resizing that occurs in the menu; the blue menu bar seems to resize from a larger to a smaller height early in the page load when it gets populated with text.
Here are more details on the CLS I logged using a (homegrown) web-vitals-debugger extension:
[top: https://www.vapori.ro/kit-vaporesso-gtx-go-40] 3821ms CLS 0.4747560882837928 scrollDepth 0 scrollDirection not-scrolled from:
[hefr] div.nav pull-right#top-links width:449->457,height:36->36,left:809->801,right:1258->1258,top:4->4,bottom:40->40
[vefb] div.col-sm-6 width:590->590,height:467->507,left:103->103,right:693->693,top:329->289,bottom:796->796
[hcsl] a.dropdown-toggle width:211->204,height:40->40,left:497->485,right:708->689,top:170->170,bottom:210->210
[vefb] div.container#product-product width:1170->1170,height:525->565,left:108->108,right:1278->1278,top:271->231,bottom:796->796
[hcsl] childof[2]:ul.nav navbar-nav width:189->184,height:40->40,left:840->817,right:1029->1001,top:170->170,bottom:210->210
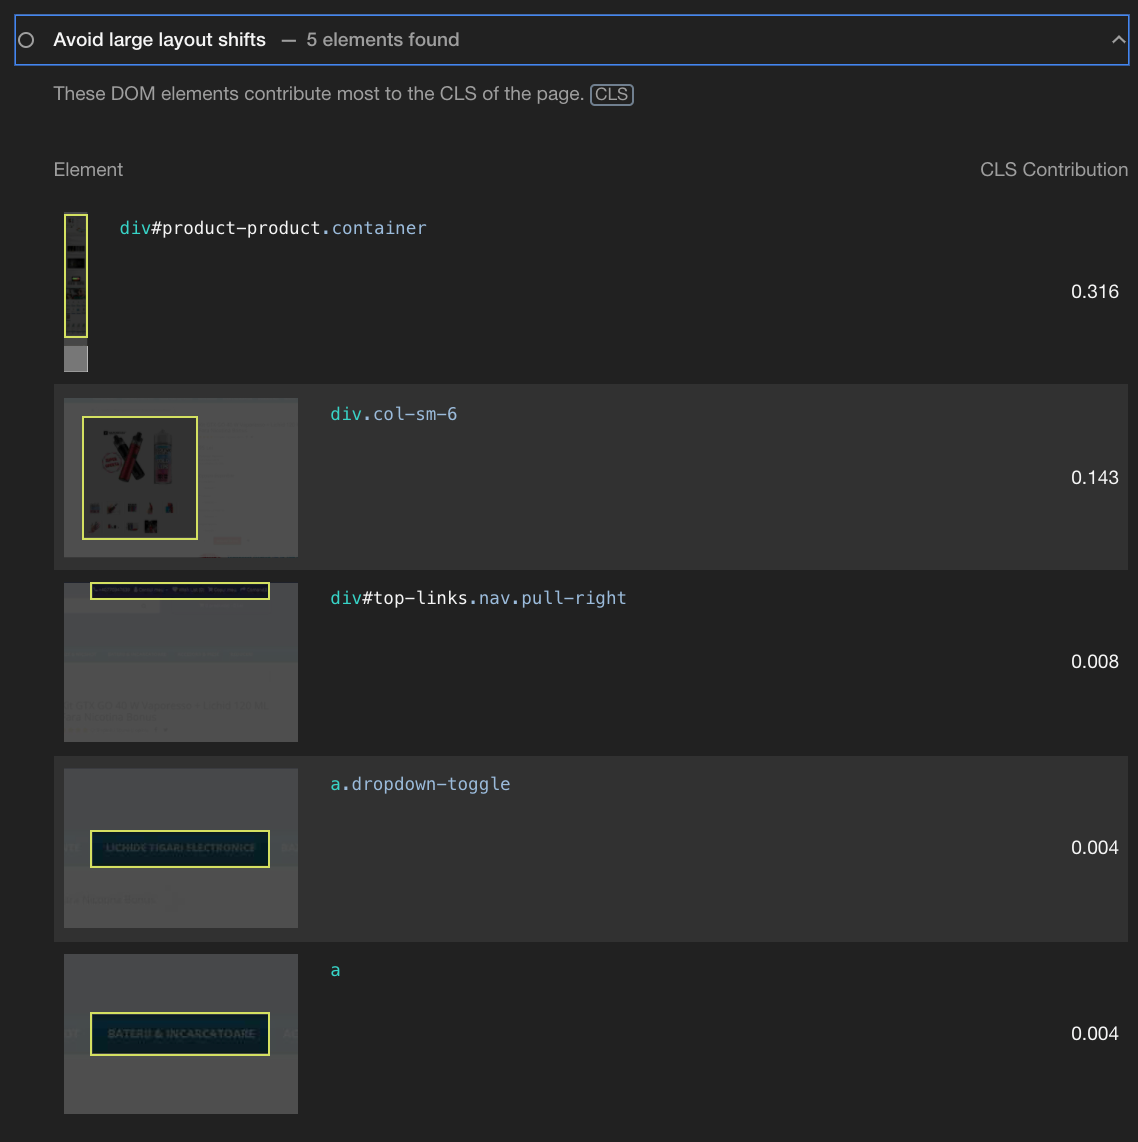
And here are the local Lighthouse diagnostics that give the same information more visually:
Vipul
--
You received this message because you are subscribed to the Google Groups "web-vitals-feedback" group.
To unsubscribe from this group and stop receiving emails from it, send an email to web-vitals-feed...@googlegroups.com.
To view this discussion on the web visit https://groups.google.com/d/msgid/web-vitals-feedback/1296e8bb-aff8-4bc5-81f3-9373cce73fban%40googlegroups.com.
Reply all
Reply to author
Forward
0 new messages