Skip to first unread message

xmetman
Jul 27, 2019, 12:38:58 PM7/27/19
to Weather and Climate
I've added a bit more code to analyse the heatwave thresholds so far this summer.
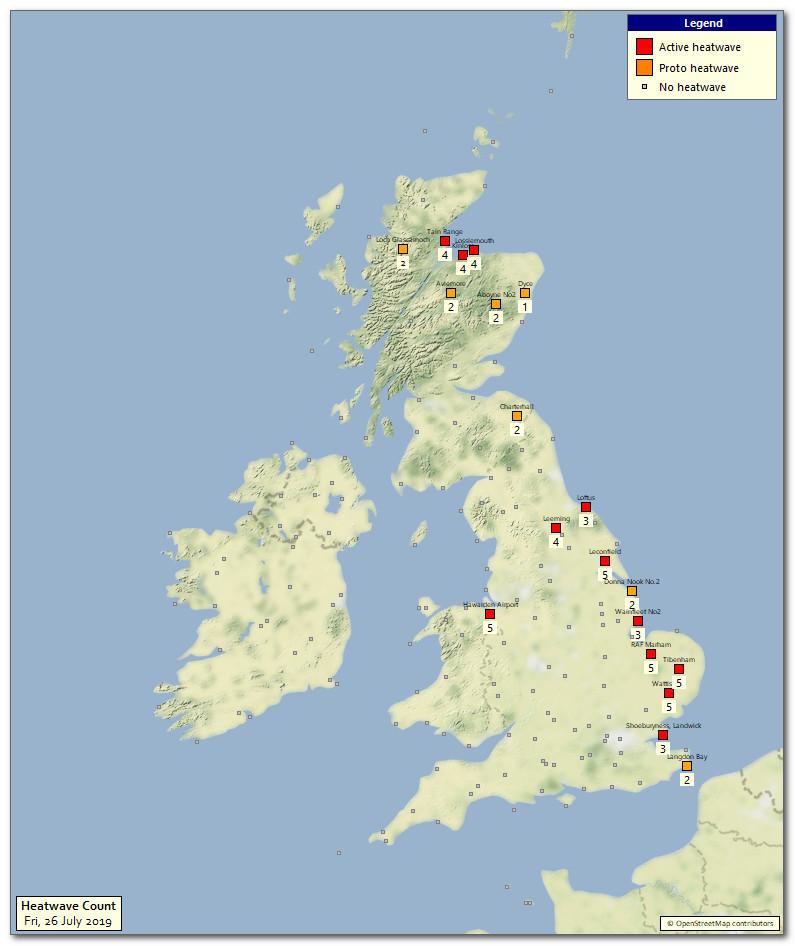
The UK map has remained the same and shows the position for yesterday, obviously today's maximum temperatures will end all of the active heatwaves marked in red. Please excuse the "proto heatwave" reference in the legend as I couldn't think of what to call it - maybe you have a better idea.
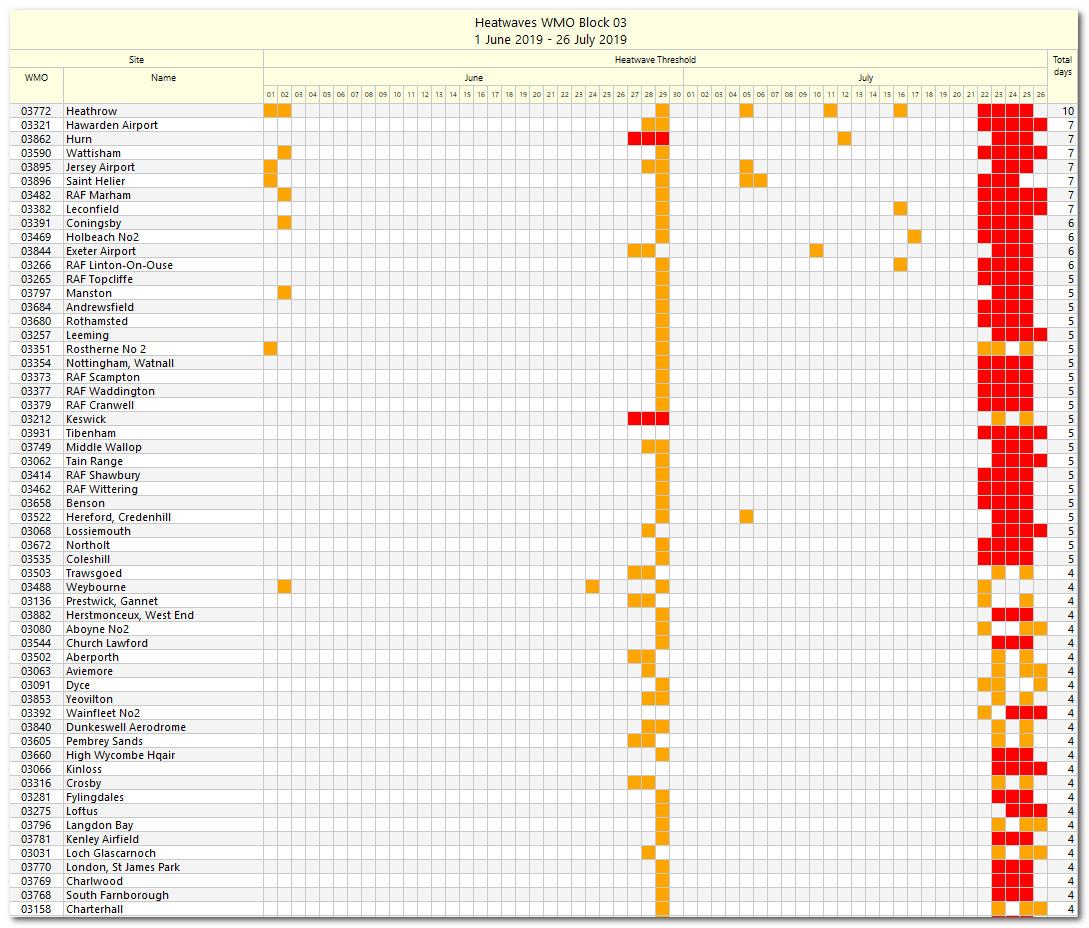
This heat map like grid (below) is the new bit and took a bit of putting together - hopefully its correct - it displays all days this summer that matched the Met Office heatwave threshold (orange), and those that lasted 3 days longer are heatwaves (red).
Although Heathrow has the highest count of both, it didn't have the longest running heatwave last week which was 5 days and occured at 5 sites mainly in eastern England.
The Moray Firth sites managed a creditable 4 days each.
I would like to add a bit more functionality to allow me to run this across Europe to see how the UKMO thresholds measure up to the European sites especially France.

Jack Harrison
Jul 28, 2019, 2:55:40 AM7/28/19
to Weather and Climate
I couldn't think of what to call it - maybe you have a better idea.
Perfectly good name - but it might not be the final "final" of 2019.
Jack
Reply all
Reply to author
Forward
0 new messages