
xmetman
Aug 9, 2019, 9:16:36 AM8/9/19
to Weather and Climate
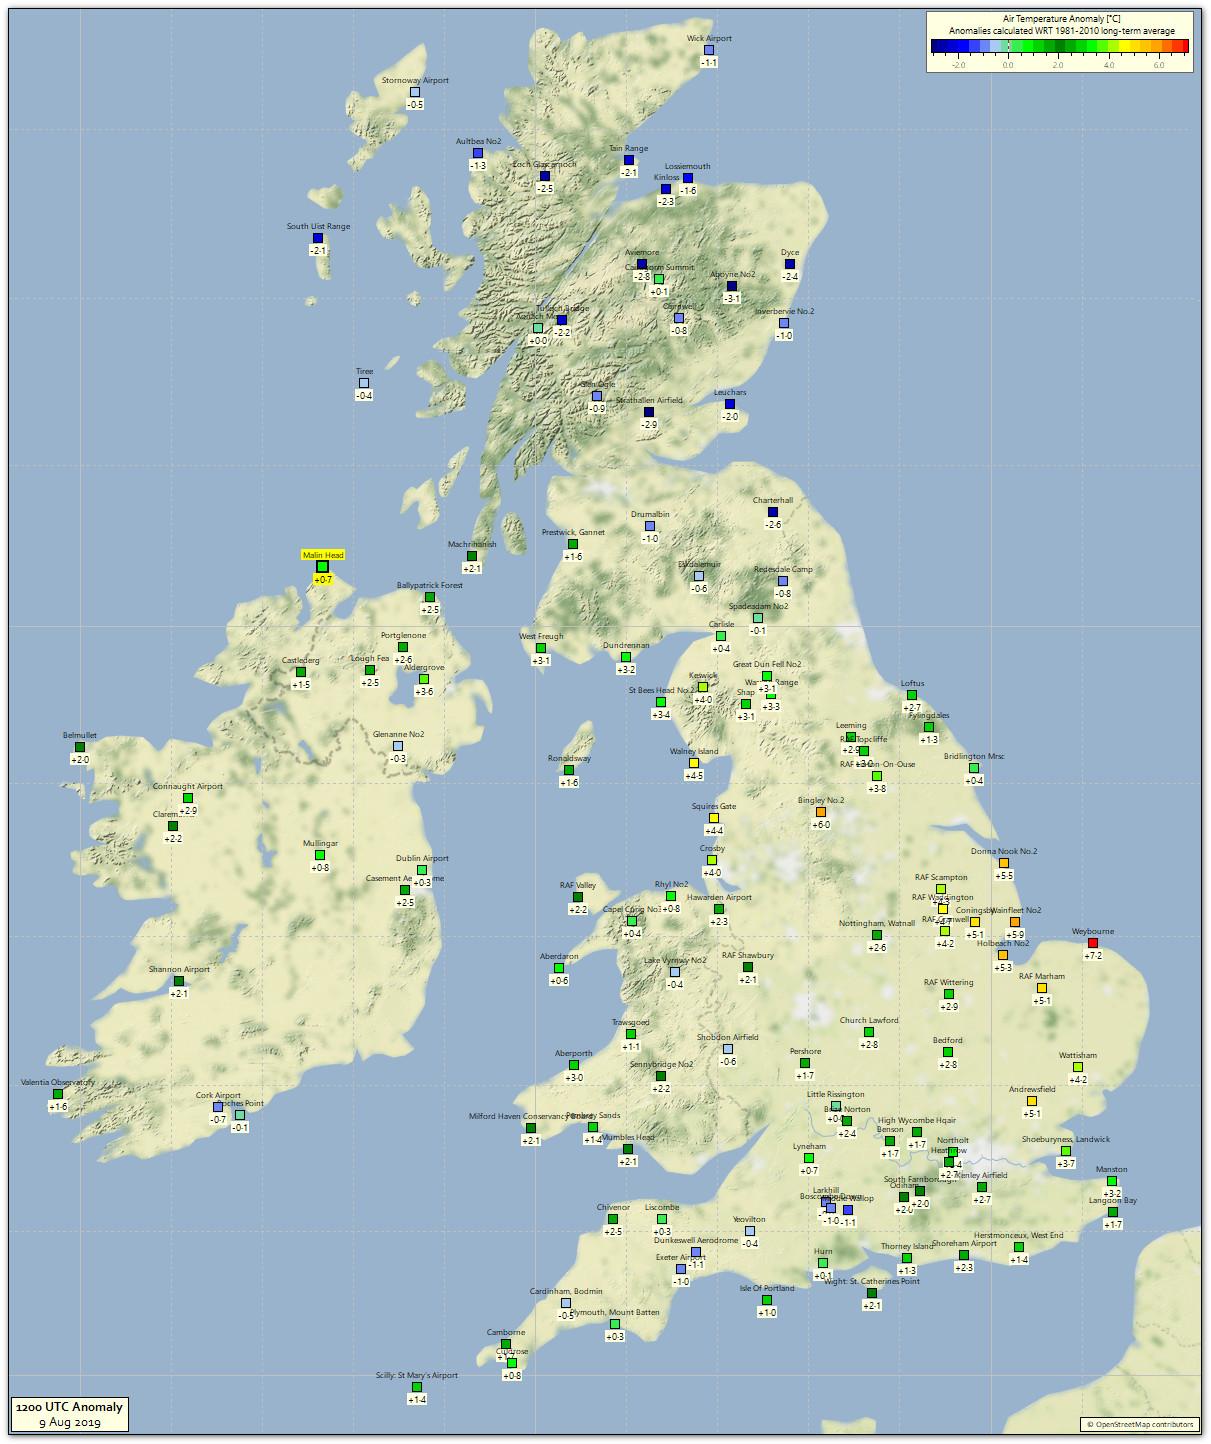
According to Ben Rich it's "feeling quite muggy out there" today - but it's not over northern areas.
Here there's a 20 knot easterly and moderate rain that's no doubt going to exacerbate the effect of the heavy rain that's fallen for a good part of the last week.
I do realise that it's difficult to fit everything into a 2 minute forecast, and I'm sure by the end of the day "16 to 26°C" might well cover it, but unlike eastern England where anomalies are 6 or 7°C above average at the moment, anomalies here are 2 or 3°C below average and "feeling quite muggy" doesn't come close to describing it, and that's where an anomaly chart like this would come into its own.
This post is proudly sponsored by "Get anomaly charts in weather forecasts".
xmetman
Aug 10, 2019, 8:58:33 AM8/10/19
to weathera...@googlegroups.com
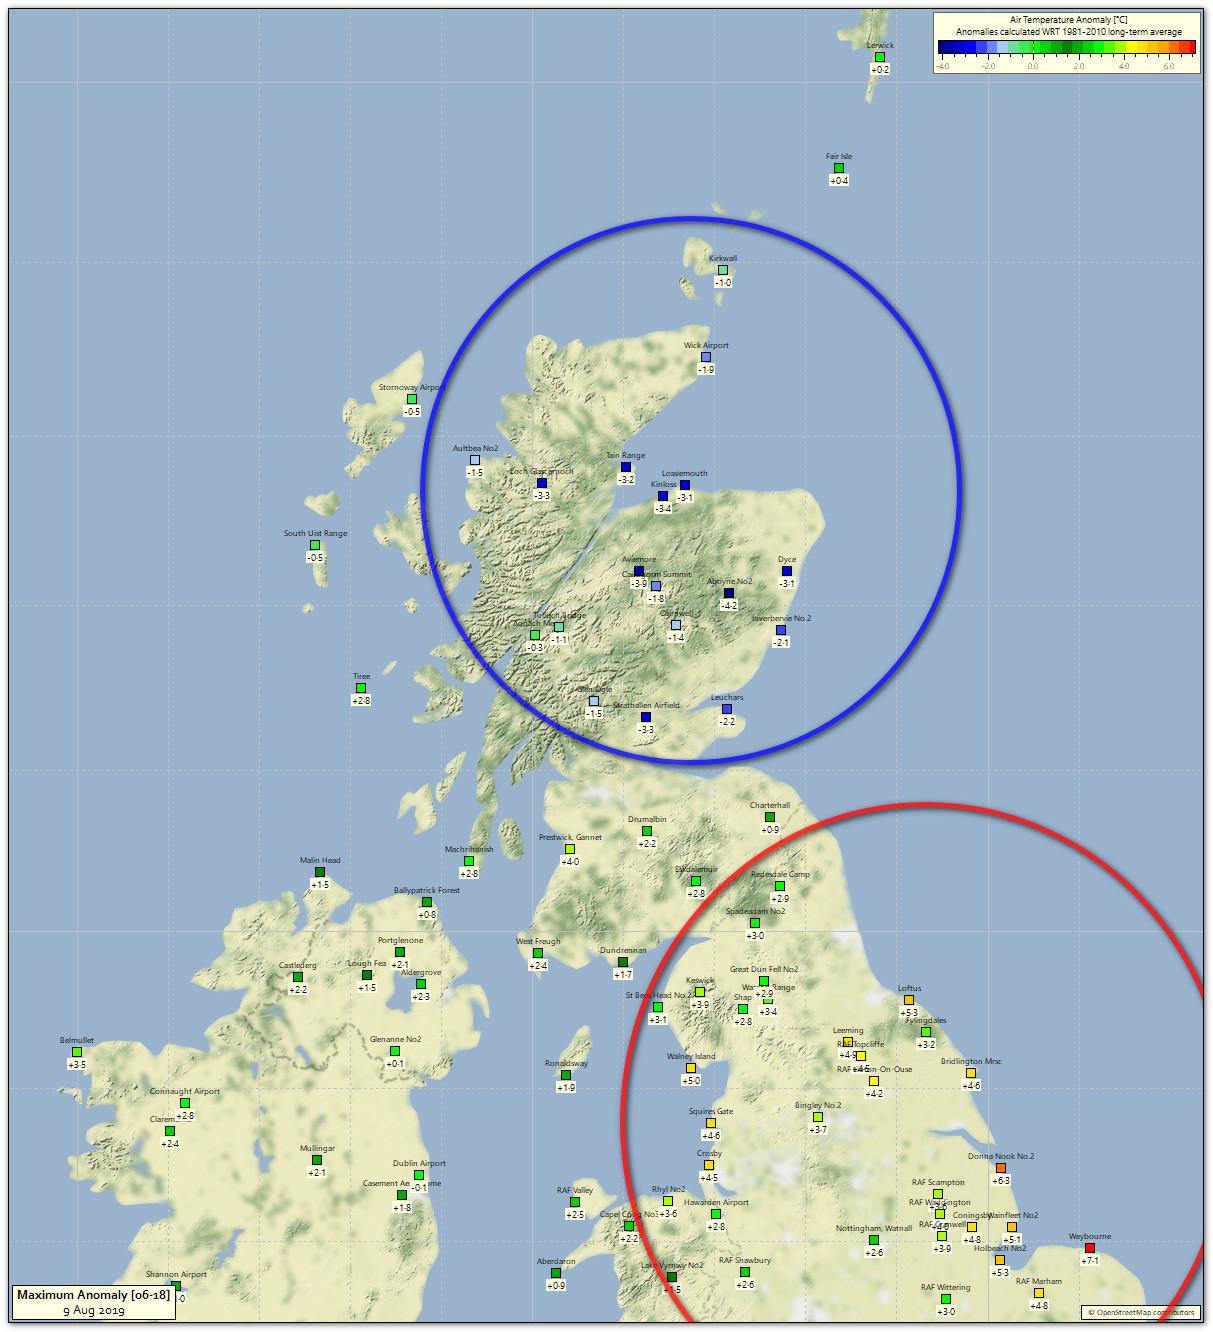
Looking back at yesterday's max temperature anomalies.
A ring of cold and a larger ring of warmth...
Reply all
Reply to author
Forward
0 new messages