
xmetman
Nov 3, 2016, 5:24:13 AM11/3/16
to weathera...@googlegroups.com
The NSIDC have just published their monthly news on Arctic sea ice, the growth of which so far this season they have called "sluggish".

To me they look a whole lot worse than sluggish.


Alastair B. McDonald
Nov 3, 2016, 5:42:00 AM11/3/16
to Weather and Climate
It appears more than sluggish on your chart because you are comparing it with 2015. If you compare it with 2012 it does not look quite so dramatic. But then which is correct?
xmetman
Nov 3, 2016, 7:15:41 AM11/3/16
to Weather and Climate
Alastair
I also plot the season 1982/83 because that's the one with the greatest extent in blue.
2012 was the year with the lowest summer minimum, but because we are in the winter season I display the year's with the greatest and lowest winter extent.
If you want to compare it directly with November 2012 I have copied the table from my latest blog below.
As you can see the 1st of November 2016 is 900,000 square kilometres lower than that of the 1st of November 2012, which is around 9.2% lower by area which is a massive difference.
As you can also see, it's also almost 2 million square kilometres lower than November 2014 as the graph shows.
My money is on an ultra low maximum this season, but I don't think I'd make much because at the moment it looks odds on.
Bruce.


Richard Dixon
Nov 3, 2016, 5:18:51 PM11/3/16
to Weather and Climate
This was also an interesting one, maybe related...

Alastair B. McDonald
Nov 3, 2016, 7:22:04 PM11/3/16
to Weather and Climate
Hi Bruce,
I have been watching the Arctic (and Antarctic) sea ice on these two charts:
http://nsidc.org/arcticseaicenews/charctic-interactive-sea-ice-graph/
https://ads.nipr.ac.jp/vishop/#/extent
They are not as dramatic as yours.
I think the reason is that, when you first started monitoring the sea ice, 2015 was the year with most ice but now it is 2012.
I have heard the Arctic SST is higher than normal and that may be the cause of the low extent.
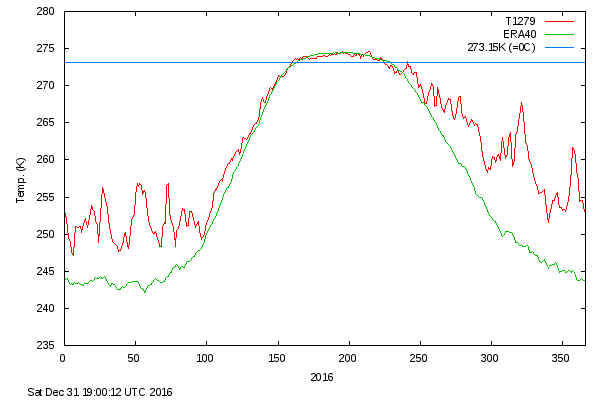
I have also been monitoring the air temperature north of 80 degs. by following this chart:
http://ocean.dmi.dk/arctic/plots/meanTarchive/meanT_2016.png
I can see a record low for sea ice next summer, perhaps even an ice free Arctic :-(

Paul Garvey
Nov 4, 2016, 3:46:04 AM11/4/16
to Weather and Climate
You could see it this year too, Alastair! It may, or may not happen, but current conditions, IMO, would have very little bearing. It will be the weather during the melt season which determines a record, on top of the downward trend of a warming Arctic, of course. NSIDC's Nov 2nd update would confirm what you've 'heard':
SSTs plus anomalously warm weather = a slow freeze though October.

Stephen Davenport
Nov 4, 2016, 8:18:19 AM11/4/16
to Weather and Climate
Thank you, Richard. That looks like a really good account to follow.
A lot of that warmth was pumped northwards, of course, by various tropical / ex-tropical storms alongside persistent amplified meridionality.
Stephen.
xmetman
Nov 4, 2016, 2:47:14 PM11/4/16
to Weather and Climate
Richard
Please follow my blog if you are not already doing so!
I blogged about that animation on Monday the 31st and then saw UKSW picked it up on the 1st of November.
Bruce.
Paul Garvey
Nov 4, 2016, 3:13:41 PM11/4/16
to Weather and Climate
You did. Bruce's blog is excellent and informative.
Alastair B. McDonald
Nov 4, 2016, 5:21:07 PM11/4/16
to Weather and Climate
Hi Bruce,
I now realise why I thought you chart was exaggerating the slow melting of the Arctic sea ice this year. Your chart has an x-axis in weeks per cm whereas the charts I have been watching have an x-axis in moths per cm. That does mean that it is easy to read from your chart how late the freeze up is this year - 2 weeks. I suspect that may have caught out the BBC Arctic Live Team.
http://www.bbc.co.uk/iplayer/group/b081z1pw
The freeze up a Churchill was only about to start when they had to leave.
Richard Dixon
Nov 4, 2016, 6:33:10 PM11/4/16
to Weather and Climate
Sorry Bruce - hard to follow everything, if I'm honest. You know as well as me we're cut from same cloth in our data enjoyment and I've read your blog pretty much since its inception...
Richard
Alastair B. McDonald
Nov 24, 2016, 4:16:14 PM11/24/16
to Weather and Climate
Bruce,
You were correct to flag up the slow recovery of the ice. The latest state of the Arctic is discussed here: https://www.theguardian.com/environment/2016/nov/22/extraordinarily-hot-arctic-temperatures-alarm-scientists
You were correct to flag up the slow recovery of the ice. The latest state of the Arctic is discussed here: https://www.theguardian.com/environment/2016/nov/22/extraordinarily-hot-arctic-temperatures-alarm-scientists
Reply all
Reply to author
Forward
0 new messages