Wazuh, but also elastic
704 views
Skip to first unread message

Matt Schenkman
Dec 29, 2021, 10:55:08 AM12/29/21
to Wazuh mailing list
Hi there,
We've been running our AIO setup connected to a few wazuh agents and that's been good. I'm now trying to connect our filebeat agents to it. I needed to first match the version of OSS wazuh/elastic 7.10.2. Once that was done, I am having issues connecting agents back to the server for elasticsearch logging.
Is there a process or trick to getting the certs to line up between server and agent? I must be missing something fundamental.
Feedback/help appreciated,
~Matt
John Soliani
Dec 29, 2021, 1:01:26 PM12/29/21
to Wazuh mailing list
Hi Matt,
Thanks for posting in our community!
First, let's take a look at the architecture schema to be on the same page.
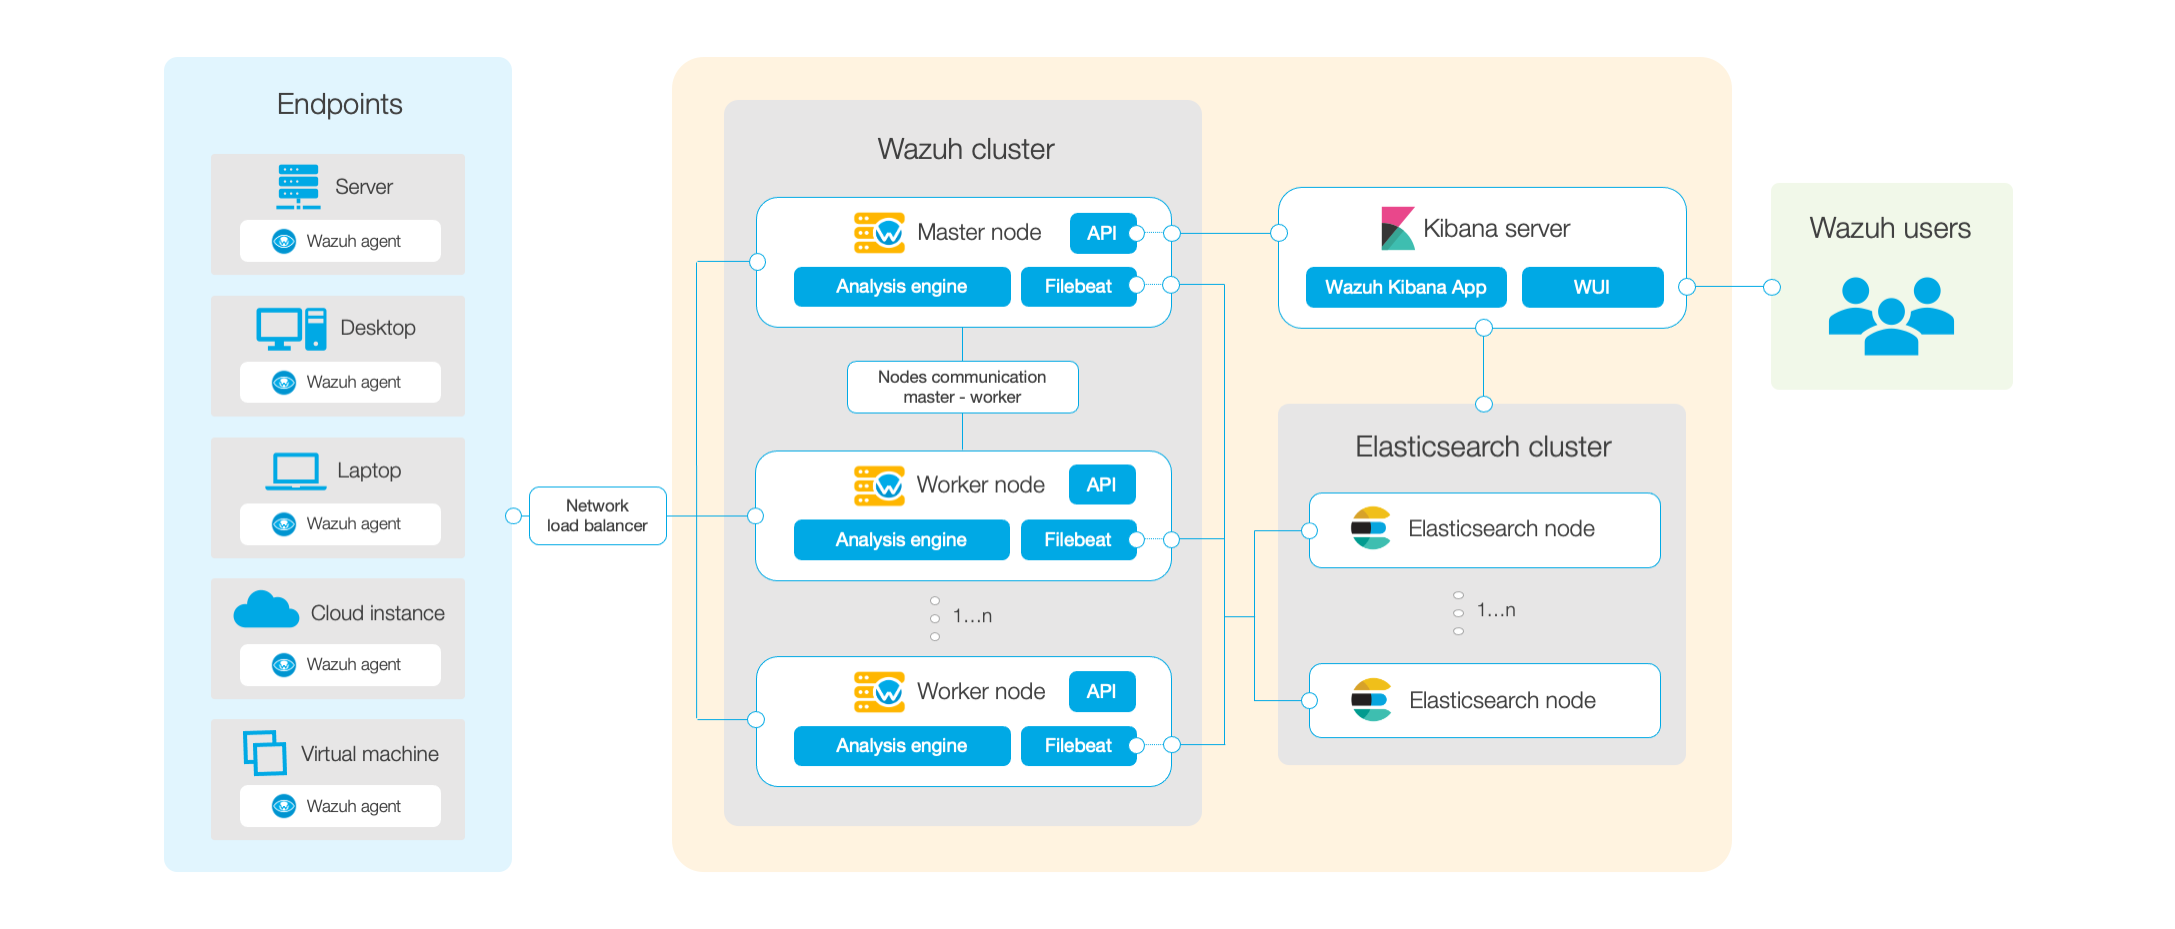
Here we can see Filebeat service (which parses data to Elasticsearch DB) is deployed in every Wazuh Manager. Its purpose is to send the generated alerts to Elasticsearch DB. Filebeat needs a valid certificate to communicate with Elasticsearch successfully.
The flow goes like this:
- In a Wazuh-agent/Device an event is generated -> Sent to a Wazuh Manager -> Processed/Analized -> If rules matched the alert is generated -> Filebeat send alert to the DB -> Elasticsearch <- KibanaUI -> Wazuh API (on the master).
Regards,
Thanks for posting in our community!
First, let's take a look at the architecture schema to be on the same page.
Here we can see Filebeat service (which parses data to Elasticsearch DB) is deployed in every Wazuh Manager. Its purpose is to send the generated alerts to Elasticsearch DB. Filebeat needs a valid certificate to communicate with Elasticsearch successfully.
Agents, on the other hand, are capable of sending any kind of logs to the manager using logcollector, they don't need Filebeat for that, nor valid certificates since they communicate via a secure-encrypted channel with the manager.
Elasticsearch generates the certificates for its nodes, Wazuh nodes (filebeat in wazuh servers) and Kibana certificates (the UI). Those are the only 3 components that need valid certificates to work together.
The flow goes like this:
- In a Wazuh-agent/Device an event is generated -> Sent to a Wazuh Manager -> Processed/Analized -> If rules matched the alert is generated -> Filebeat send alert to the DB -> Elasticsearch <- KibanaUI -> Wazuh API (on the master).
So the agent needs port 1515 for registration purposes and 1514 as a data channel to the manager. If you have the <address> variable properly set in ossec.conf, then restarting the service (systemctl restart wazuh-agent) should be enough. To check if the agent has a registration in the past, check file /var/ossec/etc/client.keys, if you see a line with a key at the end, is because it had a properly registration in the past. You could re-register the agent with: /var/ossec/bin/agent-auth -m <ManagerIP-Hostname> (if you use a registration password you should use -P <RegistrationPass> parameter too).
Please, let me know if you need further assistance here.
Please, let me know if you need further assistance here.
Regards,
John Soliani.-
Matt Schenkman
Dec 30, 2021, 8:57:00 AM12/30/21
to Wazuh mailing list
Hi John,
Thanks for this. We see that the syslog and logcollector wodles have been setup on Windows and Linux boxes already. In this instance, I'm not able to see application logs in real time. When compared to a WinLogbeat output from the same server, winlogbeat is in sync and real time.
Appreciate the feedback and I welcome your thoughts,
~Matt Schenkman
John Soliani
Jan 3, 2022, 7:29:11 PM1/3/22
to Wazuh mailing list
Hello Matt,

In the case you want to monitor logs from applications, you need to let the agents know about their location and format and the agents will report those logs in real-time with logcollector.
Here's the documentation: Log Collection.
To monitor the Application Windows EventChannel, you need to check that the agents have this configuration (can use centralized configurations -agent.conf- or edit the file ossec.conf manually). By default, this is enabled.
<localfile>
<location>Application</location>
<log_format>eventchannel</log_format>
</localfile>
<location>Application</location>
<log_format>eventchannel</log_format>
</localfile>
This way, we are telling Wazuh Windows agents to monitor all events from the Application channel. One way to check this is working is using ARCHIVES (disabled by default).
Edit the ossec.conf file in all Wazuh nodes (this configuration is not auto-synched) to enable the logall feature. We have 2 archives, the logall (which will use archives.log file) and the logall_json option that will use archives.json to show the logs with extra information, as decoders used, rules matched, etc. I would recommend logall_json since you'll get more information and not only the raw log so you'll be aware of the reaction of Wazuh when the logs arrived. You can enable both and compare them if you wish. Bear in mind, this will use much more disk space since you'll be storing all the events that are reaching the manager not only the alerts.
<logall>yes</logall>
<logall_json>yes</logall_json> After these changes, you must restart the managers to apply the changes (every Wazuh node that was altered). You can do it with systemctl restart wazuh-manager / service wazuh-manager restart.
Now if we "tail" the archives to track specific data, such as "tail -f /var/ossec/logs/archives/archives.json | grep '"EventChannel"' | grep Application" we will see in "real-time" all data in that manager and also, how the manager reacted to the logs (screenshot attached).
You can see, a second after the event in the agent was generated, the data in the manager and you can see last 2 events generated an alert level 3 and a level 5, the agent's name, id, ip, the decoder used was "windows_evenchannel", etc. Not all the events will produce an alert, only those who were matched against a stock/custom rule.
Let me know if this helped,
John.-
John.-
Matt Schenkman
Jan 4, 2022, 6:57:49 AM1/4/22
to Wazuh mailing list
Thanks John. We have been using Filebeat in conjunction with Wazuh for log monitoring. Since Wazuh can handle that, we will take into account the disk space and likely use this in preference over filebeat.
Thanks for your help!
John Soliani
Jan 4, 2022, 12:31:35 PM1/4/22
to Wazuh mailing list
You're welcome Matt, that's a good decision, leave Filebeat in the managers to load the alerts into Elasticsearch and the Wazuh agents to report events to the managers, no need to use any other app in the agents for that.
Do not hesitate to post your doubts in our community if you need to.
Do not hesitate to post your doubts in our community if you need to.
Regards,
John Soliani.-
John Soliani.-
Reply all
Reply to author
Forward
0 new messages