Anyone using Heartbeat-Elastic?
649 views
Skip to first unread message

Luke Lee
May 30, 2019, 10:15:32 PM5/30/19
to Wazuh mailing list
Hi all, I have some difficulties to get this works. Currently, all my services are running (Elasticsearch, Kibana, Wazuh-agent, Logstash, Heartbeat-elastic). But when I check on Kibana portal there is no data coming in or recorded under "Heartbeat". May I know how can I troubleshoot this?
Second question, how do I know which version of Heartbeat-elastic I am currently running on?
Thanks for your help.

Pablo Torres
May 31, 2019, 4:41:33 AM5/31/19
to Wazuh mailing list
Hi Luke,
You can set logging level to DEBUG and check in these logs what is wrong, to do that you have to add these lines to the Heartbeat configuration file (/etc/heartbeat/heartbeat.yml):
logging.level: debug
logging.to_files: true
logging.files:
  path: /var/log/heartbeat
  name: heartbeat
Now restart it and check those logs in order to find if there is any problem with Heartbeat.
About how to know which version of Heartbeat-elastic you are running, you can easily check it by typing:
/usr/share/heartbeat/bin/heartbeat version
And the output, in my case, looks like this:
heartbeat version 7.1.1 (amd64), libbeat 7.1.1 [3358d9a5a09e3c6709a2d3aaafde628ea34e8419 built 2019-05-23 13:07:32 +0000 UTC]
*Notice that I am using default paths for CentOS installation, you can find Heartbeat-elastic directory layout here: https://www.elastic.co/guide/en/beats/heartbeat/current/directory-layout.html
I will explain you how to configure Heartbeat-elastic to monitor Elasticsearch and Kibana services (any other services can also be monitored):
Edit your Heartbeat-elastic configuration file as follows: (this file can be found at /etc/heartbeat/heartbeat.yml)
replace ELASTIC_IP and KIBANA_IP with its IP
heartbeat.config.monitors:
  # Directory + glob pattern to search for configuration files
  path: ${path.config}/monitors.d/*.yml
  # If enabled, heartbeat will periodically check the config.monitors path for changes
  reload.enabled: false
  # How often to check for changes
  reload.period: 5s


#Monitor ELASTICSEARCH service every 10 secs
heartbeat.monitors:
- type: http
  urls: ["http://ELASTIC_IP:9200"]
  schedule: '@every 10s'


#Monitor KIBANA service every 10 secs
heartbeat.monitors:
- type: http
  urls: ["http://KIBANA_IP:5601"]
  schedule: '@every 10s'


setup.template.settings:
  index.number_of_shards: 1
  index.codec: best_compression


logging.level: info

processors:
  - add_host_metadata: ~
  - add_cloud_metadata: ~

output.elasticsearch:
  # Array of hosts to connect to.
  hosts: ["ELASTIC_IP:9200"]
If you are using logstash, replace that last block (output.elasticsearch) with this one:
output.logstash:
  #The Logstash hosts
  hosts: ["LOGSTASH_IP:5044"]
Now restart Heartbeat-elastic by typing:
systemctl restart heartbeat-elastic
If previous steps were succesfully followed, everything should be working as expected:
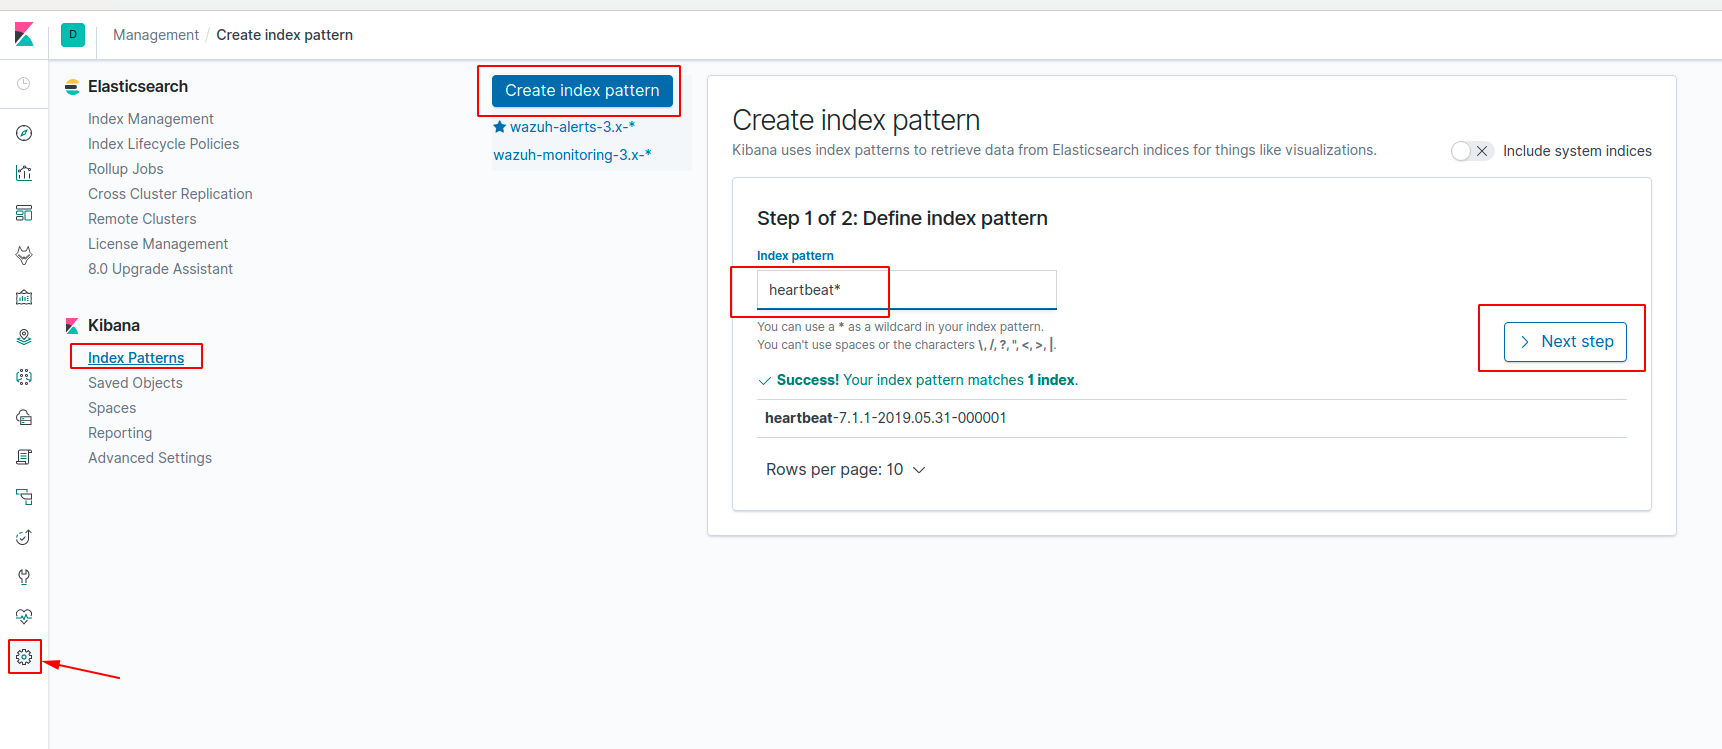
Now enter your Kibana app, go to Management -> Kibana Index Patterns -> Create Index pattern,
We have to create a pattern for Heartbeat-elastic indices, for example, heartbeat*, and click on next step. Then select the time filter field name and create the index pattern.
Now that we have created an index pattern for heartbeat indices, we can visualize the data generated by Heartbeat-elastic in our Kibana Discover.

I hope this is helpful for you, if you need anything else do not hesitate to ask again.
Regards,
Pablo Torres
Luke Lee
Jun 19, 2019, 4:55:06 AM6/19/19
to Wazuh mailing list
Thanks for showing the details, I have successfully launch that. Thanks
Reply all
Reply to author
Forward
0 new messages