Fundamentals of Wazuh | Qradar | Other SIEM
848 views
Skip to first unread message

Daniel
Nov 20, 2022, 10:31:10 AM11/20/22
to Wazuh mailing list
Hello Everyone,
I am new to WAZUH and have past experience working on QRadar. You are requested to help me out regarding the below-mentioned points:
1) Offenses | Alerts
Like QRadar we have an Offenses Tab that is triggered when a certain rule is matched, so in the case of WAZUH where we are going to find the Alerts tab or section.
2) Rules
Like QRadar we have a dedicated section for rule creation that enables us to create rules through GUI and enable them on the go, where we can find or test the rules on Wazuh?
3) Dashboarding:
Again Like QRadar we have a dedicated Tab for creating and modifying dashboards, In Wazuh is it possible to create custom dashboards?
4) Reporting:
In Wazuh is there a dedicated section on GUI to schedule reports?
5) Incident Ticketing:
Is there any section to manage ticket incidents or alerts?
Note: I have tried to explore Wazuh official documents but am confused where to start, you are requested to provide initial starting locations regarding rules, reports, alerts, rules, and creating, and managing Incidents tickets.
I would request to share the exact locations of Alerts, Rules, Dashboards, Reporting, and Tickets on Wazuh.
Regards,
Daniel

Openime Oniagbi
Nov 20, 2022, 1:07:53 PM11/20/22
to Wazuh mailing list
Hello Daniel,
Thank you for being so interested in Wazuh.
1. Offenses | Alerts
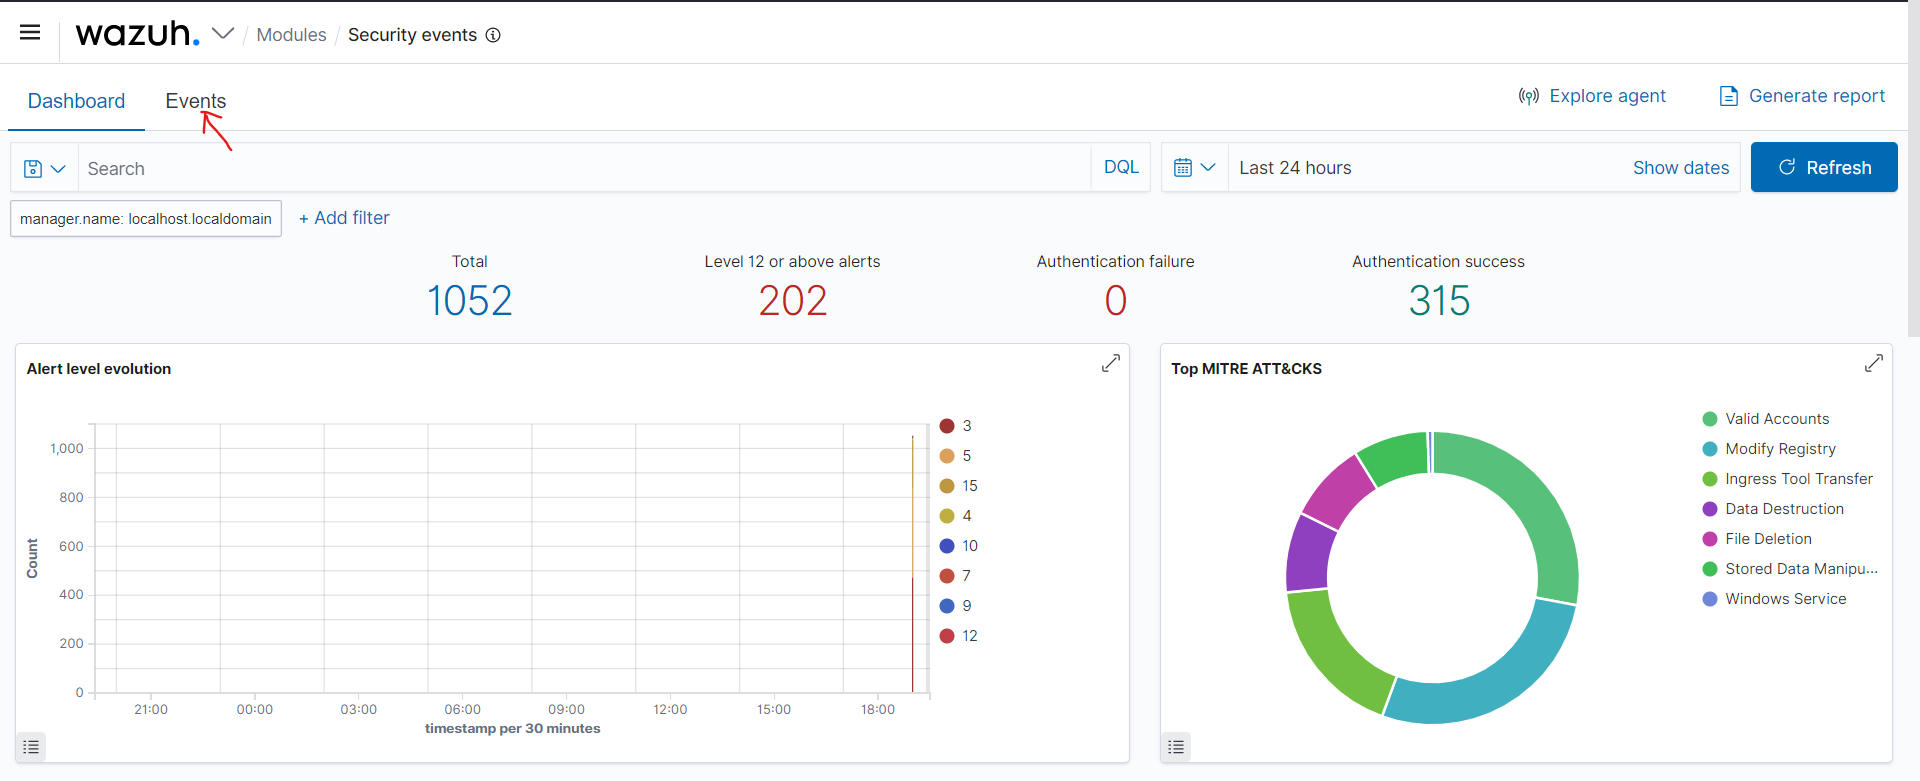
You can find alerts that are triggered in Wazuh from the Wazuh dashboard and the alerts.log file on the Wazuh server. To find the alerts on the Wazuh dashboard, click on Modules > Security Events. This will take you to the security events dashboard you see below. To view individual alerts, click on the Events tab.
Thank you for being so interested in Wazuh.
1. Offenses | Alerts
You can find alerts that are triggered in Wazuh from the Wazuh dashboard and the alerts.log file on the Wazuh server. To find the alerts on the Wazuh dashboard, click on Modules > Security Events. This will take you to the security events dashboard you see below. To view individual alerts, click on the Events tab.
2. Rules.
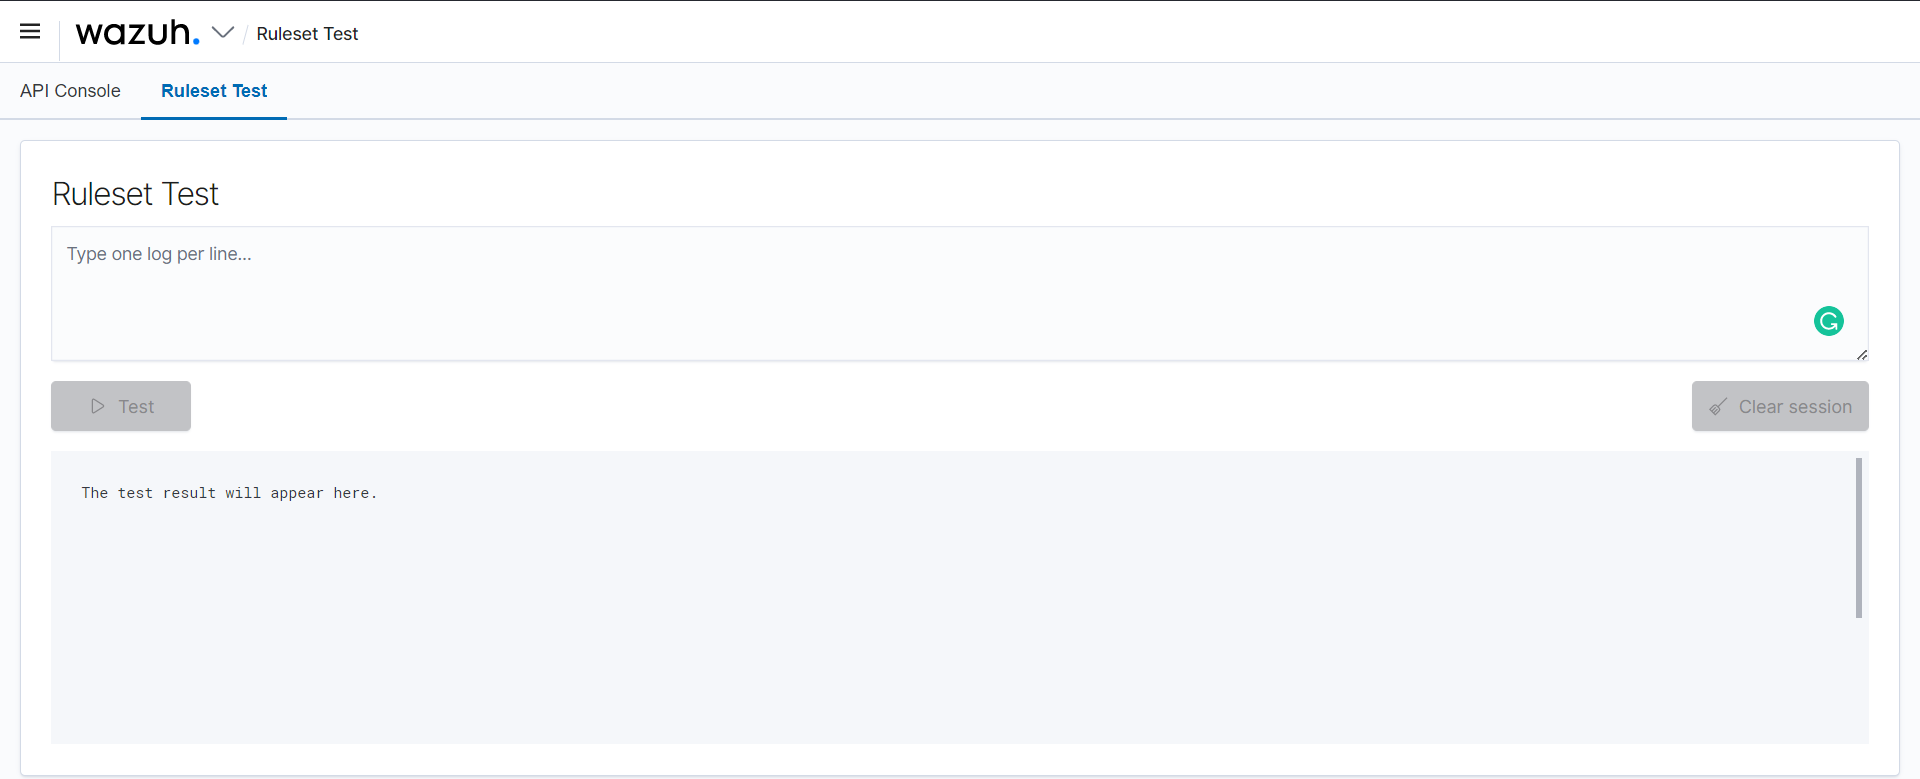
Wazuh comes with many rules by default which cover several technologies. Users are advised not to make changes to these files. However, you can view those rules using by clicking on the Wazuh logo and then clicking on Management > Rules. To add your own custom rules, use the last file on the list, which is local_rules.xml. The file is located on the Wazuh server at /var/ossec/etc/rules/local_rules.xml. You can edit that file to add your own rules. To learn more about the Wazuh ruleset, see this documentation. To test your rules, click on the Wazuh logo, click on Tools, and the Ruleset Test. Then you can add your log and click on Test. I have added a screenshot below.
Wazuh comes with many rules by default which cover several technologies. Users are advised not to make changes to these files. However, you can view those rules using by clicking on the Wazuh logo and then clicking on Management > Rules. To add your own custom rules, use the last file on the list, which is local_rules.xml. The file is located on the Wazuh server at /var/ossec/etc/rules/local_rules.xml. You can edit that file to add your own rules. To learn more about the Wazuh ruleset, see this documentation. To test your rules, click on the Wazuh logo, click on Tools, and the Ruleset Test. Then you can add your log and click on Test. I have added a screenshot below.
3. Dashboarding
Yes, you can create custom dashboards in Wazuh. This documentation explains the process for version 4.2, but the process is mostly the same also in Wazuh version 4.3.
4. Reporting
Using Wazuh, you can configure reports in the /var/ossec/etc/ossec.conf on the Wazuh server. You can view the reports on the dashboard by clicking on Management > Reporting.
5. Incident Ticketing
While you can investigate alerts on the Wazuh dashboard, there is no inbuilt ticketing solution for incidents. However, this blog describes how to integrate Wazuh with TheHive to achieve full incident ticketing and incident management workflow.
I have tried to answer all your questions, but if there is something I have missed or you want me to expand on, please let me know.
Regards.
Regards.
Daniel
Nov 22, 2022, 5:53:43 AM11/22/22
to Wazuh mailing list
Hello
openime and Team,
Thanks alot for your support, could you please elaborate on below mentioned points?
- Offenses | Alerts >>>>As instructed by you in-order to find the alerts on the Wazuh dashboard, click on Modules > Security Events. This will take you to the security events dashboard. To view individual alerts, click on the Events tab, my next query is what steps need to be taken in order to view just the raw events (Not alerts) ?
Openime Oniagbi
Nov 22, 2022, 6:39:19 AM11/22/22
to Wazuh mailing list
Hello Daniel,
To view raw events, even if they do not match a rule, you must enable the <logall> option.
To do so, log into your Dashboard and navigate through Wazuh>Management>Configuration>Edit Configuration and edit the line that says: <logall>no</logall> to <logall>yes</logall>
To view raw events, even if they do not match a rule, you must enable the <logall> option.
To do so, log into your Dashboard and navigate through Wazuh>Management>Configuration>Edit Configuration and edit the line that says: <logall>no</logall> to <logall>yes</logall>
Once you have done this, save the configuration, restart the manager and wait for logs to begin populating the archives.log file.
Alerts will be stored at /var/ossec/logs/alerts/alerts.(json|log) and events at /var/ossec/logs/archives/archives.(json|log).
You must create custom rules and decoders to see the logs in the wazuh interface.
Check out this documentation.
Regards.
Daniel
Nov 24, 2022, 3:55:24 PM11/24/22
to Wazuh mailing list
 Hello Openime and Team,
Thanks for your response, I have referred the documentation and have few concerns as mentioned below:
1) Wazuh-Agent for Windows that is already deployed and installed on my monitored host ( In My case) isn't capable to collect and forward raw events to Wazuh Manager ?
2) I am unbale to find the relevant section about how to view, collect and create rules in-order to view non-alerts events on UI.
Further I have make some changes while following the document as per provided SC:
Could you please elaborate the steps because like other SIEM solutions there is very easy way to analyze non-alert events.
Regards
Daniel Yasin
Information Security Analyst
Openime Oniagbi
Nov 25, 2022, 9:18:53 AM11/25/22
to Wazuh mailing list
I am answering your queries below.
1. The wazuh agent can capture and forward raw events to the Wazuh manager.
1. The wazuh agent can capture and forward raw events to the Wazuh manager.
2. Currently, you can not find non-alert events on GUI. You can find them in the /var/ossec/logs/archives/archives.log and /var/ossec/logs/archives/archives.json files on the Wazuh server. You must create decoders and rules for the raw events to see them in the GUI.
Regards.
Daniel
Dec 4, 2022, 3:49:15 PM12/4/22
to Wazuh mailing list
Hello openmine,
Hopefully you are doing well, please refer to your earlier provide details regarding Dashboarding and confirm if is it the only way of creating dashboards using Kibana, can't we create it using Wazuh itself, IF YES then please assist.
"3. Dashboarding
Yes, you can create custom dashboards in Wazuh. This documentation explains the process for version 4.2, but the process is mostly the same also in Wazuh version 4.3."
Openime Oniagbi
Dec 5, 2022, 4:27:29 AM12/5/22
to Wazuh mailing list
Hi Daniel,
The latest versions of Wazuh do not use Kibana but instead the Wazuh dashboard. This dashboard is a component of Wazuh, and you can use it to create dashboards using similar steps to what is in the documentation I sent.
Regards.
The latest versions of Wazuh do not use Kibana but instead the Wazuh dashboard. This dashboard is a component of Wazuh, and you can use it to create dashboards using similar steps to what is in the documentation I sent.
Regards.
Daniel
Dec 6, 2022, 5:31:27 PM12/6/22
to Wazuh mailing list
Hello Opemine,
Thanks for getting back, I think we are confusing the case as I am able to create a dashboard using Kibana, not the Wazuh component "Dashboard". You can refer attach snapshot as a reference. I would request to re-verify the steps involved.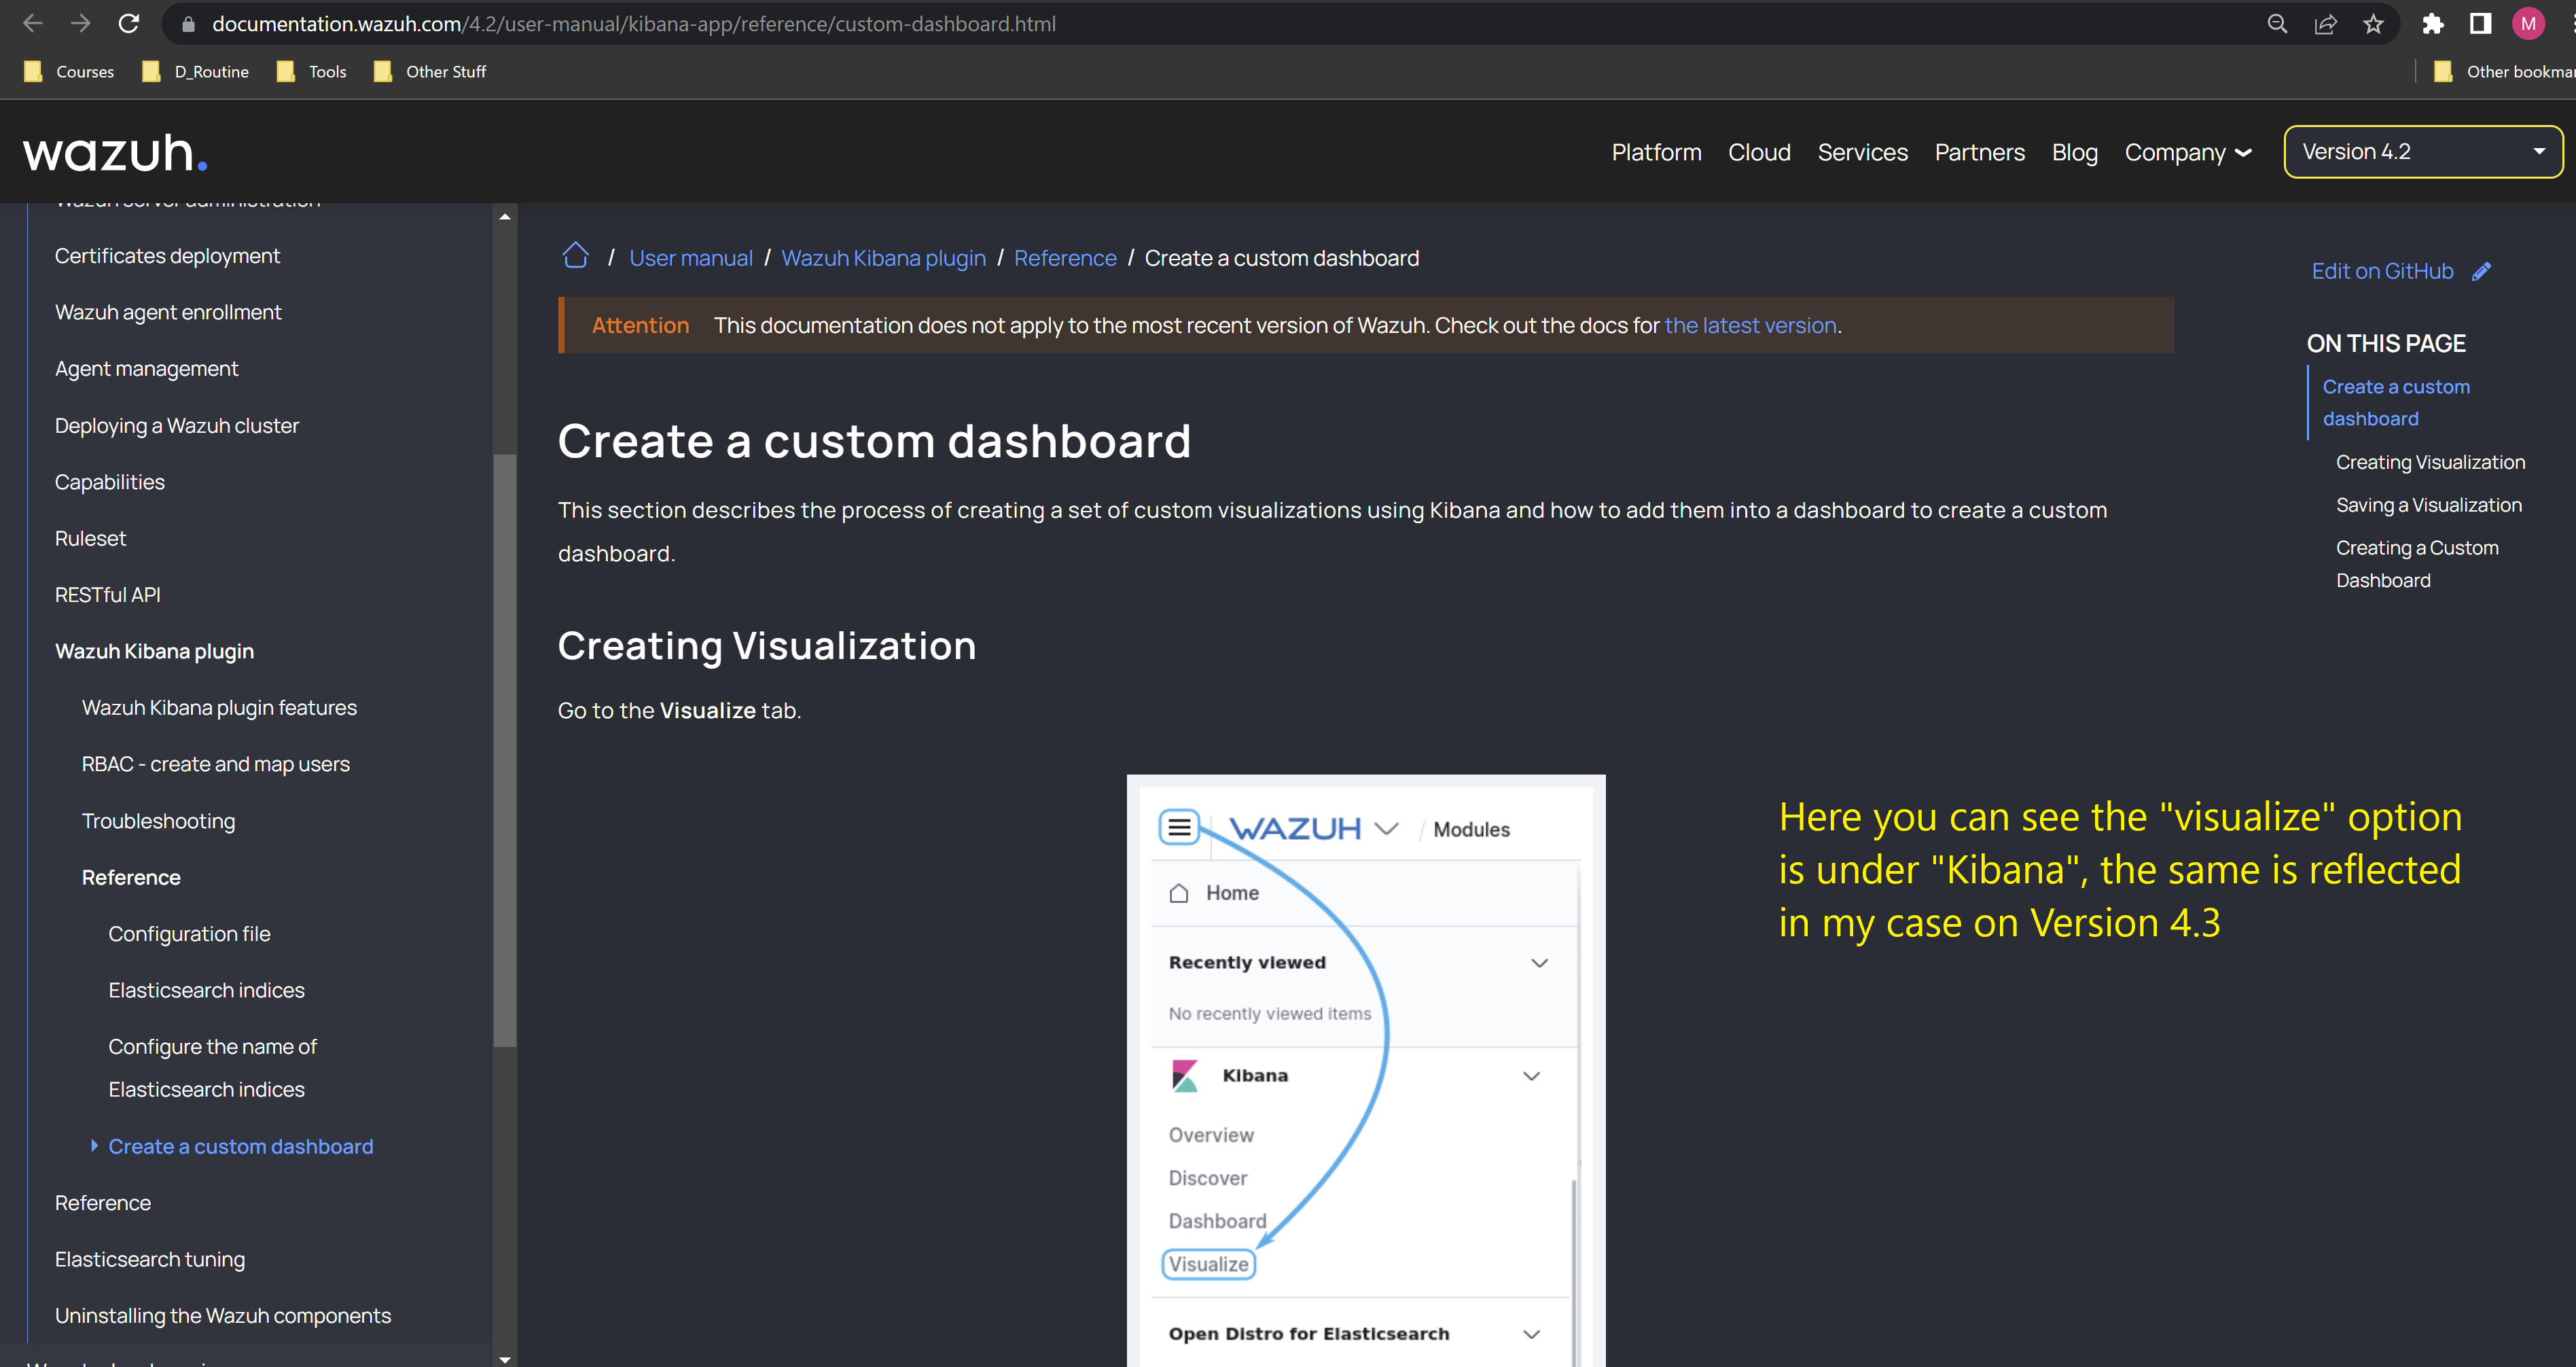
Openime Oniagbi
Dec 7, 2022, 3:56:02 AM12/7/22
to Wazuh mailing list
Okay, that's fine.
That means you have installed 4.3 with Elastic Stack.
That means you have installed 4.3 with Elastic Stack.
MUHAMMAD DANIYAL
Dec 7, 2022, 11:29:50 AM12/7/22
to Openime Oniagbi, Wazuh mailing list
Yes that's the case.
So now what's your final say on it for my case ?
Having wazuh 4.3 with elastic stack the only way to create dashboard is through kibana ?
--
You received this message because you are subscribed to a topic in the Google Groups "Wazuh mailing list" group.
To unsubscribe from this topic, visit https://groups.google.com/d/topic/wazuh/_reE3n6PgGc/unsubscribe.
To unsubscribe from this group and all its topics, send an email to wazuh+un...@googlegroups.com.
To view this discussion on the web visit https://groups.google.com/d/msgid/wazuh/bcc0d3bf-5639-4cac-aab2-3ca03c1fd2adn%40googlegroups.com.
Openime Oniagbi
Dec 7, 2022, 11:30:30 AM12/7/22
to Wazuh mailing list
Yes, it is.
Reply all
Reply to author
Forward
0 new messages