Wazuh Logcollector using 100% CPU usage
1,145 views
Skip to first unread message

Jake Bell
Dec 2, 2022, 2:05:12 PM12/2/22
to Wazuh mailing list
Hi All,
First off, just want to say thanks for the amazing product. I have this rolled out to about 60 servers so far and this is the first hitch I've run into that I couldn't figure out myself. I'm hoping someone can point me in the right direction to troubleshoot this. My company hosts many applications in Amazon Linux 2 ARM64 ECS clusters. I have the Wazuh agents installed on the host EC2 instances and it works fine everywhere except for one server. All the systems use the same base AMI, so they should be identical, but here we are :) On this one server it works fine for a few days and then something changes...
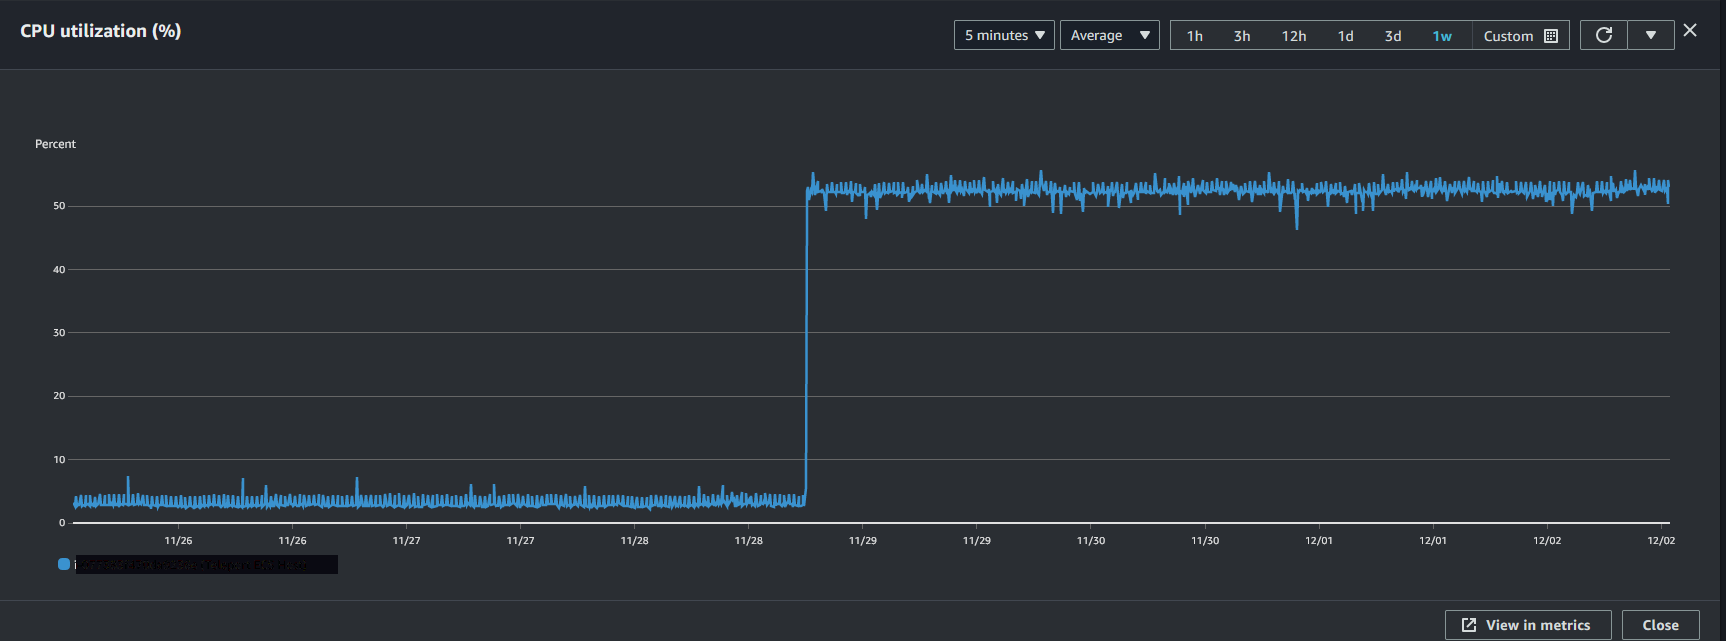
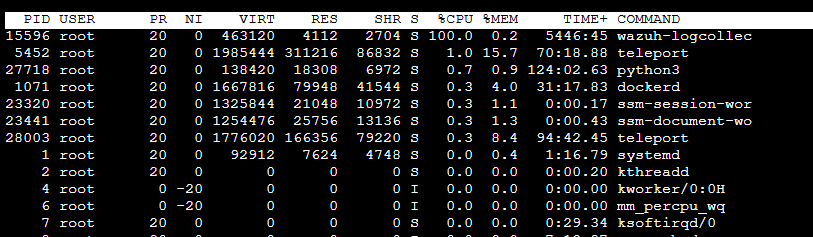
If I login to the box and view processes it shows that the log collector is spinning at 100%
If I reboot the server or the wazuh-agent it will fix itself for a few days but eventually breaks again. I've even tried redeploying the server and get the same result.
I checked the ossec.log file already and it looks identical to servers that don't have these issues. I looked at the log files Wazuh is monitoring and they don't seem overly large or active. No more so then any of my other systems anyways. Only thing I can think of is that it's something with the specific logs the containers being run are generating that's not playing nice with Wazuh, but I don't know where to start to try and troubleshoot specifically what that might be. On these particular servers the only containers being run are Teleport (https://goteleport.com/) processes. Any help would be appreciated!
My specs are:
Wazuh Agent and Manager: 4.3.10
OS: Linux 4.14.296-222.539.amzn2.aarch64 #1 SMP Wed Oct 26 20:36:51 UTC 2022 aarch64 aarch64 aarch64 GNU/Linux
Server type: t4g.small
First off, just want to say thanks for the amazing product. I have this rolled out to about 60 servers so far and this is the first hitch I've run into that I couldn't figure out myself. I'm hoping someone can point me in the right direction to troubleshoot this. My company hosts many applications in Amazon Linux 2 ARM64 ECS clusters. I have the Wazuh agents installed on the host EC2 instances and it works fine everywhere except for one server. All the systems use the same base AMI, so they should be identical, but here we are :) On this one server it works fine for a few days and then something changes...
If I login to the box and view processes it shows that the log collector is spinning at 100%
If I reboot the server or the wazuh-agent it will fix itself for a few days but eventually breaks again. I've even tried redeploying the server and get the same result.
I checked the ossec.log file already and it looks identical to servers that don't have these issues. I looked at the log files Wazuh is monitoring and they don't seem overly large or active. No more so then any of my other systems anyways. Only thing I can think of is that it's something with the specific logs the containers being run are generating that's not playing nice with Wazuh, but I don't know where to start to try and troubleshoot specifically what that might be. On these particular servers the only containers being run are Teleport (https://goteleport.com/) processes. Any help would be appreciated!
My specs are:
Wazuh Agent and Manager: 4.3.10
OS: Linux 4.14.296-222.539.amzn2.aarch64 #1 SMP Wed Oct 26 20:36:51 UTC 2022 aarch64 aarch64 aarch64 GNU/Linux
Server type: t4g.small

Juan Nicolás Asselle (Nico Asselle)
Dec 4, 2022, 10:08:27 PM12/4/22
to Wazuh mailing list
Hi!
Thanks for providing some information about the problem, it's a good start. My first thoughts were that this could be related to the issue https://github.com/wazuh/wazuh/issues/10943, but some things do not match (CPU high usage is during startup, totally different compared to your case).
IMO this has nothing to do with Teleport, but the next information will be helpful to check what's going wrong
- Check if agent's ossec.log has any ERROR or WARN log related to logcollector
- Check agent's logcollector statistics (available via Wazuh Dashboard or Wazuh API https://documentation.wazuh.com/current/user-manual/api/reference.html#operation/api.controllers.agent_controller.get_component_stats)
- localfile blocks used on the agent
- Agent's `/var/ossec/queue/logcollector/file_status.json` file
Looking forward to your reply
Jake Bell
Dec 5, 2022, 11:29:40 AM12/5/22
to Wazuh mailing list
Hello! Thanks for your reply. I agree, this issue doesn't seem to line up with that github issue. Especially because I don't think our log files are particularly large. For your questions:
- The only error I see is around the rootcheck module. And it's also present on servers without this issue.
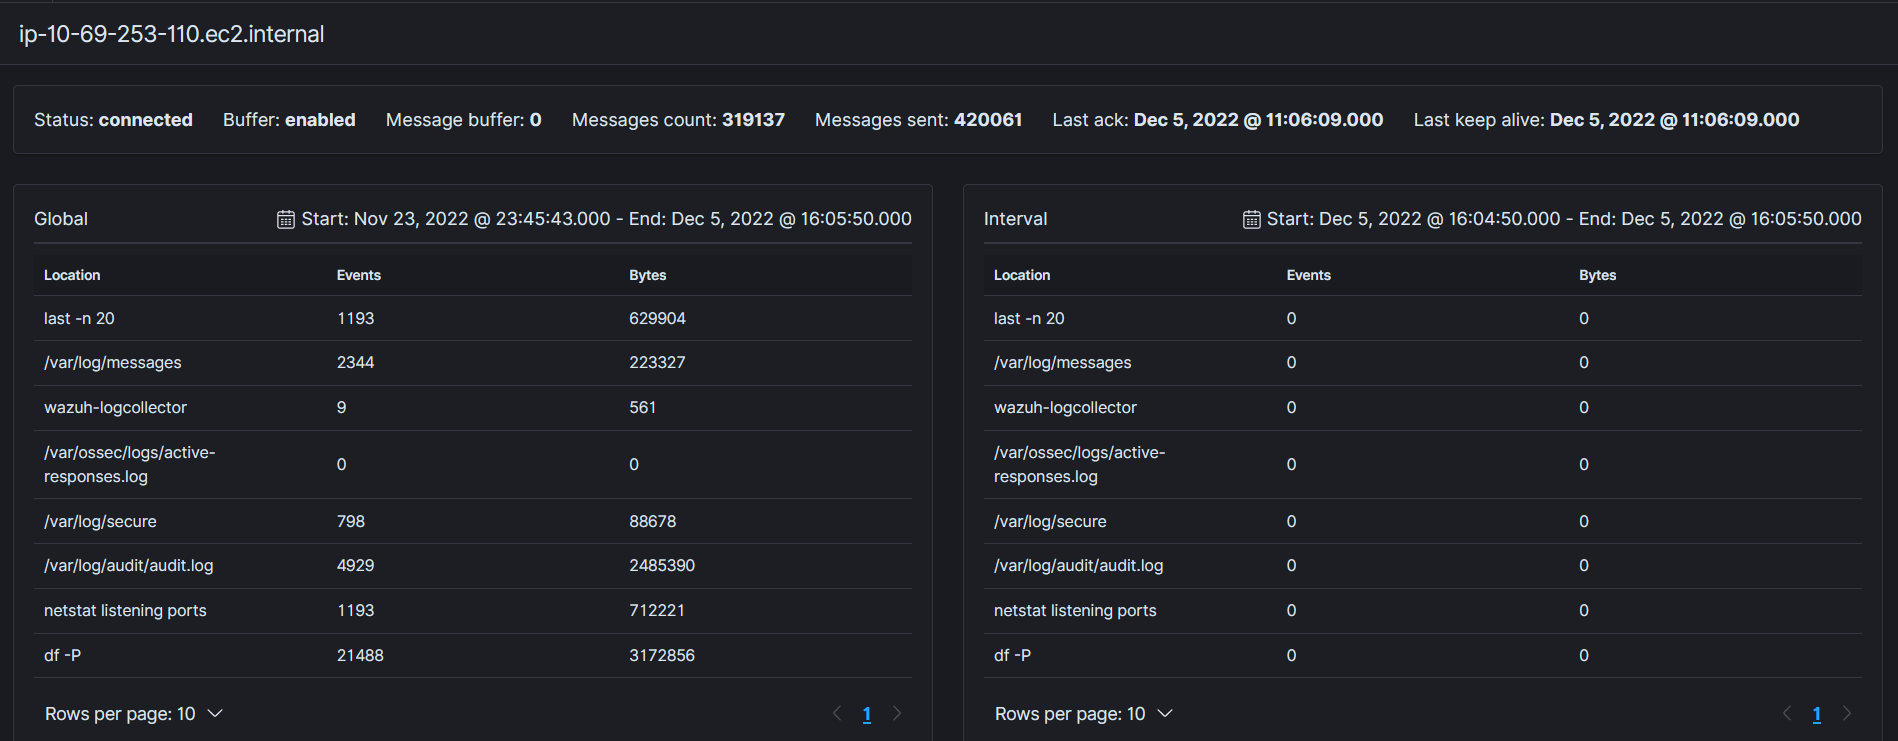
- Here's a screenshot of the stats page for the agent.
- Local file blocks are the default for the server type, I believe. Here they are:
<ossec_config>
<localfile>
<log_format>audit</log_format>
<location>/var/log/audit/audit.log</location>
</localfile>
<localfile>
<log_format>syslog</log_format>
<location>/var/ossec/logs/active-responses.log</location>
</localfile>
<localfile>
<log_format>syslog</log_format>
<location>/var/log/messages</location>
</localfile>
<localfile>
<log_format>syslog</log_format>
<location>/var/log/secure</location>
</localfile>
<localfile>
<log_format>syslog</log_format>
<location>/var/log/maillog</location>
</localfile>
</ossec_config> - File Status attached below:
{
"files": [{
"path": "/var/log/messages",
"hash": "ce5293aefbb1bb94eb7a1b08c860ab799c8bd0b1",
"offset": "211527"
}, {
"path": "/var/ossec/logs/active-responses.log",
"hash": "5e4ec4cf793d990a480ed5218de40f95df6cb6c2",
"offset": "140"
}, {
"path": "/var/log/secure",
"hash": "bb049402175dbc82b6f1da2a70ec0ac8c63fd5cc",
"offset": "86828"
}, {
"path": "/var/log/audit/audit.log",
"hash": "17858f62080f7862268b6a492d0cd0cf9548c035",
"offset": "2469867"
}
]
}
Let me know if there's any other information I can provide!
Jake
Juan Nicolás Asselle (Nico Asselle)
Dec 5, 2022, 2:56:13 PM12/5/22
to Wazuh mailing list
Hi Jake,
There is nothing unusual in the information you sent me :/ . It's always the same environment that fails? Could you please set logcollector.debug=2 into your agent's local_internal_options.conf? Once you detect that is with 100% CPU usage, please share to me the agent's ossec.log. Remember to obfuscate production/private information.
Jake Bell
Dec 5, 2022, 4:21:06 PM12/5/22
to Wazuh mailing list
Yes, it only happens on one of the two teleport host servers. Doesn't matter if I relaunch the instances. I'll go ahead and turn debugging on. It'll probably take a couple days to show up again after I reboot to apply the change.
Reply all
Reply to author
Forward
0 new messages