Studio Platform Survey Report published
265 views
Skip to first unread message

Nick Cannon
Jan 13, 2022, 11:16:16 AM1/13/22
to vfx-platform-discuss
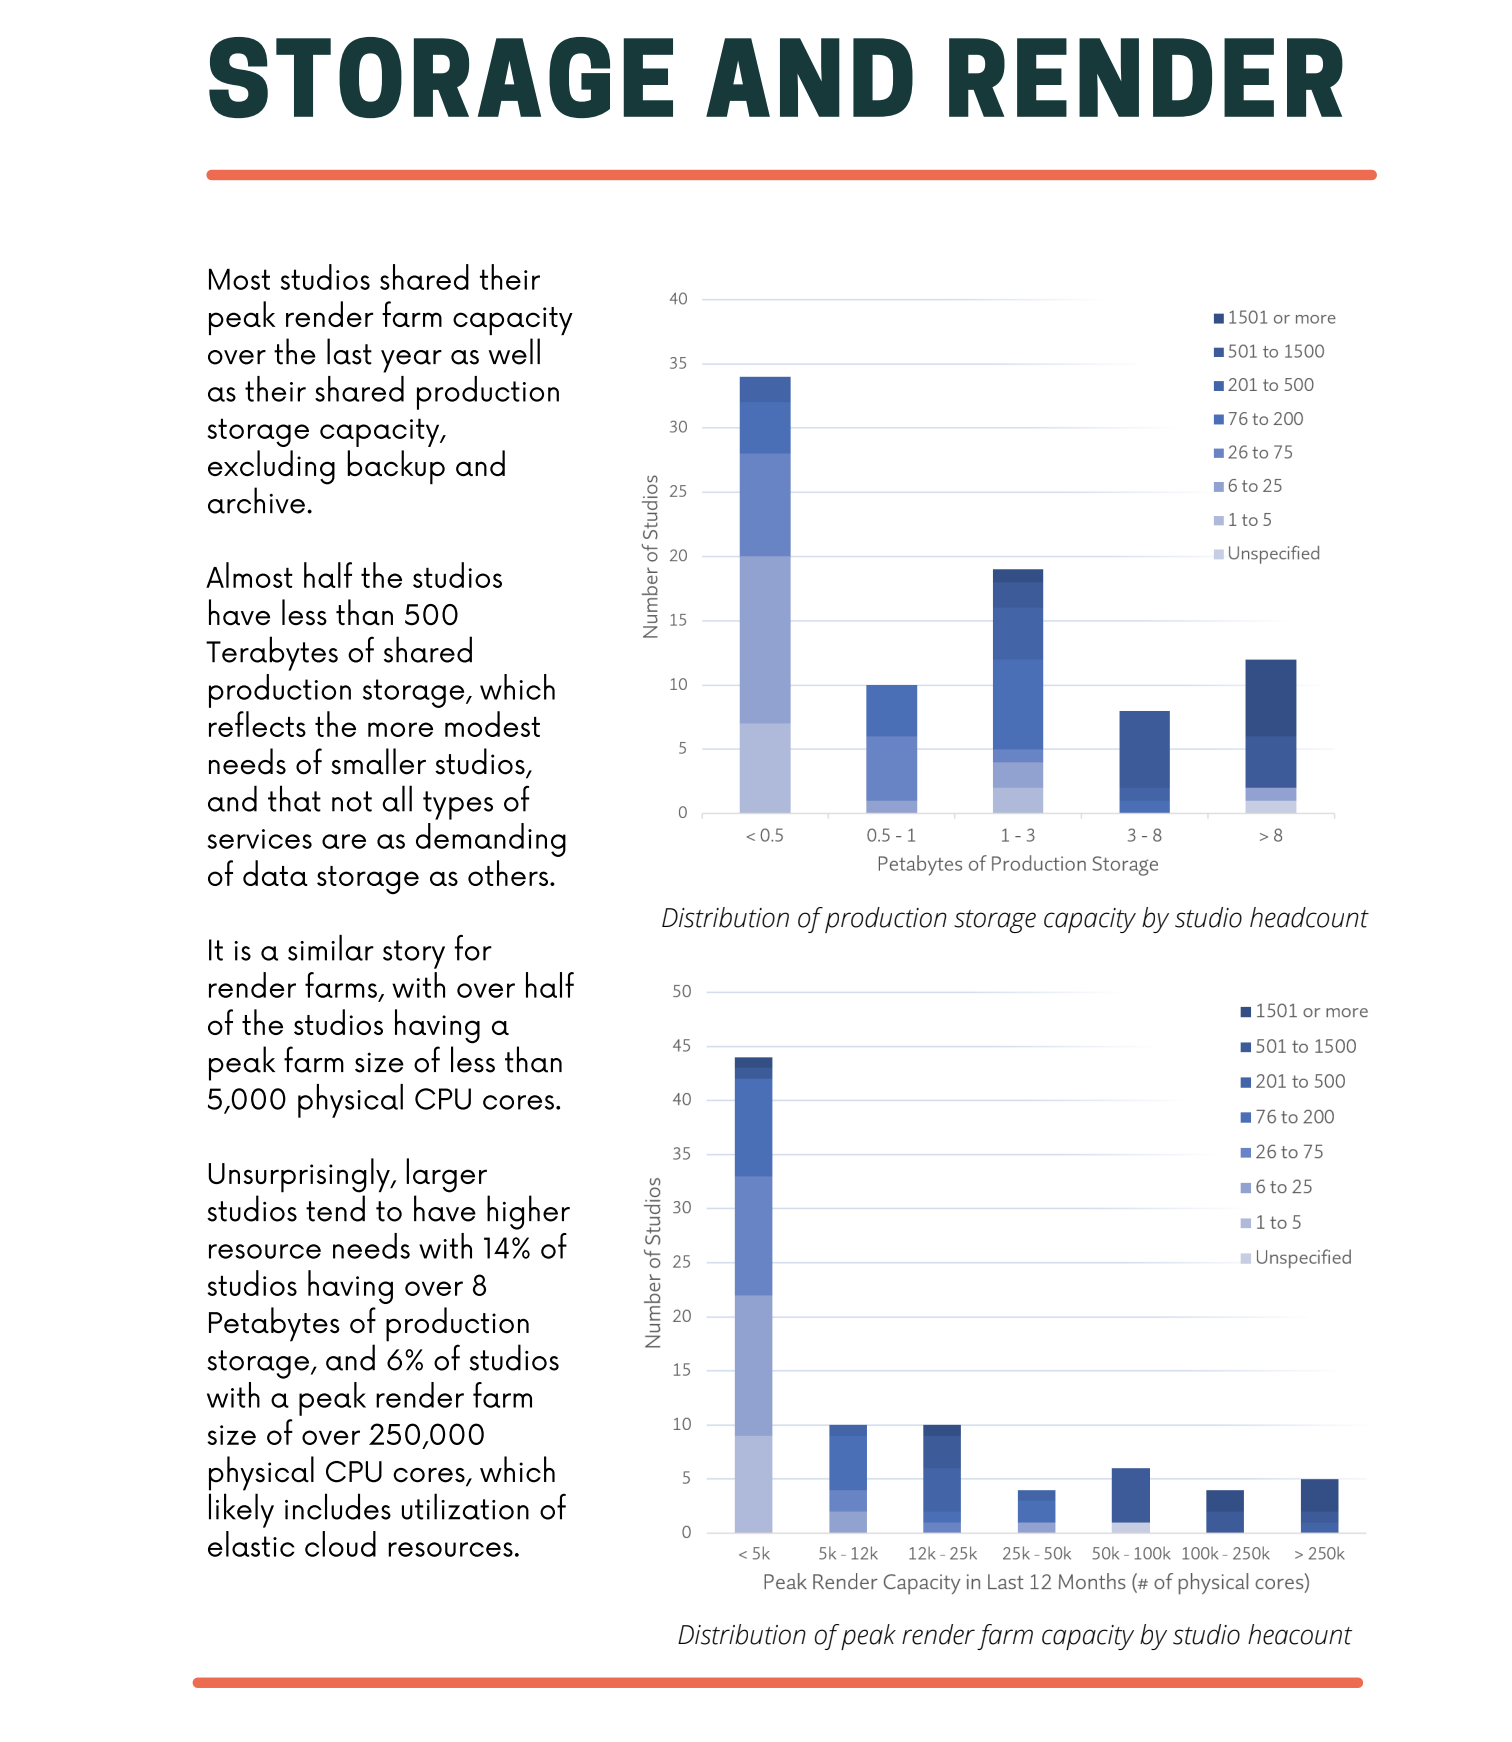
Last October, the Visual Effects Society Technology Committee and the VFX Reference Platform Working Group launched a major survey with the goal of creating a better understanding of the collective platform and software needs of the VFX and Animation studio community. Thank you to all those that responded, making this the largest effort of its kind in our community.
The results have been compiled and today the VFX Reference Platform Studio Survey Report has been published providing a unique insight into the state of studio infrastructure and making recommendations to nurture a healthy and sustainable platform ecosystem for the future.
The results have been compiled and today the VFX Reference Platform Studio Survey Report has been published providing a unique insight into the state of studio infrastructure and making recommendations to nurture a healthy and sustainable platform ecosystem for the future.
For further information, please read the full report at https://bit.ly/VRP21Rep.
Nick

Sean Wallitsch
Jan 13, 2022, 12:34:08 PM1/13/22
to Nick Cannon, vfx-platform-discuss
Hugely informative report, thank you all for doing the work to generate this.
Do we know when the working group for Linux consolidation will spin up?
--
You received this message because you are subscribed to the Google Groups "vfx-platform-discuss" group.
To unsubscribe from this group and stop receiving emails from it, send an email to vfx-platform-dis...@googlegroups.com.
To view this discussion on the web visit https://groups.google.com/d/msgid/vfx-platform-discuss/CABiBYoyrXCizBVfP7oY_k37PmX4K0deZsuN35%3DU%3D3D_RusdgsA%40mail.gmail.com.

Maxim Doucet
Jan 14, 2022, 3:42:59 AM1/14/22
to vfx-platform-discuss
Thanks a lot! I have the same question as Sean. This working group (if the software editors play the game and participate, of course) will be a major milestone for our industry!
Nick Cannon
Jan 14, 2022, 11:02:56 AM1/14/22
to vfx-platform-discuss
On Fri, Jan 14, 2022 at 12:43 AM 'Maxim Doucet' via vfx-platform-discuss <vfx-platfo...@googlegroups.com> wrote:
Thanks a lot! I have the same question as Sean. This working group (if the software editors play the game and participate, of course) will be a major milestone for our industry!Le jeudi 13 janvier 2022 à 18:34:08 UTC+1, Sean Wallitsch a écrit :Hugely informative report, thank you all for doing the work to generate this.Do we know when the working group for Linux consolidation will spin up?
Great question and we don't have defined timing yet although there is obviously some urgency so it will be weeks rather than months.
We first wanted to publish the report to see how that landed with the community and whether there was broad support for the recommendations. So far the response has been very positive so I anticipate moving ahead quite quickly with forming the working group, and engaging industry partners and software vendors to solicit their support and any proposals they may have.
Nick

Kevin Constantine
Mar 11, 2022, 4:25:27 PM3/11/22
to vfx-platform-discuss
I was looking through the Studio Platform Survey Report that was published for another reason, and glanced at page 4 where the captions of the graphs say "Distribution of production storage capacity by studio headcount" and "Distribution of peak render farm capacity by studio headcount". However, it doesn't look like that's what the graphs are showing. They appear to show a count of studios who have 0.5, 1, 3, 5, >5PB of storage. While that's useful data, I'd be really curious to see the distribution of storage and render-footprint based on studio size. Is that data analysis something that can be provided?
Thanks so much!
-kevin
Kevin Constantine
Mar 11, 2022, 6:32:25 PM3/11/22
to vfx-platform-discuss
I was afraid I missed a key piece in the graphs, and sure enough, the shading in the key is providing the size of the studio which I totally missed.
I think what I was expecting to see is the data normalized by population size. As an example if your studio was providing 100 cores per user, and other studios of the same size were providing 25 cores per user, that becomes useful information to start asking questions.
Thanks and sorry for my misunderstanding of the existing graph.
-kevin
Nick Cannon
Mar 13, 2022, 11:22:15 PM3/13/22
to Kevin Constantine, vfx-platform-discuss
It's a good question. The answer requires making some very broad assumptions which is why it was not included in the official report.
Nick
Here is a very rough pass at an answer, but please take it with a giant pinch of salt due to the guesswork involved, and lack of rigor in checking over this analysis.
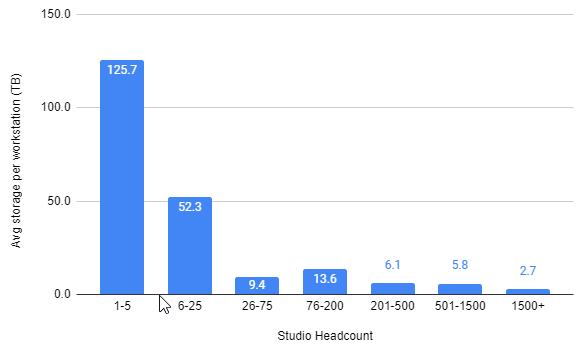
Firstly for storage, the survey only asked for range of capacity so we will make the following assumption of what the storage capacity is for each studio in a given range:
Given those assumptions, this chart shows the average storage capacity per artist workstation for each bracket of studio headcount:
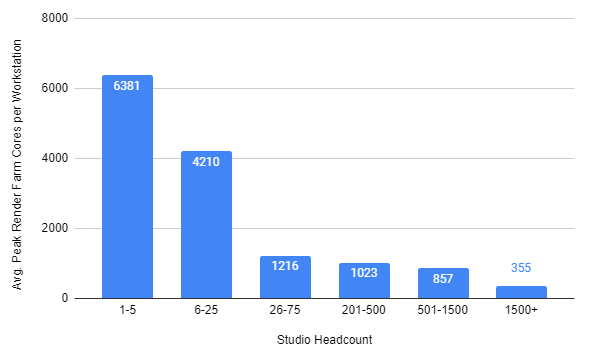
Now for peak render farm capacity, we'll make these assumptions:
Which then results in this graph of average peak render farm capacity per artist workstation for each bracket of studio headcount:
The shape of these results shouldn't come as a surprise - economies of scale are a real thing and apply to studios as much as anything else. The radical difference in capacity from smallest to largest studios does look startling, but I suggest the assumptions made are probably not representative of actual studio capacities so the effect is exaggerated.
Hope that helps...
Nick
--
You received this message because you are subscribed to the Google Groups "vfx-platform-discuss" group.
To unsubscribe from this group and stop receiving emails from it, send an email to vfx-platform-dis...@googlegroups.com.
To view this discussion on the web visit https://groups.google.com/d/msgid/vfx-platform-discuss/6f5c3c04-4f03-482e-8cba-647050cae552n%40googlegroups.com.
Reply all
Reply to author
Forward
0 new messages