Rapidly increasing (huge) memory usage
762 views
Skip to first unread message

Martin Stapleton
Jun 18, 2021, 10:58:43 AM6/18/21
to vernemq-users
Hi,
I'm using a clustered vernemq based on erlio/docker-vernemq:1.9.2-1-alpine
vm.args updated with :
+P 2097152
+Q 524288
main docker env variables :
- name: DOCKER_VERNEMQ_LEVELDB__MAXIMUM_MEMORY__PERCENT
value: "5"
- name: DOCKER_VERNEMQ_LISTENER__MAX_CONNECTIONS
value: "60000"
- name: DOCKER_VERNEMQ_LISTENER__NR_OF_ACCEPTORS
value: "100"
- name: DOCKER_VERNEMQ_LISTENER__TCP__BUFFER_SIZES
value: 4096,16384,32768
.. with 4 ports listening per node, and connections incoming through a kubernetes NodePort.
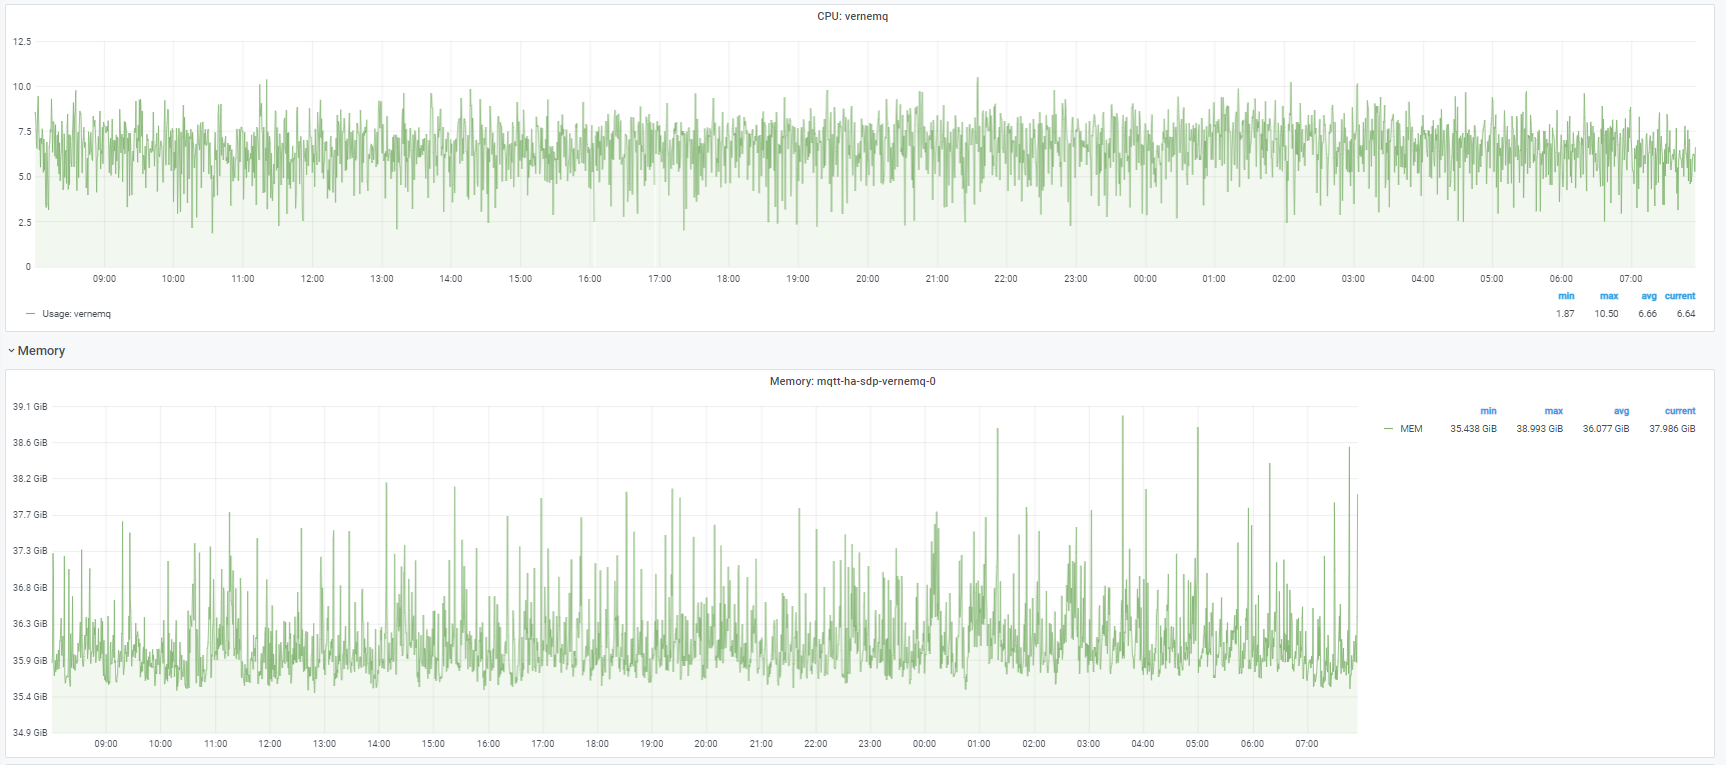
We were running in a stable state, with about 470k connections from devices although with a fairly high CPU/memory usage :
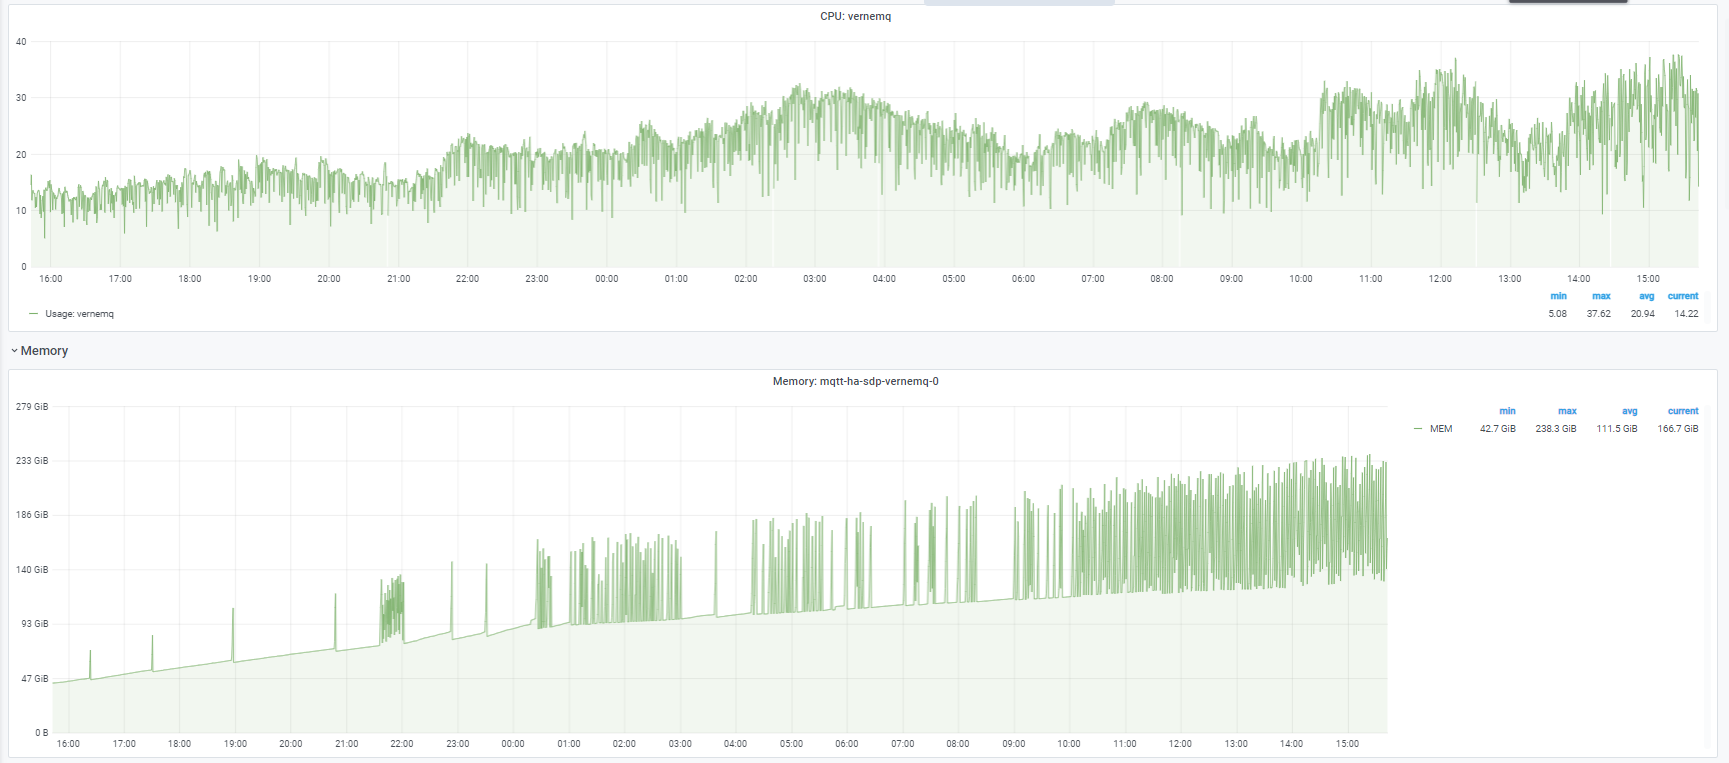
I thought that I might be able to reduce CPU usage by forcing node persistence (externalTrafficPolicy=Local on the NodePort), however this seems to have had the opposite effect, with the CPU usage 3-4 times higher, and memory increasing by 100GB over 24h :
Do you have any idea what might be causing this, please (more information following)?
We have a 'low' message volume for most of the clients, and they are connecting with consistent client id, and clean_session=true, most clients have subscriptions to two topics (which related to the client id).
I noted from the metrics that the memory looks like it is listed in vm_memory_processes :
gauge.vm_memory_atom = 2729553
gauge.vm_memory_atom_used = 2692181
gauge.vm_memory_binary = 6402002792
gauge.vm_memory_code = 11645947
gauge.vm_memory_ets = 297601488
gauge.vm_memory_processes = 279096953008
gauge.vm_memory_processes_used = 279088683616
gauge.vm_memory_system = 7302366944
gauge.vm_memory_total = 286399319952
subscriptions approximate to 2*currently online, and this node has about 200k connections :
gauge.router_subscriptions = 728036
gauge.system_process_count = 411074
setup vs teardown of queues :
counter.queue_setup = 112106268
counter.queue_teardown = 111911607
.. has suggested that clients are disconnecting/reconnecting (a lot) more than we expected, which I guess is part of the problem? but I don't understand why this would be causing huge memory usage with node affinity, whereas it was not when the connections were jumping nodes.
Any other information that I could supply that might be useful, please let me know!
Kind Regards,
Martin

André Fatton
Jun 19, 2021, 3:46:21 AM6/19/21
to vernemq-users
Hi Martin,
You'll certainly have to review the Verne logs, to possibly understand and correlate the events logged.
Best,
André
Martin Stapleton
Jun 23, 2021, 8:27:01 AM6/23/21
to vernemq-users
Hi
André,

I have made a few changes, and tried to understand better what's happening.
I updated the version we're using to a build of 1.12.0 vernemq, compiled on erlang 23.3.4 alpine; same configuration as before, but with override to the new default :
- name: DOCKER_VERNEMQ_METADATA_PLUGIN
value: vmq_plumtree
(to preserve the setup as it was)
We still have 7 nodes in the cluster, with about 470k connections, and about 900k subscriptions.
We see the same memory usage pattern :
Checking the logs, I see (seriously) heavy metadata broadcast work :
08:09:46.169 [warning] Broadcast overloaded, 3322ms mailbox traversal, schedule next lazy broadcast in 75925ms, the min interval is 10000ms
08:12:19.678 [warning] Broadcast overloaded, 2688059ms mailbox traversal, schedule next lazy broadcast in 404911ms, the min interval is 10000ms
08:19:19.558 [warning] Broadcast overloaded, 2535665ms mailbox traversal, schedule next lazy broadcast in 399046ms, the min interval is 10000ms
08:26:33.382 [warning] Broadcast overloaded, 785ms mailbox traversal, schedule next lazy broadcast in 52949ms, the min interval is 10000ms
08:34:12.297 [warning] Broadcast overloaded, 2969ms mailbox traversal, schedule next lazy broadcast in 73823ms, the min interval is 10000ms
08:36:41.694 [warning] Broadcast overloaded, 4612748ms mailbox traversal, schedule next lazy broadcast in 463436ms, the min interval is 10000ms
08:44:39.201 [warning] Broadcast overloaded, 4754ms mailbox traversal, schedule next lazy broadcast in 83040ms, the min interval is 10000ms
08:46:22.659 [warning] Broadcast overloaded, 416ms mailbox traversal, schedule next lazy broadcast in 45189ms, the min interval is 10000ms
08:47:08.565 [warning] Broadcast overloaded, 724ms mailbox traversal, schedule next lazy broadcast in 51890ms, the min interval is 10000ms
etc..
I check the metrics/connections, and I see that for each cluster member, we had a fairly stable number of connections, but a huge turnover of queues/subscriptions :
This is the metric change in 30 minutes on vernemq with about 110k devices attached :
2 116 077
2 022 929
3 107 549 3 014 491
counter.queue_setup counter.queue_teardown
3 107 549 3 014 491
The connectivity from device -> broker is :
Device -> Firewall -> loadbalancer (ip # persistence) ->
k8s NodePorts (externalTrafficPolicy=Local) -> vernemq k8s pods
I noticed that some devices seemed to be constantly reconnecting :
bash-4.4$ vmq-admin session show --peer_host=18.17.16.15
+------------------+-----------+------------+-----------------+-----------+--------+
| client_id | is_online | mountpoint | peer_host | peer_port | user |
+------------------+-----------+------------+-----------------+-----------+--------+
| 1000B*********** | true | | 18.17.16.15 | 3216 | xxxxxx |
+------------------+-----------+------------+-----------------+-----------+--------+
bash-4.4$ vmq-admin session show --peer_host=18.17.16.15
+------------------+-----------+------------+-----------------+-----------+--------+
| client_id | is_online | mountpoint | peer_host | peer_port | user |
+------------------+-----------+------------+-----------------+-----------+--------+
| 1000B*********** | true | | 18.17.16.15 | 48484 | xxxxxx |
+------------------+-----------+------------+-----------------+-----------+--------+
A trace confirmed this :
2021-06-23T09:29:40Z Starting trace for 1 existing sessions for client "1000B**" with PIDs
[<9465.18698.1>]
2021-06-23T09:29:42Z New session with PID <9465.18715.1> found for client "1000B**"
2021-06-23T09:29:42Z <9465.18715.1> MQTT RECV: CID: "1000B**" CONNECT(c: 1000B**, v: 4, u: **, p: **, cs: 1, ka: 60)
2021-06-23T09:29:42Z <9465.18715.1> Calling auth_on_register(...)
2021-06-23T09:29:42Z <9465.18715.1> Hook returned "ok"
2021-06-23T09:29:42Z <9465.18698.1> Trace session for 1000B** stopped
2021-06-23T09:29:42Z <9465.18715.1> MQTT SEND: CID: "1000B**" CONNACK(sp: 0, rc: 0)
2021-06-23T09:29:43Z New session with PID <9465.18736.1> found for client "
1000B** "
2021-06-23T09:29:43Z <9465.18736.1> MQTT RECV: CID: "1000B**" CONNECT(c: 1000B**, v: 4, u: **, p: **, cs: 1, ka: 60)
2021-06-23T09:29:43Z <9465.18736.1> Calling auth_on_register(...)
2021-06-23T09:29:43Z <9465.18736.1> Hook returned "ok"
2021-06-23T09:29:43Z <9465.18715.1> Trace session for 1000B** stopped
2021-06-23T09:29:43Z <9465.18736.1> MQTT SEND: CID: "1000B**" CONNACK(sp: 0, rc: 0)
2021-06-23T09:29:44Z New session with PID <9465.18748.1> found for client "
1000B** "
2021-06-23T09:29:44Z <9465.18748.1> MQTT RECV: CID: "1000B**" CONNECT(c: 1000B**, v: 4, u: **, p: **, cs: 1, ka: 60)
2021-06-23T09:29:44Z <9465.18748.1> Calling auth_on_register(...)
2021-06-23T09:29:44Z <9465.18748.1> Hook returned "ok"
So, at a glance, it looks like the device has (clearly our problem!!) for some reason got at least two MQTT connections, with the same client ID.
- Connect requested / made <9465.18715.1> (in most cases, but not this one, subscriptions are also added)
- Then, Connect requested / made <
9465.18736.1> (in most cases, but not this one, subscriptions are also added)
- ...which disconnects <9465.18715.1> (as both old and new sessions are cs:1 clean_session, and we have allow_multiple_sessions = off set)
- and the device starts again with another connection attempt : <9465.18748.1>
From the point of view of vernemq, I assume that :
- the high queue/subscription turnover is overloading plumtree/metadata broadcast, and is probably causing our high CPU usage (tearing down and establishing new queues at a rate of 2 million per hour)
So my question is, is this also causing the really high memory usage? My guess was something like (although here I have no knowledge) :
- Each subscription/queue takes Erlang memory
- Erlang only releases 'blocks' when they are completely free of all queues/subscriptions
- Therefore, as we have a combination of 'stable long term' connections, and 'really fast churning' connections - we are causing allocation of loads of erlang memory blocks that cannot be released?
Does that sound like the issue?
Kind Regards,
Martin
André Fatton
Jun 23, 2021, 11:26:53 AM6/23/21
to vernemq-users
Hi Martin,
I think your assessment sounds correct, from a general perspective, and you certainly don't want identical ClientIDs racing each other. You can attach to a Verne node and then see what the erlang:memory() call gives you as totals. It's probably the process memory. To find out whether it's a single process mailbox that's overloaded, you'd have to familiarize yourself a little with the 'recon' tool that's part of the VerneMQ console.
Best,
André
Martin Stapleton
Jun 24, 2021, 9:59:04 AM6/24/21
to vernemq-users
Hi André,
Yes, it's the process memory, I think :
erlang:memory().
[{total,281201908512},
{processes,278055899144},
{processes_used,278050473664},
{system,3146009368},
{atom,737521},
{atom_used,733261},
{binary,2640357544},
{code,12375544},
{ets,240492376}]...
It seems to be on the eheap_alloc :
recon_alloc:memory(allocated_types,current).
[{binary_alloc,5686984704},
{driver_alloc,439386112},
{eheap_alloc,343990190080},
{ets_alloc,1763737600},
{fix_alloc,761298944},
{ll_alloc,148373504},
{sl_alloc,1867776},
{std_alloc,276348928},
{temp_alloc,7471104}]
... which is heavily fragmented, with very low block usage :
recon_alloc:fragmentation(current).
[{{eheap_alloc,1},
[{sbcs_usage,1.0},
{mbcs_usage,0.02873370017288622},
{sbcs_block_size,0},
{sbcs_carriers_size,0},
{mbcs_block_size,45100048},
{mbcs_carriers_size,1569587200}]},
{{eheap_alloc,2},
[{sbcs_usage,0.6164160976890757},
{mbcs_usage,0.03025381797124029},
{sbcs_block_size,600912},
{sbcs_carriers_size,974848},
{mbcs_block_size,39808936},
{mbcs_carriers_size,1315831808}]},
{{eheap_alloc,3},
[{sbcs_usage,1.0},
{mbcs_usage,0.03196033923231321},
{sbcs_block_size,0},
{sbcs_carriers_size,0},
{mbcs_block_size,41937136},
{mbcs_carriers_size,1312161792}]},
- etc. for all eheap_alloc, followed by binary_alloc :
{{binary_alloc,4},
[{sbcs_usage,1.0},
{mbcs_usage,0.014051671267788193},
{sbcs_block_size,0},
{sbcs_carriers_size,0},
{mbcs_block_size,7393368},
{mbcs_carriers_size,526155776}]},
So I guess it is serious fragmentation of the erlang memory caused by our spamming client_ids.
I'll ask our app developers to have a look at this ; in the meantime, is there any way to restrict the rate of repeated connection attempts from a particular client ID? (and/or, would this be easily improved whilst they work out the issue by using persistent queues rather than clear_session: true, so that the queues didn't keep being reconstructed?).
I guess there might also be erlang memory allocation settings ; something like -MHas abof ; that might increase reuse more blocks, but that seems like playing with fire if the connecting devices need to be fixed anyway.
Thanks for the help!
Martin
Reply all
Reply to author
Forward
0 new messages