uTracerJS - software for uTracer (works on mac, win, linux and more)

Ihor

BHdeC
Ihor
Ihor
BHdeC
---------------- Starting uTracer.js 0.93 (build 20220218) ----------------------
---------------- (c) 2022, Ihor Smal, m...@boffin.nl ----------------------
-------------------------------------------------------------------------------------
[INFO] Found uTracerJS.txt, getting the COM port name and localhost port from there ...
[INFO] Serial port : COM3 open
[INFO] baud rate : 9600
[INFO] portnumber on http://localhost : 80
[INFO] path __dirname : C:\snapshot\nodejs
[INFO] path to 'data' folder : C:\Program Files (x86)\UTTracerJS
[INFO] process.cwd() : C:\Program Files (x86)\UTTracerJS
Error: ENOENT: no such file or directory, stat 'C:\Program Files (x86)\UTTracerJS\data\fulltest.html'
Ihor

Nebojsa Tomic
BHdeC
Ihor
Ihor
Ihor
Ihor Smal
--
You received this message because you are subscribed to a topic in the Google Groups "uTracer" group.
To unsubscribe from this topic, visit https://groups.google.com/d/topic/utracer/seaFp5pCEIA/unsubscribe.
To unsubscribe from this group and all its topics, send an email to utracer+u...@googlegroups.com.
To view this discussion on the web visit https://groups.google.com/d/msgid/utracer/cd0ff4d8-d097-4e57-ab01-fdf3fe952463n%40googlegroups.com.
Nebojsa Tomic
Ihor

D.A.R Achterberg
In the past a spend a quite some time, trying to run uTmax on a raspberry…
Op 25 feb. 2022 om 19:02 heeft Nebojsa Tomic <nesk...@gmail.com> het volgende geschreven:
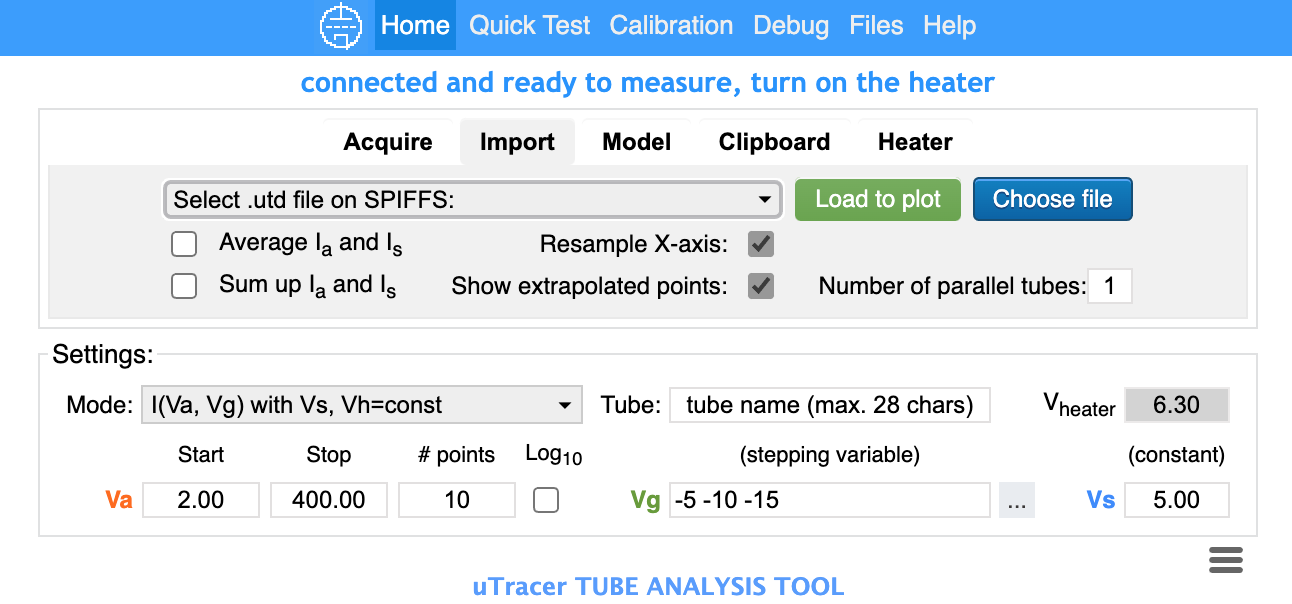
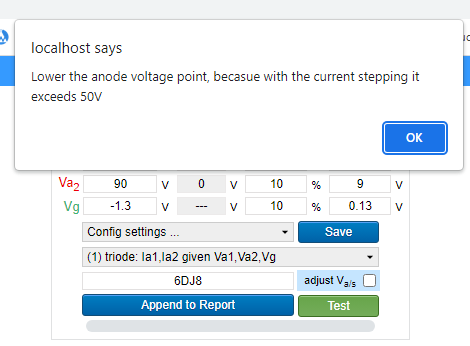
I just tried your cute program on my WIN 10, instalation was successful, but when I tried to do a ecc88 quick test, I get this message: "Lower the anode voltage point, becasue with the current stepping it exceeds 50V", anode voltage is set to 90V.
--
You received this message because you are subscribed to the Google Groups "uTracer" group.
To unsubscribe from this group and stop receiving emails from it, send an email to utracer+u...@googlegroups.com.
To view this discussion on the web visit https://groups.google.com/d/msgid/utracer/f280c4ad-5fda-4be6-935f-b2d985ed9d33n%40googlegroups.com.
Ihor
Ihor
Ihor
Thanks! It looks like "ping" works, but actually in the previous screenshot when it broke, it happen exactly at sending ping during HV measurements.... could it just be unlucky case, and now it works?? What about some simple Quickest?

jgx plato
--
You received this message because you are subscribed to the Google Groups "uTracer" group.
To unsubscribe from this group and stop receiving emails from it, send an email to utracer+u...@googlegroups.com.
To view this discussion on the web visit https://groups.google.com/d/msgid/utracer/39205850-0c05-4418-a40f-a20f3cdc9f8an%40googlegroups.com.
Ihor
Ihor
Ihor
jgx plato

--
You received this message because you are subscribed to the Google Groups "uTracer" group.
To unsubscribe from this group and stop receiving emails from it, send an email to utracer+u...@googlegroups.com.
To view this discussion on the web visit https://groups.google.com/d/msgid/utracer/d7268cb2-7c7a-4007-b654-31bddee7db0en%40googlegroups.com.
jgx plato
--
You received this message because you are subscribed to the Google Groups "uTracer" group.
To unsubscribe from this group and stop receiving emails from it, send an email to utracer+u...@googlegroups.com.
To view this discussion on the web visit https://groups.google.com/d/msgid/utracer/e9c730c8-a71b-4eb2-82fb-ebbef0215644n%40googlegroups.com.
D.A.R Achterberg
Op 26 feb. 2022 om 18:21 heeft Ihor <iste...@gmail.com> het volgende geschreven:
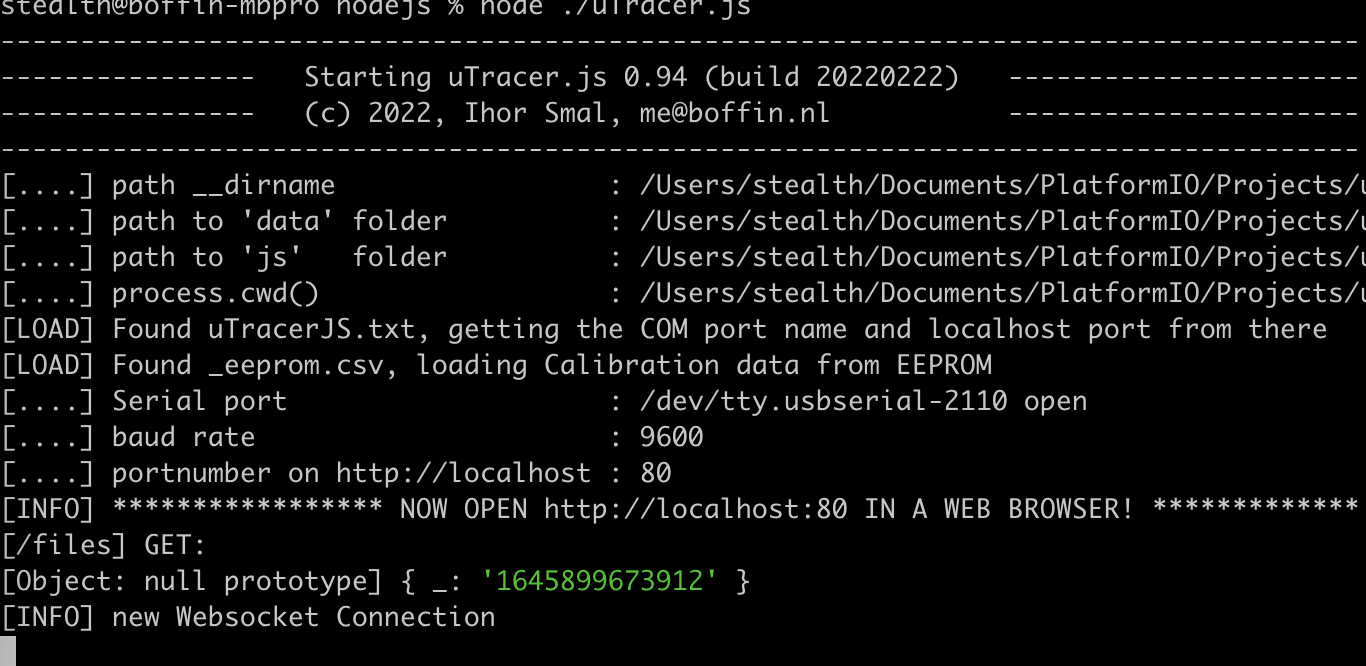
I did the test on CHIP computer which has so called armv7, so it is the same as raspberry pi as far as I remember. I do not have any RPI anymore. But in any case, on that platform I do not compile executables, but just run uTracer.js with node. What it means is that you just have to be able to install Nodejs from the official website (https://nodejs.org/en/download/ and that one exists for all possible platforms) and then just execute uTracerJS as "node uTracer.js" from the shell after ssh'ing to your RPI. that uTracer.js is not available on the website, but I can prepare the version like that as well. I cap also try to compile for RPI but I actually need RPI to do it, and I did not want to explain all those details how to use it directly with Nodejs instigator.
--
You received this message because you are subscribed to the Google Groups "uTracer" group.
To unsubscribe from this group and stop receiving emails from it, send an email to utracer+u...@googlegroups.com.
To view this discussion on the web visit https://groups.google.com/d/msgid/utracer/2c74ce2d-7928-41a1-87c3-eff2b074db13n%40googlegroups.com.
Ihor Smal
On 26 Feb 2022, at 20:09, jgx plato <jgx...@gmail.com> wrote:
Indeed I am working for the utracer with a Windows machine, and as you say, when I try to use the debug tab, there is no message new web socket connection.For this reasson I have try run the app in a MacBook Pro M1 and it had been imposible. I have repeated the procedure as I did in the windows machine, but without success!I have uses the utracerJS-macos-arm64, and I have modified the utracerJS.txt (see attached image)Any idea to run the app in the Mac?
<image_50384641.JPG>
El El sáb, 26 feb 2022 a las 19:24, Ihor <iste...@gmail.com> escribió:
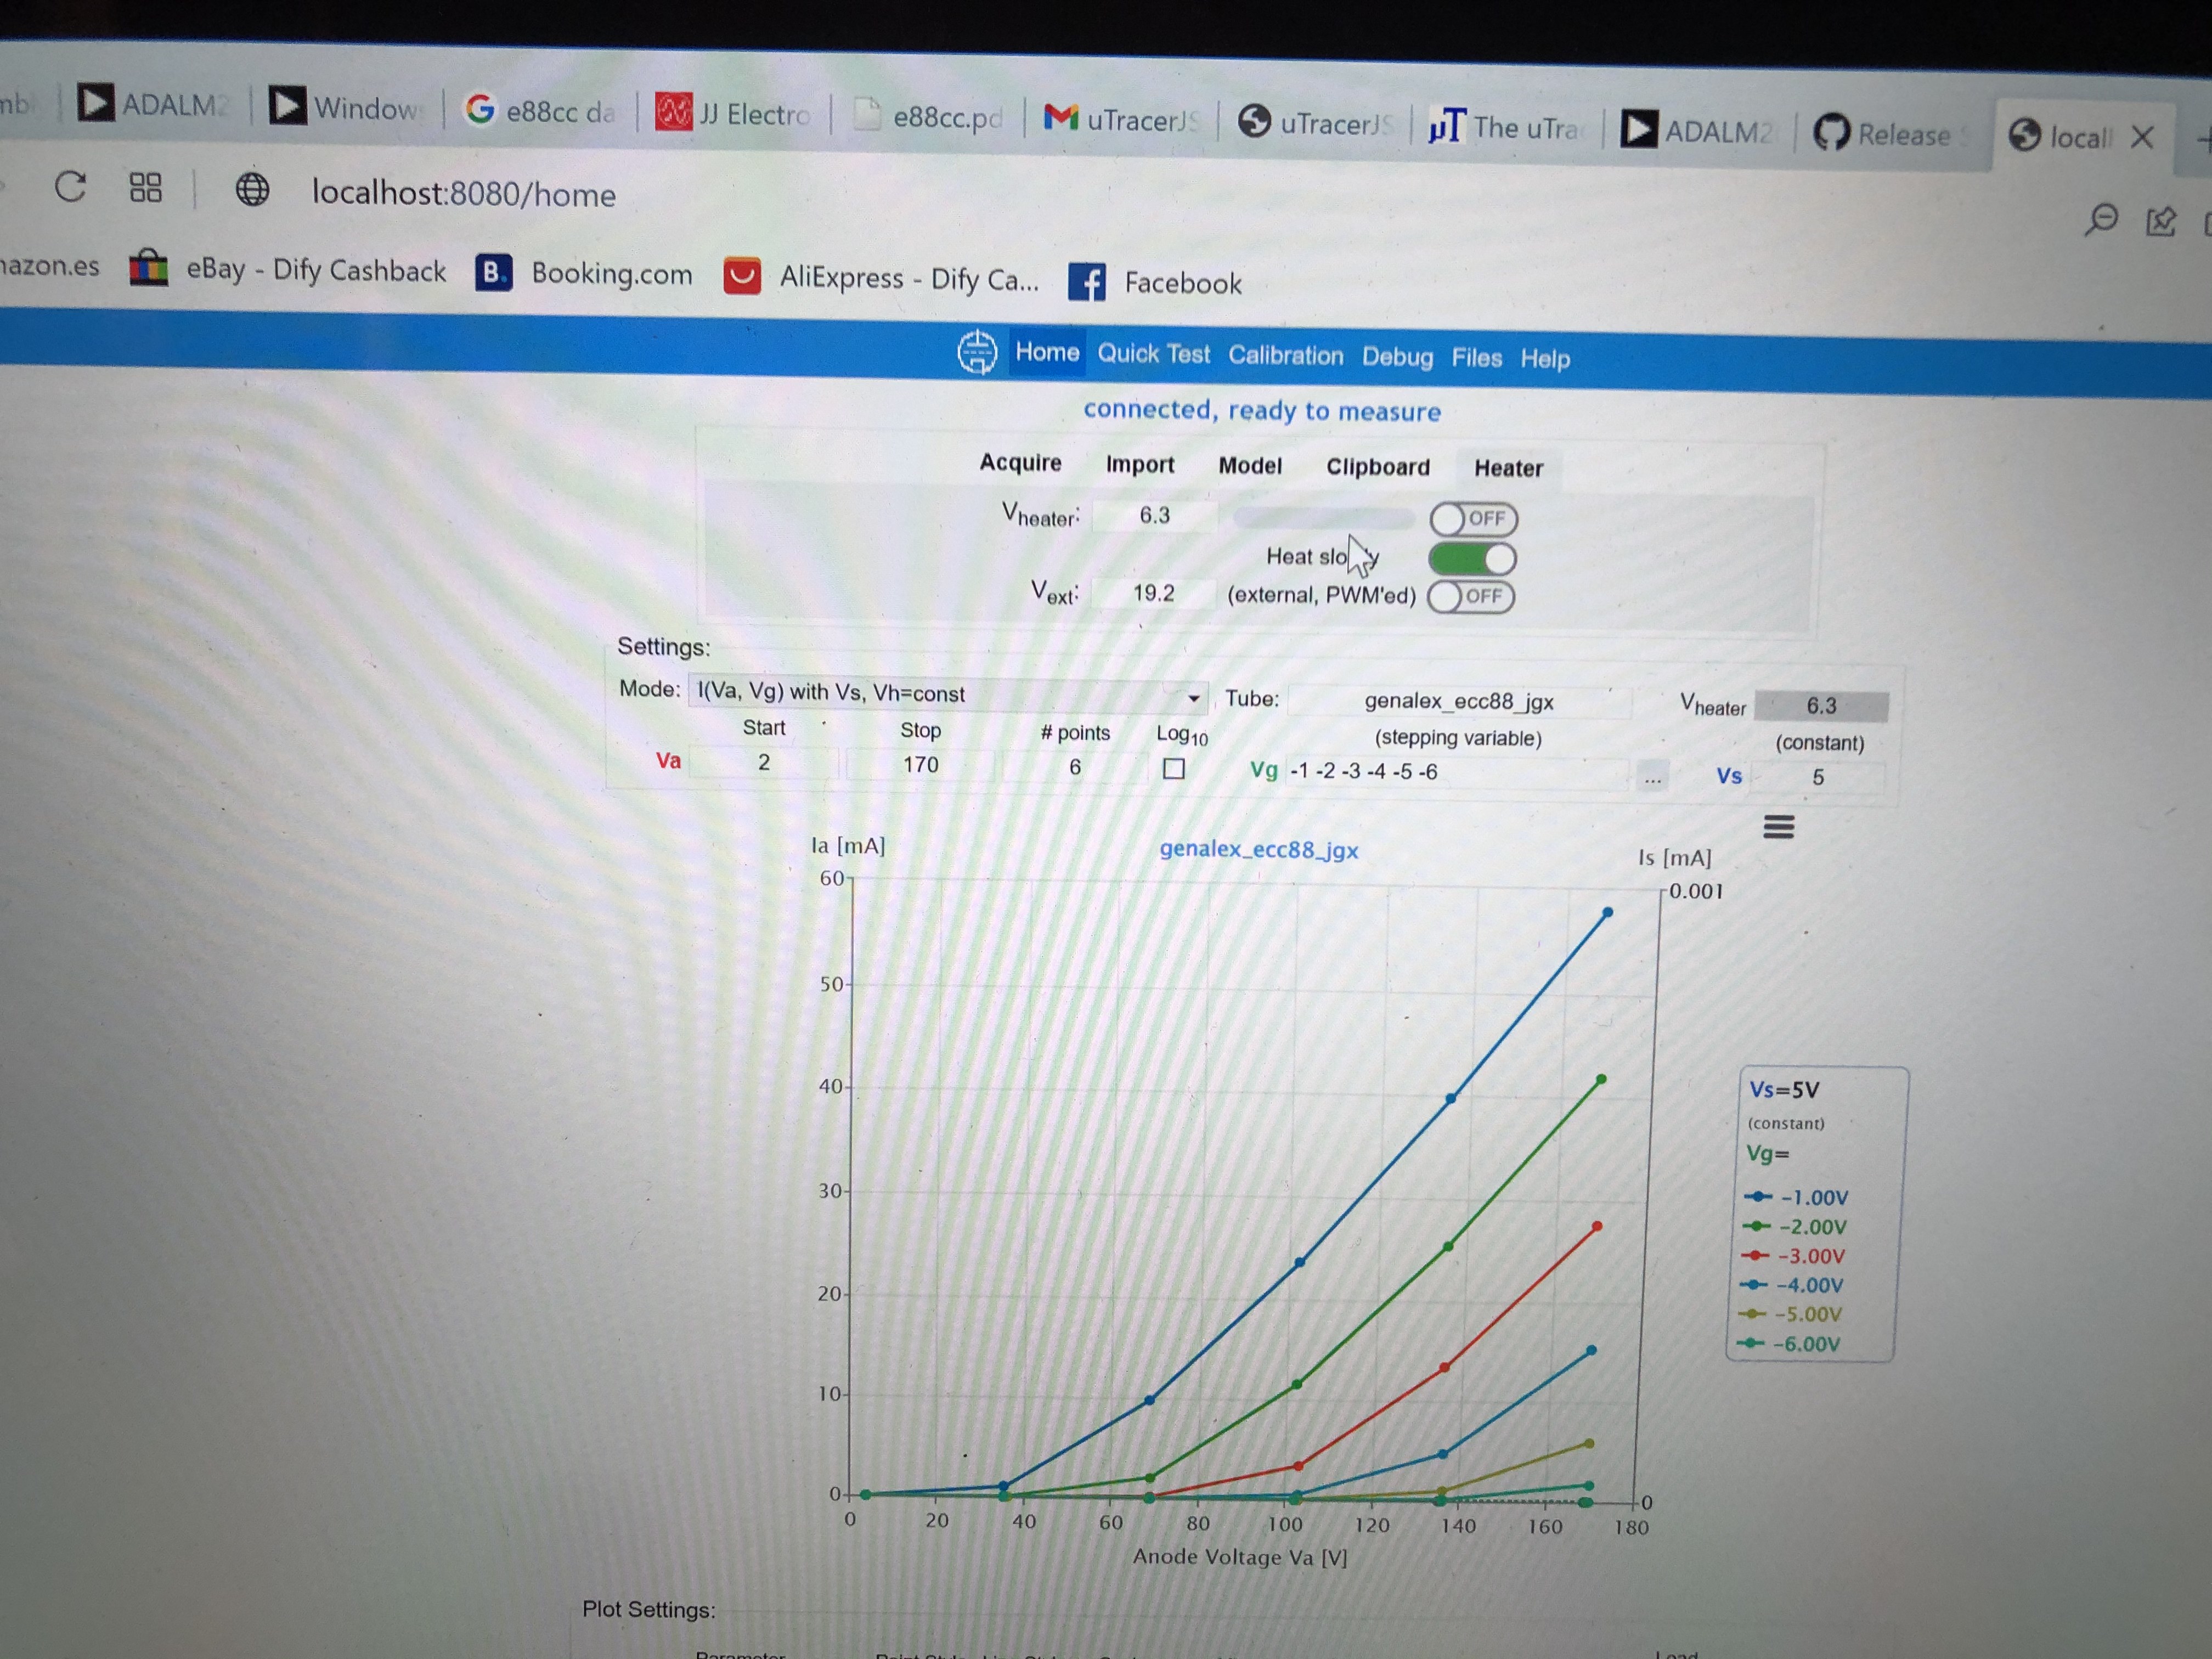
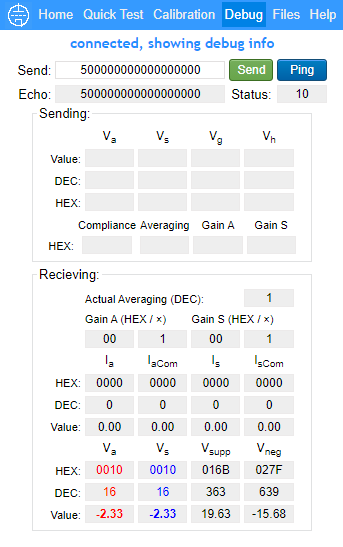
Nice screenshots!- the possibility to make measurements without Heater ON before that, is a decided choice. It is mainly for those people (like me and many others here) who have external power supplies for heating the tubes, and so we do not have to activate the internal heater in any case (as in the original windows software). So, it is a responsibility of the user (who uses an internal heater) to turn it on before the measurements (and there is also a message about that on the top each time).- the ping is done using a bit specific protocol, so I wonder if you are using windows ? if you have any firewalls or antivirus software or so, which might block the access. Could you check if you see something similar to my screenshot in the terminal window when you start uTracerJS and then go to the Debug tab in the browser. It should say that a new client is trying to connect. Having that not working (the Debug tab) is not a problem at all, you basically never have to monitor it if things are working well :)Cheers,Ihor
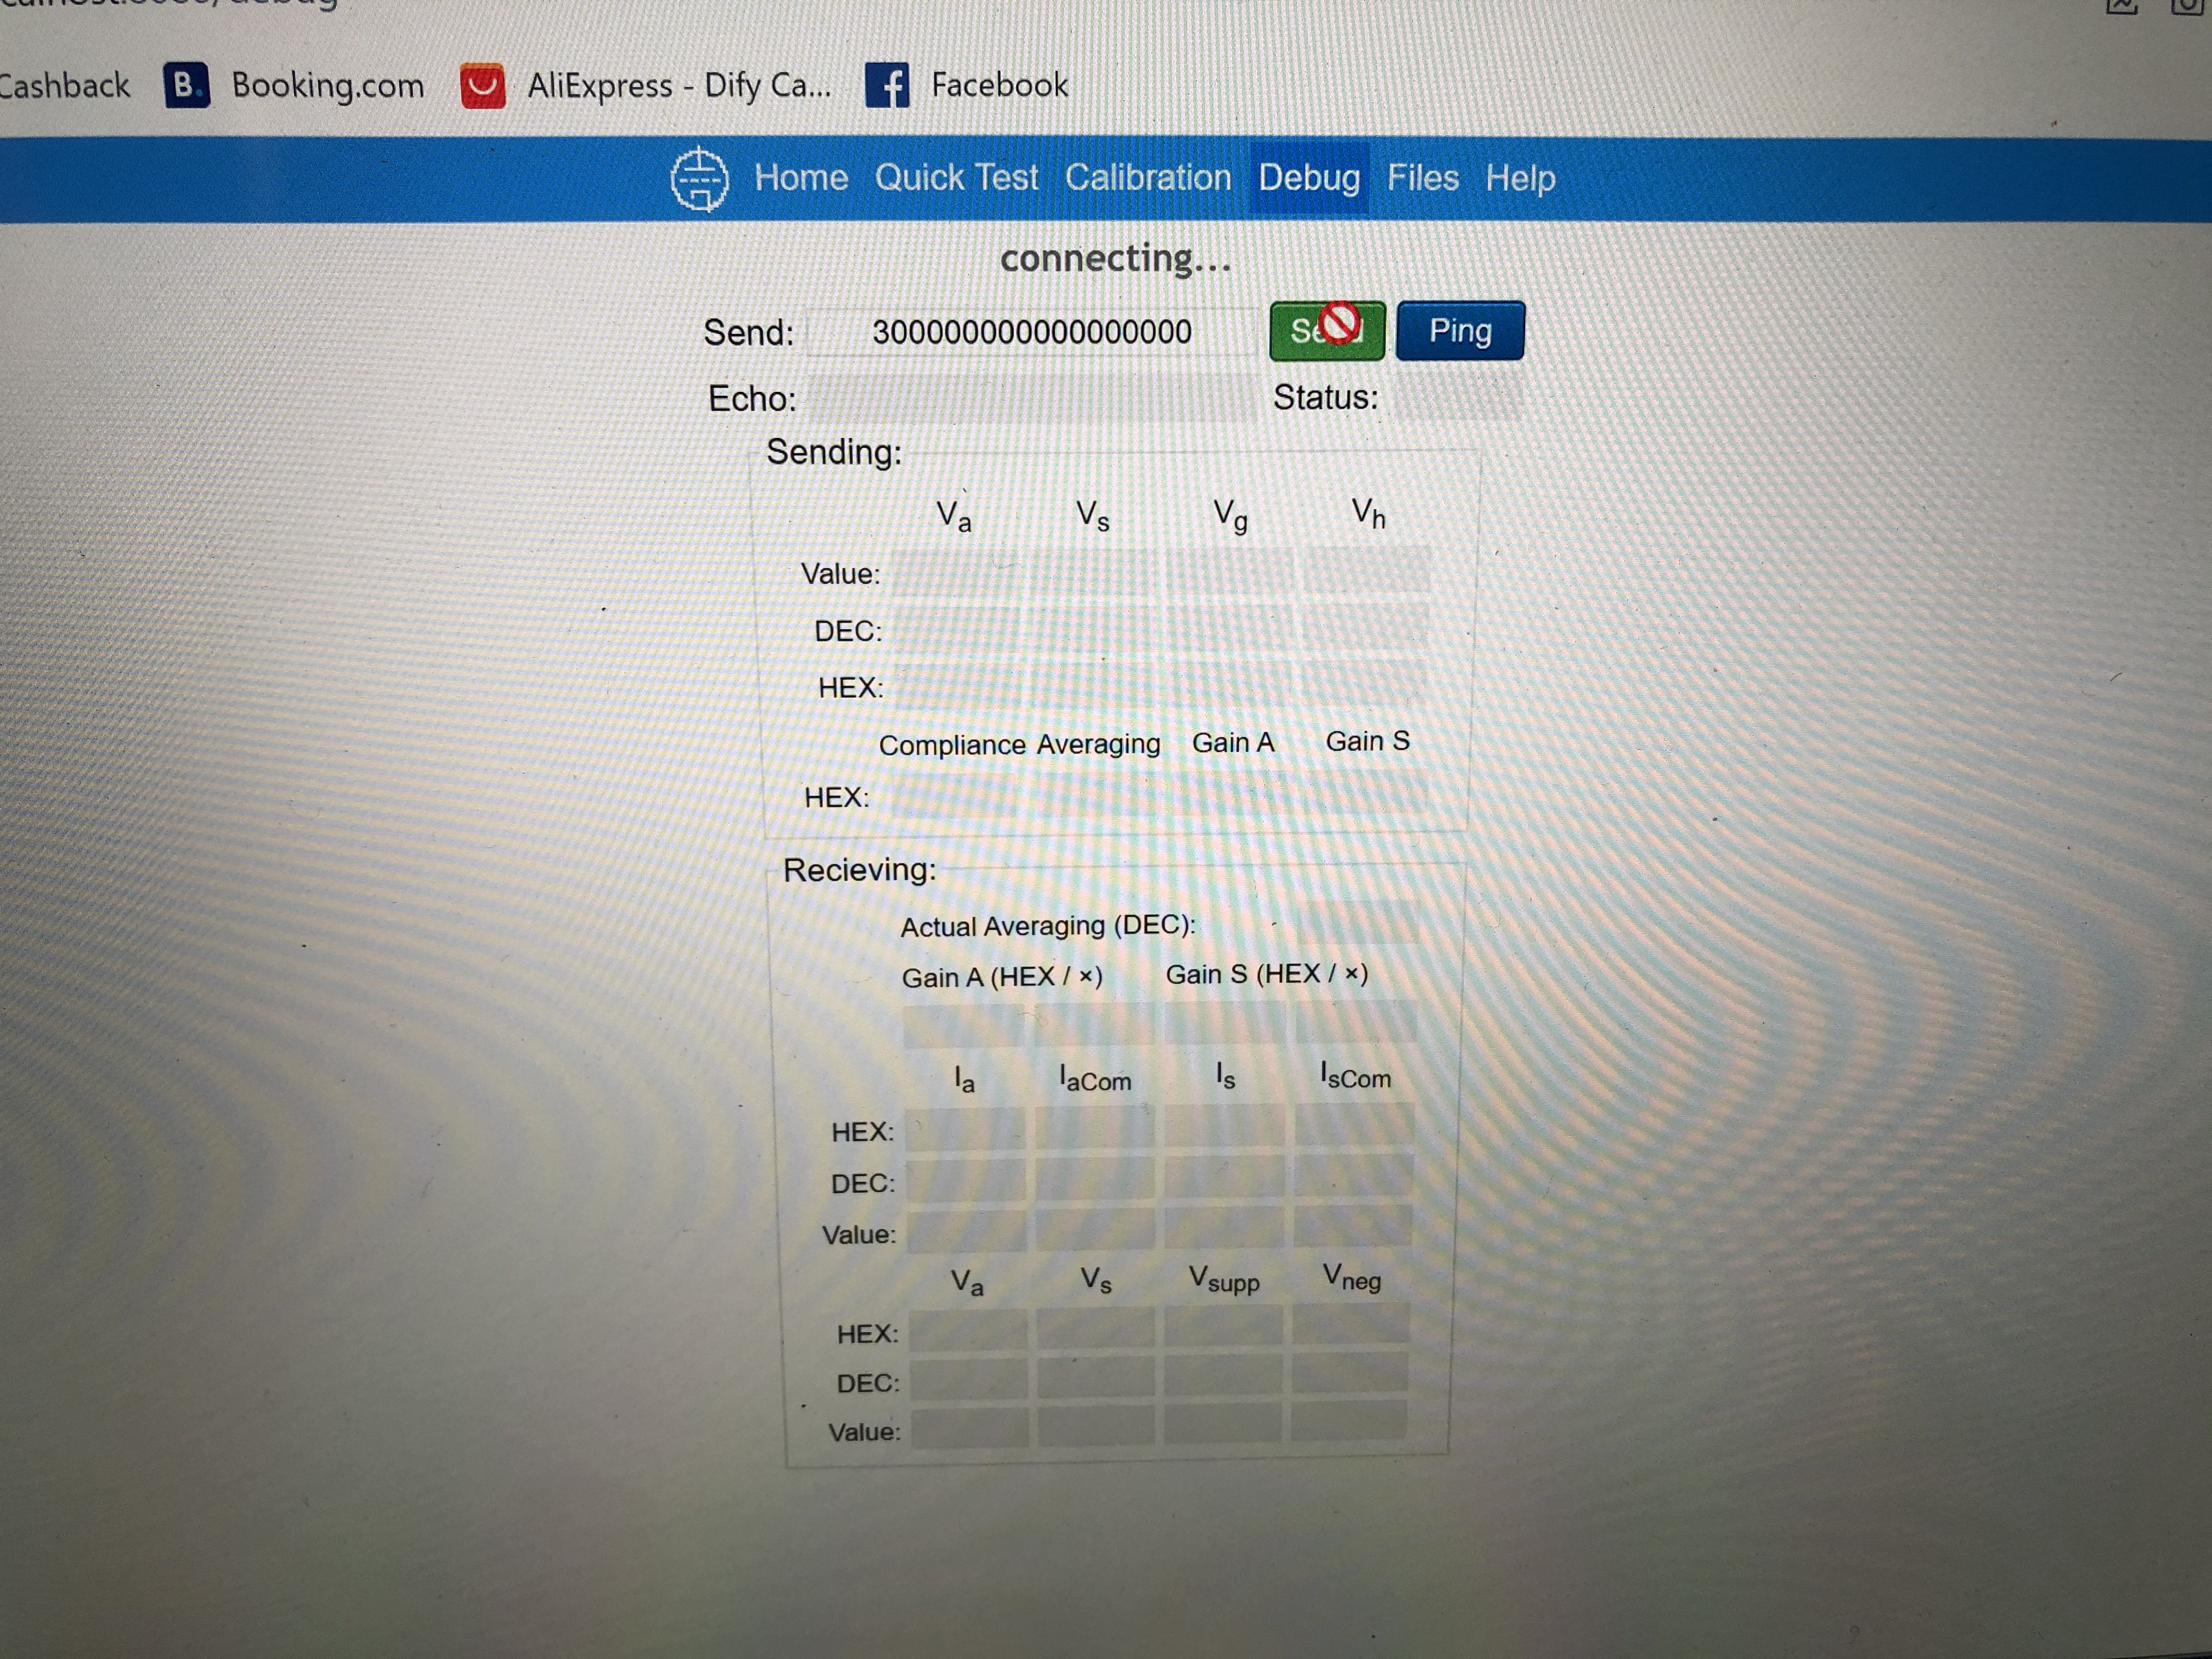
<websocket.png>On Saturday, 26 February 2022 at 19:03:37 UTC+1 jgx...@gmail.com wrote:Excellent app! I am making tests with utracer 3+, FTDI USB wire, and all seems work fine using quick test and measuring curves, but in the debug section all the time is connecting, there is no possibility of make a ping in my case. I have tried several times with no positive results.Other thing that I don’t know if it is mistake or not is that, even if you doesn’t connect the heater in the app, is possible make a measure using the quick test and curve measure.
--
You received this message because you are subscribed to the Google Groups "uTracer" group.
To unsubscribe from this group and stop receiving emails from it, send an email to utracer+u...@googlegroups.com.
To view this discussion on the web visit https://groups.google.com/d/msgid/utracer/d7268cb2-7c7a-4007-b654-31bddee7db0en%40googlegroups.com.
--
You received this message because you are subscribed to the Google Groups "uTracer" group.
To unsubscribe from this group and stop receiving emails from it, send an email to utracer+u...@googlegroups.com.
To view this discussion on the web visit https://groups.google.com/d/msgid/utracer/CALFq-68iEVmt%2BNUKhY9heXT%3DhoedWynSX9vHPNh7YEyjdAV%2BCQ%40mail.gmail.com.
D.A.R Achterberg
Op 26 feb. 2022 om 20:25 heeft D.A.R Achterberg <d.a.r.ac...@gmail.com> het volgende geschreven:
Ooooh Ihor when you talk about SSH i’m getting back nightmares when i think about all that wasted time trying to cross-compile that software to ARM64.
Ihor
\
jgx plato
To view this discussion on the web visit https://groups.google.com/d/msgid/utracer/4620732B-FB16-495B-8109-3D1174BF68DA%40gmail.com.
Nebojsa Tomic
Ihor
Nebojsa Tomic
Ihor
Nebojsa Tomic
Ihor
Ihor
Nebojsa Tomic
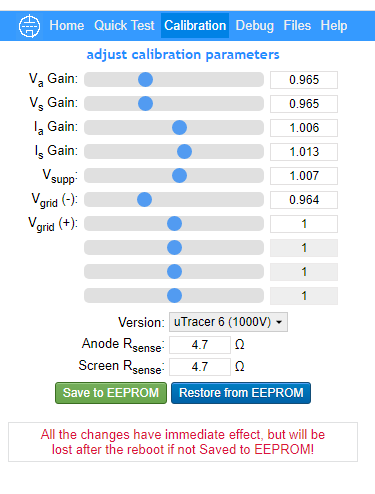
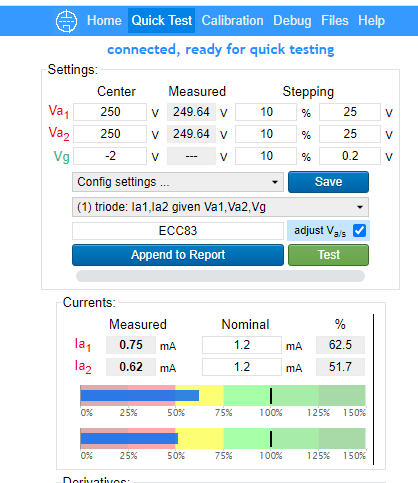
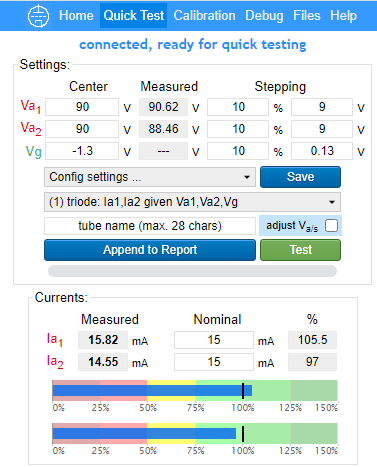
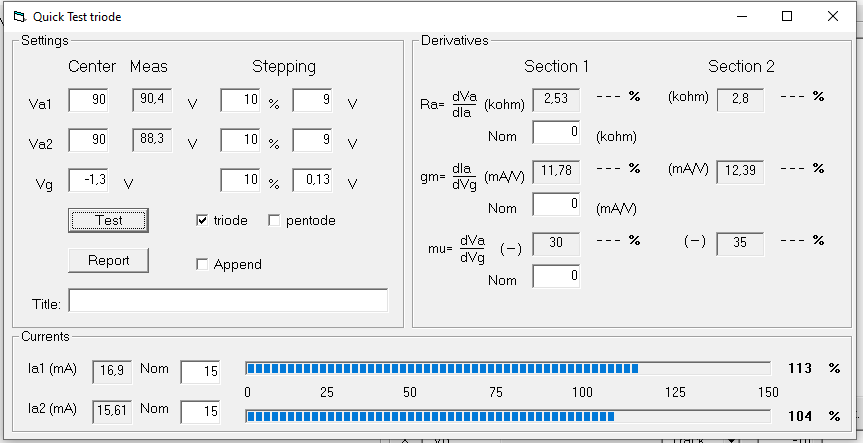
A: yes, 4.7R is set
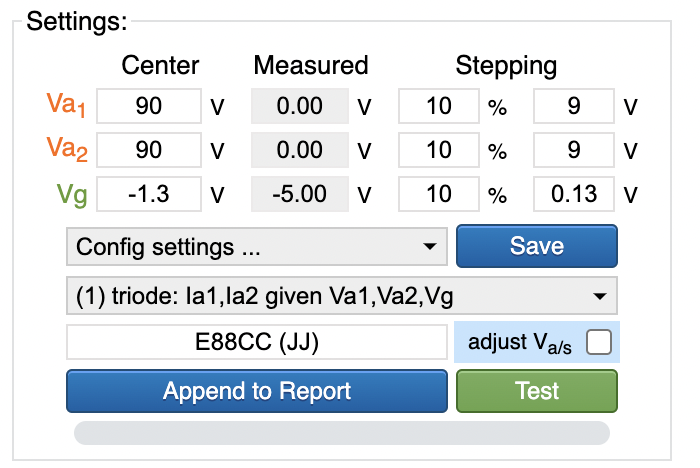
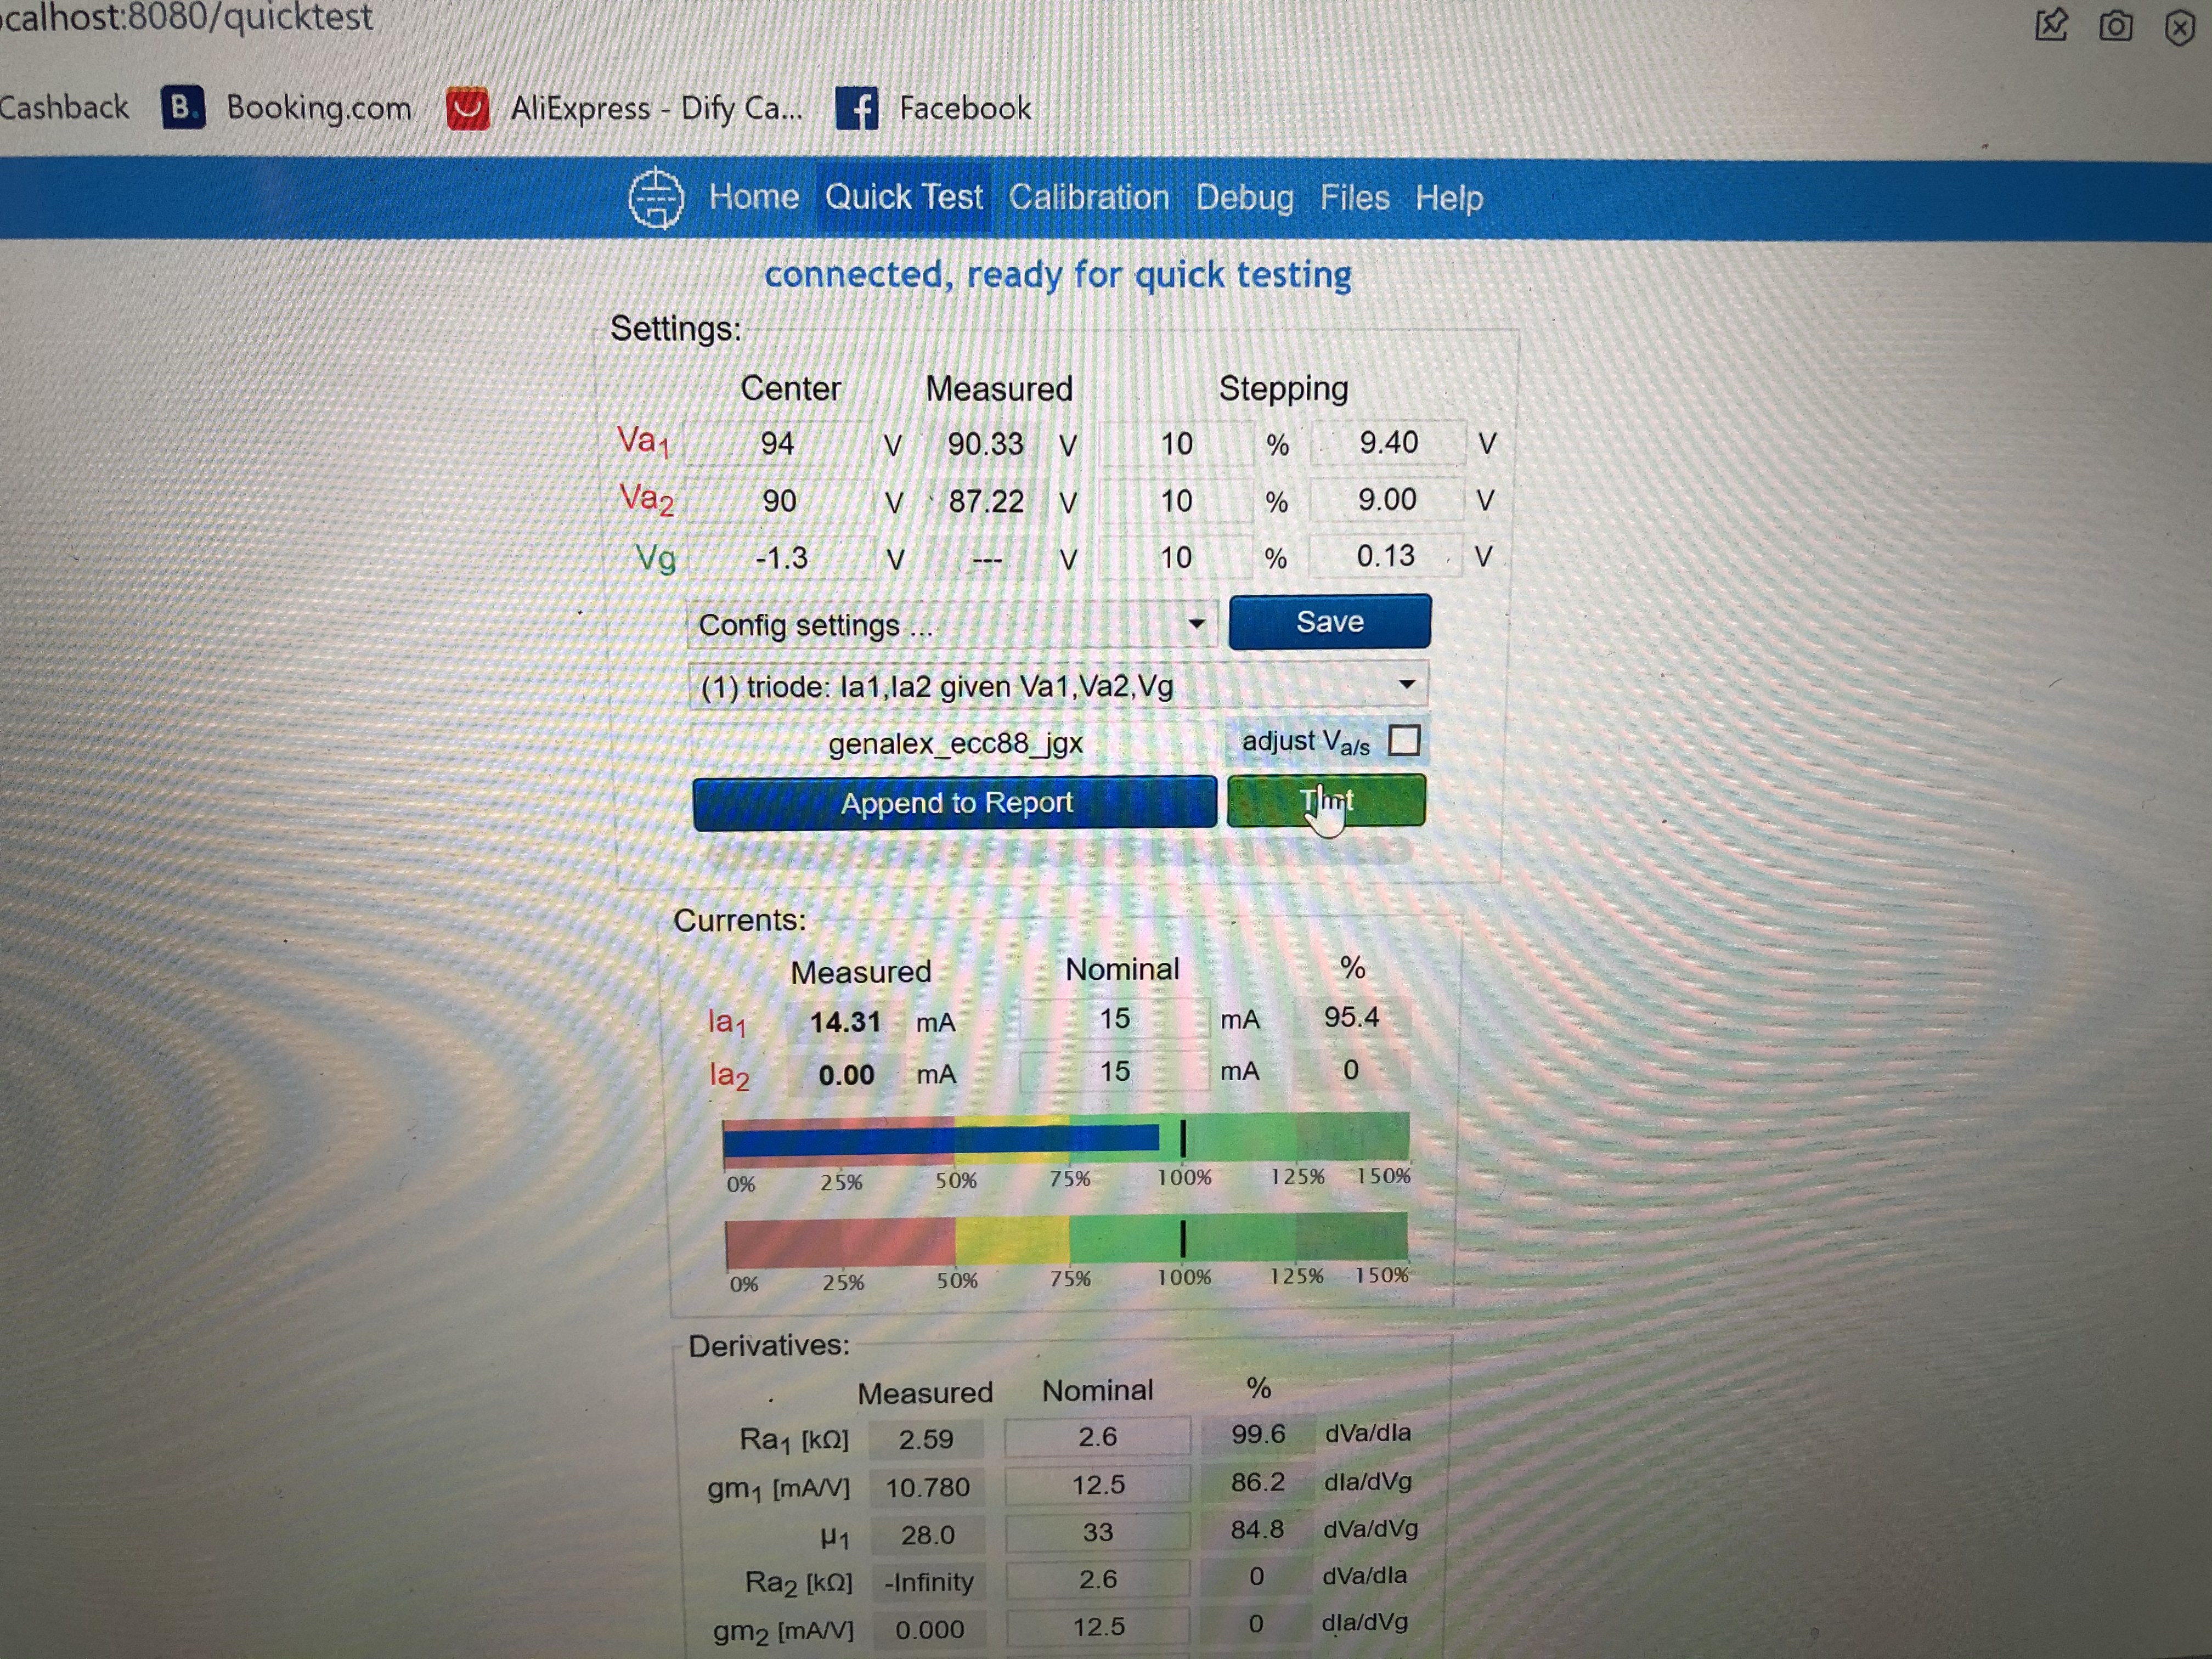
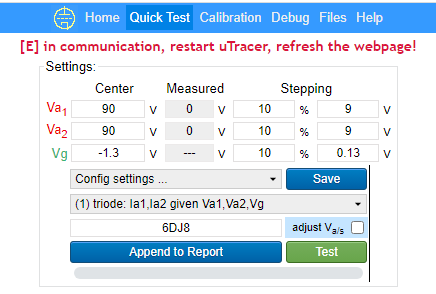
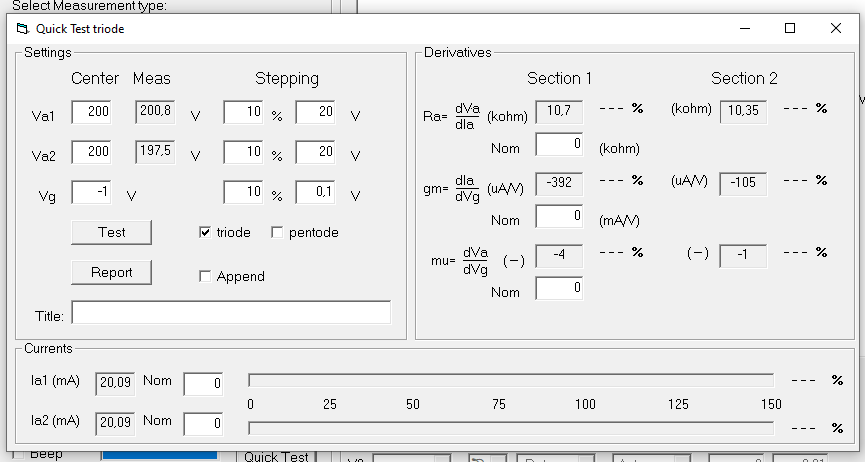
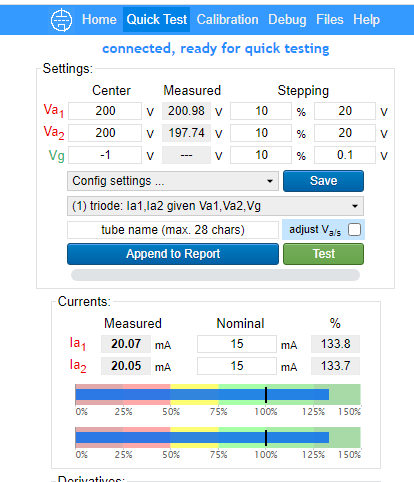
remove that checkbox "Adjust Va/Vs", then it should really make the same quicktest as the windows software
Check attached images
jgx plato
Ihor
Ihor
Nebojsa Tomic

Martin Manning
Ihor
@MPM
Nebojsa Tomic
Martin Manning
jgx plato
--
You received this message because you are subscribed to the Google Groups "uTracer" group.
To unsubscribe from this group and stop receiving emails from it, send an email to utracer+u...@googlegroups.com.
To view this discussion on the web visit https://groups.google.com/d/msgid/utracer/7c0bd32f-f76e-444a-98e3-edc1cfc6b2b5n%40googlegroups.com.
Ihor
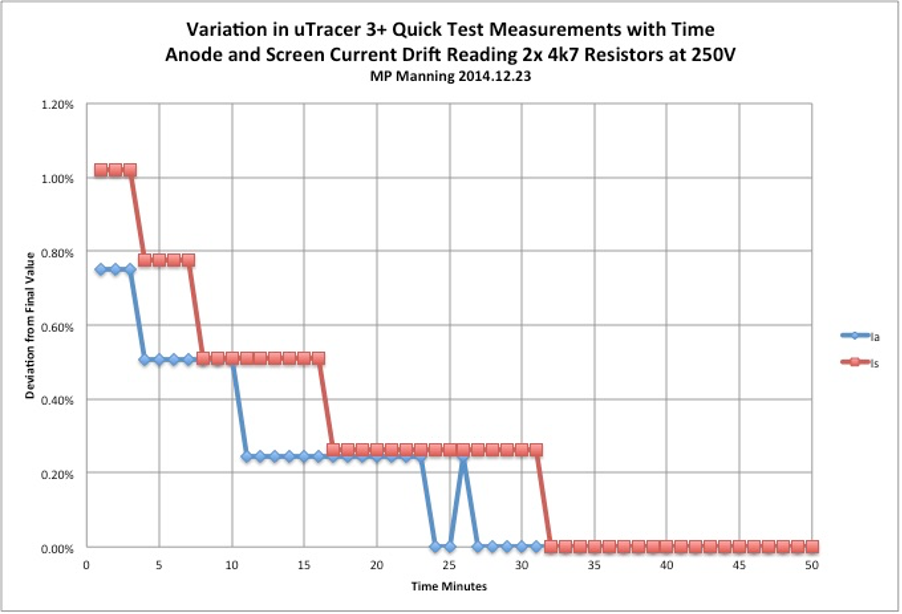
Indeed, the error is not so bad and quite acceptable in such measurements and indeed the resistor should don't heat much from short pulses and having delay of 1min in between, but there is still "improvement of the accuracy" over time and that's strange, because it means that either the measuring device changes it is characteristics over time or the device under test (resistor) or both. And from that plot it is clear that it indeed happens. The only suspicious (temperature sensitive) parts are usually semiconductors (transistors). So one experiment to complement that plot is to measure the resistor only in the beginning and then after each 10-20 mins (so really independent measurements) and see if that a property of uTracer that it has to be "preheated" like old school voltmeters and so on :)
jgx plato
--
You received this message because you are subscribed to the Google Groups "uTracer" group.
To unsubscribe from this group and stop receiving emails from it, send an email to utracer+u...@googlegroups.com.
To view this discussion on the web visit https://groups.google.com/d/msgid/utracer/29c6b48c-2827-4acc-b0f1-9144d62b50b1n%40googlegroups.com.
Martin Manning
In recent measurements of resistors looking for the explanation for a difference in screen current I have been running traces up to 300V through 470 ohm 1/2W resistors, 30 measurements at ~1/sec, topping out at over 600mA... 170W! After such a trace, the resistors are just warm to the touch. In the above plot showing the 1% drift after 30 minutes, 4k7 resistors were measured at 250V, resulting in 13W instantaneous dissipation. There is no significant change in resistance due to heating, I'd bet, and the drift is all down to temperature stabilization of the uTracer hardware.
Ihor
I am talking about the results in the quick test, the variance is small, but I never get the same reading (I haven’t calculated the mean error, sure that is low). I was proposing a more robust way to estimate the results shown in the quick test ( the way that I used to annotate the values of my tubes, maybe it is due to my engineer formation :) ).
Ihor
Nebojsa Tomic
Ihor
Nebojsa Tomic
everything works now :)
Ihor
Nebojsa Tomic
Ihor
Nebojsa Tomic
Nebojsa Tomic
Ihor Smal
Just open a command prompt at the location of your .exe file, and manually key in the name of your .exe file to run it within that window.
1.Navigate to the folder where your executable resides2.Shift-Right click and select "Command Window from here"3.type in the name of the executable and hit enter4.The process should run, but the window should stay open
Cheers,
--
You received this message because you are subscribed to a topic in the Google Groups "uTracer" group.
To unsubscribe from this topic, visit https://groups.google.com/d/topic/utracer/seaFp5pCEIA/unsubscribe.
To unsubscribe from this group and all its topics, send an email to utracer+u...@googlegroups.com.
To view this discussion on the web visit https://groups.google.com/d/msgid/utracer/23e2dcc1-67f5-414a-a0a5-bd6d7fd40407n%40googlegroups.com.
Nebojsa Tomic
pkg/prelude/bootstrap.js:1740
throw error;
^
Error: The specified module could not be found.
C:\Users\Nebojsa\AppData\Local\Temp\pkg\0d3279c2c717847d4ab775afe917aa864764820336bd4291efd50791a8db0118\@serialport\bindings-cpp\prebuilds\win32-x64\node.napi.node
at process.dlopen (pkg/prelude/bootstrap.js:2114:28)
at Object.Module._extensions..node (node:internal/modules/cjs/loader:1183:18)
at Module.load (node:internal/modules/cjs/loader:981:32)
at Function.Module._load (node:internal/modules/cjs/loader:822:12)
at Module.require (node:internal/modules/cjs/loader:1005:19)
at Module.require (pkg/prelude/bootstrap.js:1719:31)
at require (node:internal/modules/cjs/helpers:102:18)
at load (C:\snapshot\nodejs\node_modules\node-gyp-build\index.js:21:10)
at Object.<anonymous> (C:\snapshot\nodejs\node_modules\@serialport\bindings-cpp\dist\load-bindings.js:10:46)
at Module._compile (pkg/prelude/bootstrap.js:1794:22) {
code: 'ERR_DLOPEN_FAILED'
}
You received this message because you are subscribed to the Google Groups "uTracer" group.
To unsubscribe from this group and stop receiving emails from it, send an email to utracer+u...@googlegroups.com.
To view this discussion on the web visit https://groups.google.com/d/msgid/utracer/B082AB4B-96D5-46F8-895E-F5D92AAC025B%40gmail.com.
Ihor Smal
To view this discussion on the web visit https://groups.google.com/d/msgid/utracer/CAOMW_vuBiRQEVnapWvR--6fUMaAfZ8_gOHeYzazy9%3Da-SYh%3DjA%40mail.gmail.com.
Nebojsa Tomic
To view this discussion on the web visit https://groups.google.com/d/msgid/utracer/0EB55B35-6CAC-44F0-A98A-521996F68632%40gmail.com.

nickb
---------------- Starting uTracer.js 0.95 (build 20220303) ----------------------
---------------- (c) 2022, Ihor Smal, me---boffin.nl ----------------------
-------------------------------------------------------------------------------------
[....] path __dirname : C:\snapshot\nodejs
[....] path to 'data' folder : C:\Users\nick\Downloads\uTracerJS\uTracerJS
[....] path to 'js' folder : C:\snapshot\nodejs\js
[....] process.cwd() : C:\Users\nick\Downloads\uTracerJS\uTracerJS
[LOAD] Found uTracerJS.txt, getting the COM port name and localhost port from there
node:events:368
throw er; // Unhandled 'error' event
^
Error: listen EACCES: permission denied 0.0.0.0:80
at Server.setupListenHandle [as _listen2] (node:net:1317:21)
at listenInCluster (node:net:1382:12)
at Server.listen (node:net:1469:7)
at Function.serverListen [as listen] (C:\snapshot\nodejs\node_modules\express-ws\lib\index.js:42:40)
at Object.<anonymous> (C:\snapshot\nodejs\uTracer.js:2269:18)
at Module._compile (pkg/prelude/bootstrap.js:1794:22)
at Module.load (node:internal/modules/cjs/loader:981:32)
at Function.Module._load (node:internal/modules/cjs/loader:822:12)
Emitted 'error' event on WebSocketServer instance at:
at Server.emit (node:events:390:28)
at emitErrorNT (node:net:1361:8)
at processTicksAndRejections (node:internal/process/task_queues:83:21)
at process.runNextTicks [as _tickCallback] (node:internal/process/task_queues:65:3)
at Function.runMain (pkg/prelude/bootstrap.js:1848:13)
at node:internal/main/run_main_module:17:47 {
code: 'EACCES',
errno: -4092,
syscall: 'listen',
address: '0.0.0.0',
port: 80
Hi All,Recently I thought that it would probably be a good idea to make my webinterface that works in combination with ESP32 module (see the thread on this forum about "uTracer goes wireless" and also that project page http://boffin.nl/wp/utracer-and-esp32/ ) also available to other users, who do not want to deal with any hardware extensions (even though they are super easy to do). I had a bit of time and I rewrote the whole C++ backend part (which was run on ESP32) in javascript (using NodeJs) and now the same frontend that some of you already used in your web browsers can be run just locally on your desktop/laptop.As a result, you can now try this new software, uTracerJS, without any modifications to your setup, in exactly the same way as you already do with Ronald's software or uTmax/uTracer, which means that uTracer has to be connected with a computer using serial connection, either via COM-to-COM or USB-t0-COM cable. But that's exactly waht you have already, if you do not own ESP32 yet:)The project page is here:You can see more details about the installation and usage there. For now, I compiled it for the most used platforms (win, mac and linux). In my tests it runs successfully on Intel and M1 Macs, as well as, windows 10 machine. Because everything is javascript/nodejs based, I can easily create executables for any platform (alpine, linux, linuxstatic, win, macos, (freebsd)) and any architecture (x64, arm64, (armv6, armv7)), which means that uTracerJS can in principle run or all possible devices including Raspberry Pi and so on.The software is fully functional and will be slightly updated in the near future. The front-end part is already extensively tested by many users who have ESP32 module (the front-end part is exactly the same). I would appreciate any feedback and reporting of bug and inconsistencies. A few of them (for example implementation of a more advanced QuickTest which is present in ESP32 version, monitoring Debug window during acquisition, etc.) will be fixed in the near future, I just have to find more free time to do that ).One note: with a modern approach of "signing" all the executables and binaries, I am not sure how it will work for other users. Please let me know if you experienced any problems. It might be not a problem at all and this note can be ignored. I have not experienced anything like that, but at the same time all my win and mac machines are probably already in some "developer modes" meaning that I might activated some checkboxes and options on the way, during the development, and do not remember anymore what I did.Cheers,Ihor
Ihor
or
Nebojsa Tomic
Ihor Smal
--
You received this message because you are subscribed to a topic in the Google Groups "uTracer" group.
To unsubscribe from this topic, visit https://groups.google.com/d/topic/utracer/seaFp5pCEIA/unsubscribe.
To unsubscribe from this group and all its topics, send an email to utracer+u...@googlegroups.com.
To view this discussion on the web visit https://groups.google.com/d/msgid/utracer/6dabff4f-ff4c-4b89-905b-2f0171ecd337n%40googlegroups.com.
Nebojsa Tomic
Ihor
Nebojsa Tomic
Ihor
Nebojsa Tomic
--
You received this message because you are subscribed to the Google Groups "uTracer" group.
To unsubscribe from this group and stop receiving emails from it, send an email to utracer+u...@googlegroups.com.
To view this discussion on the web visit https://groups.google.com/d/msgid/utracer/ad496062-571d-42aa-99e1-933022ae3e97n%40googlegroups.com.
Ihor
Nebojsa Tomic
Ihor
Nebojsa Tomic
Ihor
Martin Manning
Ihor
Martin Manning
Ihor
Martin Manning
I suspect I'll be using your interface regularly :^) I'll watch out for any errors that come up.
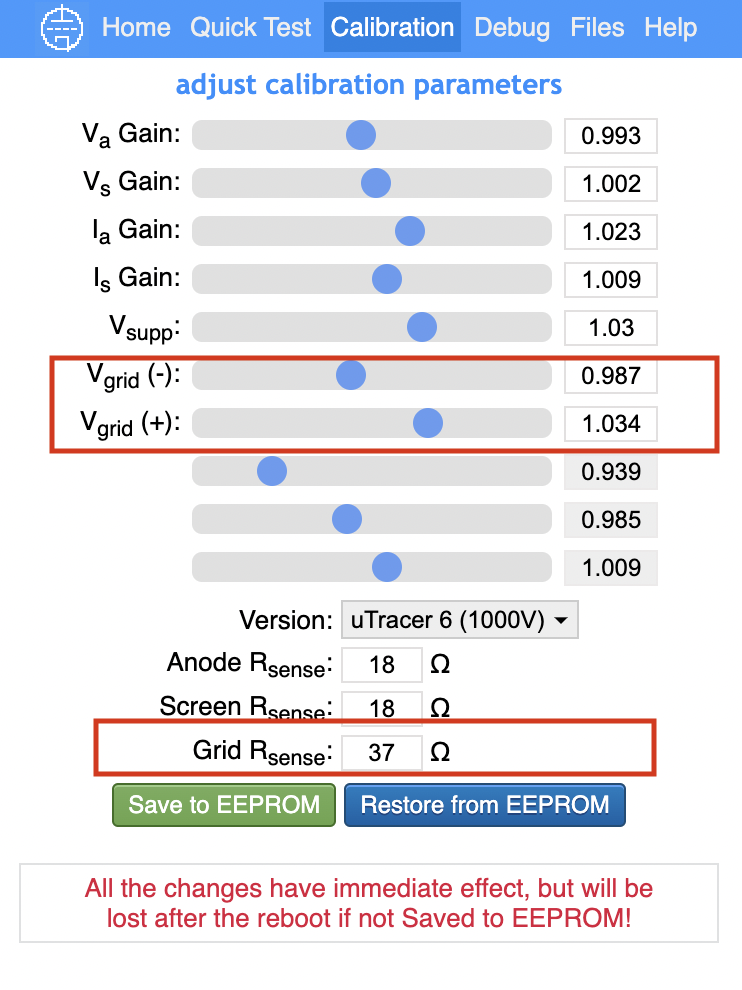
From the 400V 3+ conversion notes, located here: https://www.dos4ever.com/uTracerNotebook/Notebook.html#Current2
5. Adjusting the value of the current sense resistors
The anode and cathode currents are measured by the voltage drop over the current sense resistors R20 & R45. The standard value of the current sense resistors has been chosen such that at the maximum nominal current of 200 mA, the voltage drop over the resistor (18*0.2 = 3.6V) is well within the range of the AD converter and still allows for some “overdrive.” By adding per current sense resistor two 18 ohm resistors in parallel, the nominal current range is tripled to 600 mA. Fig. 15.3 shows how these resistors are added to the bottom side of the PCB.
In the Windows GUI, a 6 ohm input for Rsense gives the following compliance limit and steps:
600, 525, 450, 375, 300, 225, 150, 75
And for a 5 ohm Rsense:
720, 630, 540, 450, 360, 270, 180, 90
Both reflect a maximum of 3600/Rsense, which is then divided into 8 parts.
Ihor
Martin Manning
Ihor
Hi Martin,
mman...@fuse.net
To: "utracer" <utr...@googlegroups.com>
Sent: Friday, July 22, 2022 2:23:51 PM
Subject: Re: uTracerJS - software for uTracer (works on mac, win, linux and more)
You received this message because you are subscribed to the Google Groups "uTracer" group.
To unsubscribe from this group and stop receiving emails from it, send an email to utracer+u...@googlegroups.com.
Ihor Smal
Ihor
Ihor
Martin Manning
Ihor
Martin Manning
Ihor
Martin Manning
Martin Manning
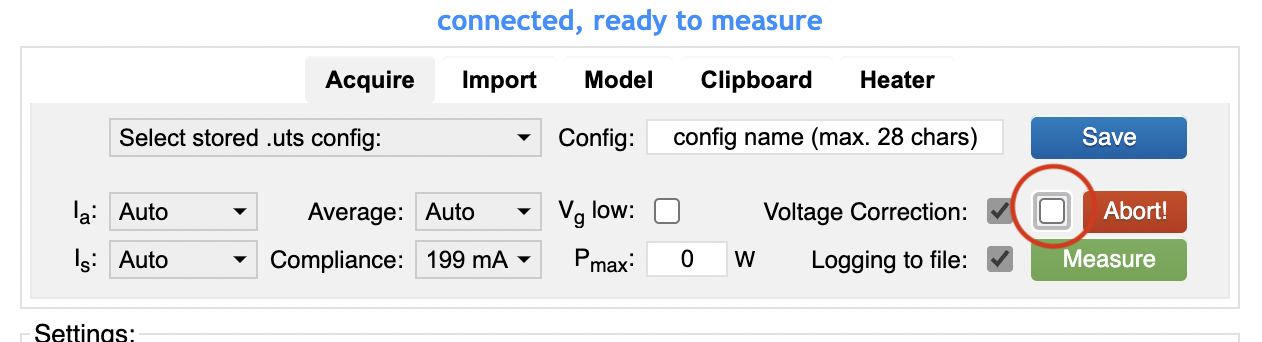
A suggestion: Why not use the space currently occupied by the Voltage Correction text and checkbox? That doesn't exist on the original Windows UI, and anyway why not always report the actual voltages from the test? This would be following the same convention as you are using on the Quick Test form. The text could say something like "Adjust Va/s to match inputs."