using the 'predict' function in unmarked
1,638 views
Skip to first unread message

Tim Henderson
May 17, 2021, 12:07:59 PM5/17/21
to unmarked
Hi, I'm having trouble using the predict function in unmarked.
I've run all my models, and this is the best model (using AIC)
fm14<-occu(~ habitat ~ survey+habitat, data=STQ_um)
Now I want to find out the detectability and the occupancy estimate. So I've done this:
#detectability
newData <- data.frame(habitat = factor(c("DryRF","DrySchl","GrassyWL","Open","WetSchl"), levels=c("DryRF","DrySchl","GrassyWL","Open","WetSchl")))
pred <- predict(fm14, type="det", newdata=newData, appendData=TRUE)
pred
and I get my output values
>
pred
Predicted SE lower upper habitat
1 0.08584068 0.01966684 0.05433488 0.13304480 DryRF
2 0.11718511 0.01108717 0.09714015 0.14072169 DrySchl
3 0.12577125 0.01312243 0.10222061 0.15381811 GrassyWL
4 0.10369650 0.01648434 0.07554840 0.14073555 Open
5 0.03873907 0.01038252 0.02280158 0.06507448 WetSchl
Great! (I think).
Now I want to do the same, but with occupancy estimate.
I'm am unsure on how to calculate this when I have two covariates on occupancy (survey+habitat). If it was just one covariate (habitat for example), I would just change "det" to "state" and it would work. But if I do it with survey+habitat as covariates, it says 'object survey not found'.
Does anyone know what I do here to get occupancy estimate??
Thanks!

Tom Bruce
May 17, 2021, 7:56:54 PM5/17/21
to unmarked
Hey,
Nice to see someone else working in Australia. My first word of caution would your detection probabilities look quite low especially in the wet sclerophyll and dry rainforest, this could potentially make any reliable modeling challenging. Have you run a goodness of fit test on the global model to check for overdispersion etc?
Now for the occupancy estimate, it should be easy enough
Here is some example code where I'm comparing how habitat and understory vegetation influence occupancy.
test<-occu(~Effort ~Habitat+Low_veg,species)# Example model
preds_syn<-data.frame(Habitat=Habitat, Low_veg=Low_veg) #Predictors in data frame
Hab_LV_Psi<-predict(test,type="state",newdata=preds_syn,appendData=T) #create dataframe with predictons and variables tied together.
print(Hab_LV_Psi)# print the list.
Predicted SE lower upper Habitat Low_veg
1 0.5804043 0.08381513 0.4133561 0.7308570 Hab_1 -0.32180924
2 0.5844523 0.08142305 0.4216476 0.7306983 Hab_1 -0.25678236
Tim Henderson
May 17, 2021, 9:07:15 PM5/17/21
to unmarked
Thanks Tom,
I have edited as per your example, however I get this error:
Error in data.frame(habitat = habitat, survey = survey) : arguments imply differing number of rows: 5, 3.
So what I did was to merge the two:
newData1<-data.frame(habitat=habitat)
newData2<-data.frame(survey=survey)
total <- merge(newData2,newData1)
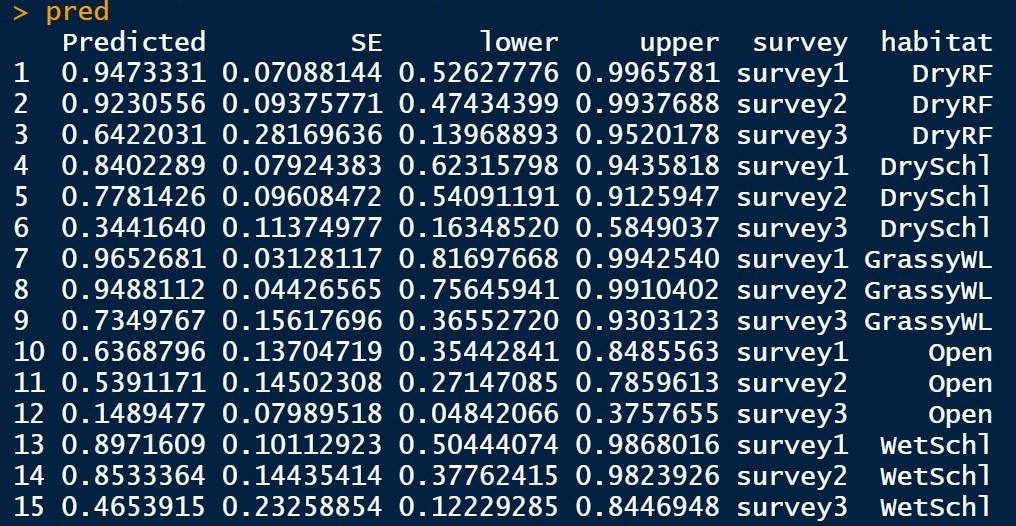
pred <- predict(fm14, type="state", newdata=total, appendData=TRUE)
pred
and output is:
Does this seem correct to you??
Cheers!
Tom Bruce
May 17, 2021, 9:29:16 PM5/17/21
to unmarked
Yeah as far as I can tell that should be what you're expecting as you're basically predicting the state against two categorical variables right? That means you'll only have one value per combination of survey and habitat type.
One thing to bear in mind could be that if your surveys are at different times you might want to look into a different occupancy model type as the single-season assumes that the population is closed. However, if you're expecting to see a change in your species population between surveys then maybe a multi-season occupancy model might be more appropriate. Anyway, just a thought, keep on plugging on looks like you're making progress.

Divya Vasudev
May 18, 2021, 6:38:00 AM5/18/21
to unma...@googlegroups.com
Dear Tim,
Since what you need is all combinations of your two categorical covariates, one way to get this would be to use the function expand.grid.
new.data = expand.grid(survey = levels(STQ_um$survey),
habitat = levels(STQ_um$habitat))
That should give you a data.frame with all combinations of survey and habitat that are present in your data, which can then be fed into the predict function.
best wishes,
Divya
----------------
Conservation Initiatives
DST–INSPIRE Faculty
Member – IUCN Connectivity Conservation Specialist Group
Member – IUCN Section on Small Apes
Alumna – University of Florida and WCS–NCBS Master's Program in Wildlife Biology and Conservation, Bangalore, India
--
You received this message because you are subscribed to the Google Groups "unmarked" group.
To unsubscribe from this group and stop receiving emails from it, send an email to unmarked+u...@googlegroups.com.
To view this discussion on the web visit https://groups.google.com/d/msgid/unmarked/c85f640a-3500-406d-bf57-70b2a6eedb6cn%40googlegroups.com.

Daniela M-Holland
May 18, 2021, 6:38:00 AM5/18/21
to unmarked
Hi there,
Are you by any chance looking at occupancy of spotted-tail quolls? In case you are, I am working on northern and would be great to have a chat !
Tim Henderson
May 18, 2021, 7:48:50 AM5/18/21
to unma...@googlegroups.com
Thanks Divya!
Would you happen to know how to do this if one of the covariates were a continuous variable? For example, lure age (which increase by occasion length) + habitat.
Kind regards,
Tim
To view this discussion on the web visit https://groups.google.com/d/msgid/unmarked/CABcVe0yQY_YcubM1JWib0TqvWrqC6-PS_fGRKscwg_D8M_n65w%40mail.gmail.com.
Divya Vasudev
May 18, 2021, 9:37:15 AM5/18/21
to unma...@googlegroups.com
I think this should work:
new.data = expand.grid(lure = seq(min(STQ_um$lure), max(STQ_um$lure), length.out = 50),
habitat = levels(STQ_um$habitat))
This should give you a range of 50 lure values, from the min to max based on your data, for each habitat type. You can change the number of lure values, or any other parameters as per how you want to predict.
best wishes,
Divya
To view this discussion on the web visit https://groups.google.com/d/msgid/unmarked/CACUmFw3%3D_79winep%2B5A18znf76eQq2bUZbMpsJxeaZqsaCGQGg%40mail.gmail.com.
Tim Henderson
May 19, 2021, 3:48:10 AM5/19/21
to unmarked
Hi Tom,
With regards to your second comment, I'm trying to decide whether single-season of multi-season is more appropriate. Dates for my 3 surveys are S01=May/June, S02=Aug/Sept, S03=Nov/Dec, all in the same year. Based on the ecology of my study animal (quoll), their mating season is May-July/Aug, post-mating (i.e female denning) is Sept-Nov, then Juvenile dispersal is Nov-onwards. Therefore, we would expect changes in the population such as male die-off post-mating (e.g. S02), and new juveniles in S03. So based on that, I would think multi-season is the one to go with. However, my question is less related to the effect of survey on occupancy, but rather occupancy between habitat types and treating survey periods as 'replicates/pseudo-replicates' to compare occupancy for each habitat type between survey periods (e.g. do each surveys have a similar pattern on one habitat type having higher occupancy than the others, but occupancy overall decrease from S01 to S03). I'm less familiar with multi-season, though it does seem much more complex, especially given the question I want asked. So at the moment my choices are: do I do a single-season occupancy analysis for 1) each individual survey, 2) all surveys combined, using survey as a covariate, or 3) multi-season.
If you (or anyone else) has some extra advice on this that would be appreciated!
Thanks,
Tim
Reply all
Reply to author
Forward
Message has been deleted
0 new messages