Categorical variables used in modelling occupancy return a high df value
290 views
Skip to first unread message

Dylan Westaway
Jun 17, 2021, 1:28:06 PM6/17/21
to unmarked
Hi,
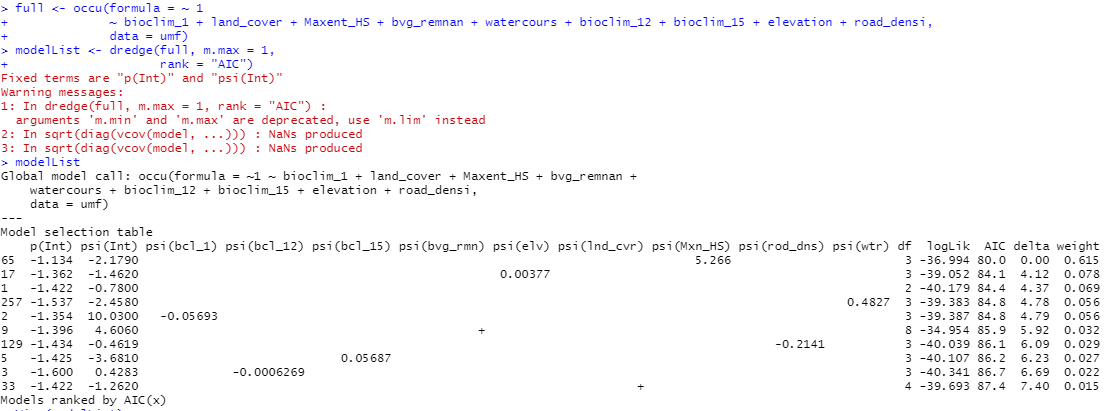
I'm modelling occupancy for an owl species with parameters such as: bioclimatic variables, elevation, density of watercourses, etc.
Everything works fine except I'm unsure about my 2 categorical variables (bvg_rmn = broad vegetation group and lnd_cvr = land use type) which seem to display high df values and show plus symbols instead of numbers in the table (see below). I only want to use one parameter at a time in my modelling so I would expect each model would have a df (number of parameters) value of 3 (1 parameter plus 2 intercepts) but for bvg_rmn df = 8 and lnd_cvr = 4. Within my data there are 7 categories of bvg_rmn and 3 categories of lnd_cvr so it seems this is driving the df.
I'm just wondering if this is an issue? and if it is, how can I fix it?
Thanks in advance,
Dylan

geom...@gmail.com
Jun 17, 2021, 9:45:30 PM6/17/21
to unmarked
For a categorical variable with k levels affecting occupancy and the null model for detection, there should be k-1 effects on occupancy (which represent a difference in occupancy from the reference level) + 1 intercept for occupancy (representing the reference level) + 1 intercept for detection. So the df output looks like it's counting the parameters correctly. I don't know enough about dredge to know why it only shows a + instead of displaying all the k-1 effects of the categorical variables. If you post the model summary for occu(~1 ~bvg_rmn,data=umf) we could see if the results make sense.
Dylan Westaway
Jun 20, 2021, 2:13:18 PM6/20/21
to unmarked
Ok, so you think it's fine for one parameter to return a d.f of 8? Does this mean that no. of parameters and d.f are not always equal? I have seen papers where a single categorical variable (with 4 classes) is listed as having no. of parameters = 3 (2 intercepts + 1 variable).
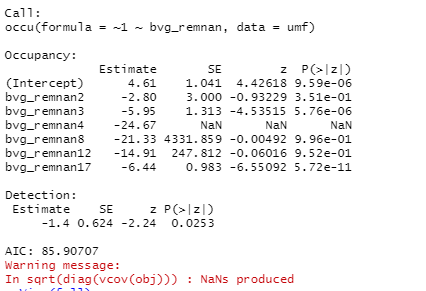
I think this is the model summary you were talking about. My dataset contained bvg classes 1, 2, 3, 4, 8, 12 and 17. Not sure why 1 isn't included below?
Thanks,
Dylan
geom...@gmail.com
Jun 20, 2021, 9:28:21 PM6/20/21
to unmarked
The reason bvg class 1 isn't included is because it's the intercept. With k levels, you will have k-1 effects plus the intercept. However there seems to be a serious estimation problem, based on these results. I'm guessing the levels of bvg_remnan categories add to 100%, or nearly 100%. If that's the case then the categories are completely collinear, and you can't use all the levels in the model. You might just include 1 or 2 of the veg types that you have a theoretical reason to believe have a strong influence on occupancy.
Dylan Westaway
Jun 24, 2021, 10:51:53 AM6/24/21
to unmarked
Thanks for your responses. There are around 20 bvg categories in the entire study area but my 60 sites for which we are determining occupancy occur across 8 bvg categories. So, yes, I guess that means that the 8 categories included in the covariate "bvg_remnan" add to 100% of the categories observed across the 60 sites. What does it mean for the categories to be collinear? Is there a way to extract just a few bvg categories as you suggested? Or is the way to do it to remove the bvg column from the original data and instead include each relevant category as its own column i.e., rainforest and then give each site a 1 or 0 based on whether it occurs in rainforest?
Thanks a lot for the help, much appreciated.

Kery Marc
Jun 24, 2021, 11:31:39 AM6/24/21
to unma...@googlegroups.com
Dear Dylan,
Ahhhh .... if I allow myself to be brutally honest here, then I would vote for you to go back and first do a minimal amount of homework.
It seems that you lack an understanding of even the absolute basics of linear models. I believe that any applied scientist must understand how linear models are specified and how you interpret their parameters, also (or: especially) for factors. This is
not something that somebody else on the list should try to do for you.
If you fit these simple statistical models without at least some grasp of the linear model, then the risk of doing bogus is far too great.
Best regards --- Marc
_____________________________________________________________
Marc Kéry * * * * *
+41 41 462 97 93
marc...@vogelwarte.ch
www.vogelwarte.ch
Swiss Ornithological Institute | Seerose 1 | CH-6204 Sempach | Switzerland
_____________________________________________________________
+41 41 462 97 93
marc...@vogelwarte.ch
www.vogelwarte.ch
Swiss Ornithological Institute | Seerose 1 | CH-6204 Sempach | Switzerland
_____________________________________________________________
*** BOOKS:
see www.hierarchicalmodels.com ***
*** Brand-new ***
- Kéry & Royle (2021): AHM2 - Applied hierarchical modeling in ecology, Vol. 2, Dynamic and advanced models, Academic Press. --- Everything you always wanted to know about spatio-temporal hierarchical models, false-positives, species interactions, spatial models, integrated models, the new SCR/HDS synthesis, and much more ... Published in October 2020.
- Kéry & Royle (2021): AHM2 - Applied hierarchical modeling in ecology, Vol. 2, Dynamic and advanced models, Academic Press. --- Everything you always wanted to know about spatio-temporal hierarchical models, false-positives, species interactions, spatial models, integrated models, the new SCR/HDS synthesis, and much more ... Published in October 2020.
- Schaub & Kéry (2021): IPM - Integrated Population Models, Academic Press. --- EVERYTHING about IPMs. Due in late 2021.
*** Older books ***
- Kéry & Royle (2016): AHM1 - Applied hierarchical modeling in ecology, Academic Press, Vol. 1, Prelude and Static Models
- Kéry & Schaub (2012): BPA - Bayesian Population Analysis using WinBUGS, Academic Press
- Kéry (2010): Introduction to WinBUGS for Ecologists, Academic Press
- Kéry & Royle (2016): AHM1 - Applied hierarchical modeling in ecology, Academic Press, Vol. 1, Prelude and Static Models
- Kéry & Schaub (2012): BPA - Bayesian Population Analysis using WinBUGS, Academic Press
- Kéry (2010): Introduction to WinBUGS for Ecologists, Academic Press
From: unma...@googlegroups.com [unma...@googlegroups.com] on behalf of Dylan Westaway [dwest...@gmail.com]
Sent: Thursday, June 24, 2021 13:43
To: unmarked
Subject: [unmarked] Re: Categorical variables used in modelling occupancy return a high df value
Sent: Thursday, June 24, 2021 13:43
To: unmarked
Subject: [unmarked] Re: Categorical variables used in modelling occupancy return a high df value
--
You received this message because you are subscribed to the Google Groups "unmarked" group.
To unsubscribe from this group and stop receiving emails from it, send an email to unmarked+u...@googlegroups.com.
To view this discussion on the web visit https://groups.google.com/d/msgid/unmarked/7c72cef8-3cdf-4b08-858e-f63ba50dcccbn%40googlegroups.com.
Reply all
Reply to author
Forward
0 new messages