pcountOpen

247 views
Skip to first unread message

Monika Sündermann

unread,
Jul 11, 2018, 6:14:17 PM7/11/18
to unmarked
Hey everybody,

first I have to say that I have never worked with R before, so I am an absolute beginner. I'm doing my bachelor thesis right now and I have to do my analyses with pcountopen, as i want to investigate seasonal variation in species abundance from 2011 to 2017, because I want to know how the population size changes over the years. For this I evaluate detections from camera traps, which I already summarized weekly.

According to the unmarkedFramePCO I need an MxJT matrix of the repeated count data, where M is the number of sites, J is the maximum number of secondary sampling periods per site and T is the maximum number of primary sampling periods per site. Can someone tell me what secondary sampling periods and primary sampling periods per site are, because I habe absolutely no idea?

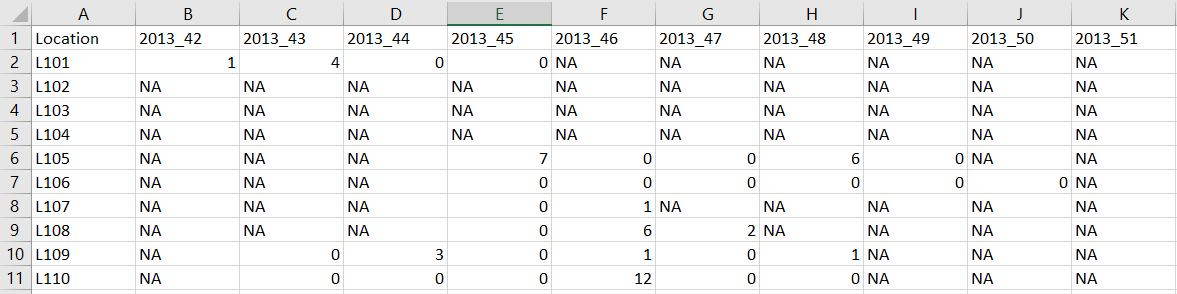
I attached just a small excerpt from the matrix that I would like to use. The rows show the different camera locations and the columns indicate the weeks of each year (year_week). I have a total of 60 rows and 364 (7 x 52) columns. "NA" means camera was not active, "0" means that the camera was active, but there were no detections and the numbers represent the number of detections.

I thought of replacing detections against the corresponding year in order to see whether macaque abundance has changed over the years. And I would like to do it in the same way for saisonality (using the months), logging (0 for the year in which logging occurred the first time, 1 for the year after the logging event, 2 for the second year after logging etc.) and the presence of predators (using the number of total detections) as well. Is it possible to use the attached matrix for these observation covariates?


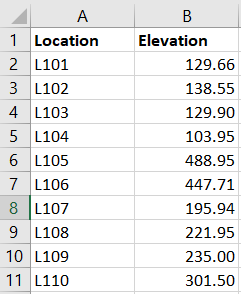
I would also like to include elevation as a site specific covariate. I also attached a matrix for this and would like to know if one can use it for site covariates.


I would be very happy about an answer, because I do not have much time left to complete my work and I just can not get any further. Thank you very much!


Cheers,

Monika


obsCovs_matrix.png
siteCovs_matrix.png

Hardin Waddle

unread,
Jul 12, 2018, 8:38:06 AM7/12/18
to unma...@googlegroups.com
Hi Monika-

I assume you did not collect all of these data since it goes back to 2011 and you are doing a Bachelor's thesis. So, I would advise you to talk to the people who designed the study to make sure that your model is compatible with the design.

Primary and secondary periods are jargon terms that originated with Pollock's robust design for mark-recapture analysis. I suggest you look up some reference literature on the robust design, but essentially, secondary periods are the multiple surveys done within a primary period. The population is assumed to be closed (another jargon term meaning no births/deaths/immigration/emigration) across all of the secondary periods in a primary period. Then, across primary periods, the population is open.

Since you have 7*52 columns, and 7 years of data, I guess you have one value for each week. If you are comfortable making the assumption of closure within each year, then you would have 7 primary periods with 52 secondary periods, each.

You might want to consider coding years after logging (0,1,2,....) as a factor or find another way to model it that would give you an effect for each year, rather than forcing a linear model of the logging effect.

Good luck!

--
You received this message because you are subscribed to the Google Groups "unmarked" group.
To unsubscribe from this group and stop receiving emails from it, send an email to unmarked+unsubscribe@googlegroups.com.
For more options, visit https://groups.google.com/d/optout.

Message has been deleted

ms73...@studserv.uni-leipzig.de

unread,
Jul 12, 2018, 5:29:07 PM7/12/18
to unmarked
Hi Hardin,

Thank you for your detailed answer. You are right, I did not collect the data by myself and we have already spoken to people, who did nearly the same with unmarked, but unfortunately nobody has experience with pcountOpen.

So would it be better to use two different matrices for primary and secondary sampling periods or can I put all data in one matrix like the obsCovs matrix?

And do you know what starting values should make sense for fitting the models?

Cheers,
Monika
To unsubscribe from this group and stop receiving emails from it, send an email to unmarked+u...@googlegroups.com.

Timothy Lyons

unread,
Jul 14, 2018, 8:04:52 AM7/14/18
to unmarked
All of the observation data goes into a single matrix. Take a look at the example code with the umarkedFramePCO function in the unmarked package. It walks through step-by step how to format each of the constituent pieces of information and how to build the data object. And you can just cut and paste the code.

Davy Black

unread,
Jul 22, 2018, 12:00:46 PM7/22/18
to unmarked
Hi Monika,

I would look into whether pcountOPEN is truly the function you are looking for. I think using camera trap detection data, it would be difficult to sample abundances which is the input format of pcount functions. In order to model abundance you might need to use something like occuRN, to model abundance from presence/absence data. 

Davy
Reply all
Reply to author
Forward
0 new messages