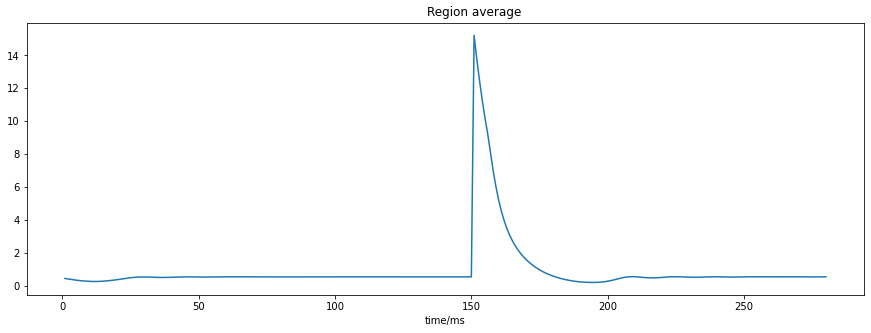
Stimulatus applied on surface produced unrealistic result

Nephiloso Wu
stim_size = 8
dt = 0.1
# Define a spatial pattern
# Define a stimulus
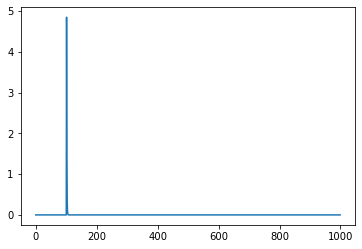
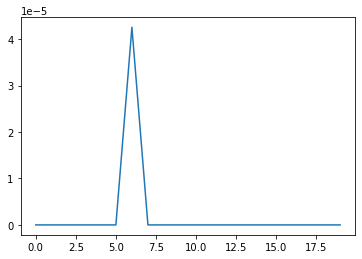
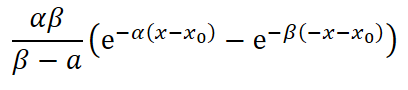
eqn_t = equations.Alpha() # belongs to a family of exponential function, used for visual stimulus
eqn_t.parameters['onset'] = 200 # ! Time point of stimulus onset
eqn_t.parameters['alpha'] = 43
eqn_t.parameters['beta'] = 12
eqn_s = equations.DiscreteEquation()
deck = list(range(1, default_cortex.surface.number_of_vertices))
random.shuffle(deck)
focal = np.array(deck[:stim_size])
stimulus = patterns.StimuliSurface(surface=default_cortex.surface,
focal_points_triangles=focal,
temporal=eqn_t,
spatial = eqn_s)
stimulus.configure_time(np.arange(0.,500, dt)) # apply a stimulus at 25s

WOODMAN Michael
hi,
Just to check, (1) are you sure the peaks aren't 4e-5 and 5e-5 respectively? your figure seems to be cut off. otherwise, indeed it may be a bug to look into, as dt should not affect the alpha function value beyond discretisation error.
(2) In this model, the firing rates aren't bound, so they can exceed those limits in some circumstances such as a very strong stimulus.
Lastly, the alpha function is well known in computational neuroscience in synaptic modelling. This chapter may be of use
https://web.njit.edu/~horacio/Math451H/download/ErmentroutTerman_Chapter7.pdf
cheers,
Marmaduke
Sent: Wednesday, June 22, 2022 8:39:12 PM
To: TVB Users
Subject: [SUSPECTED SPAM] [TVB] Stimulatus applied on surface produced unrealistic result
You received this message because you are subscribed to the Google Groups "TVB Users" group.
To unsubscribe from this group and stop receiving emails from it, send an email to tvb-users+...@googlegroups.com.
To view this discussion on the web visit https://groups.google.com/d/msgid/tvb-users/0b89496f-98c3-45c7-8274-de4e47e62739n%40googlegroups.com.
Nephiloso Wu

NeuroLife
WOODMAN Michael
hi,
> the noise is not scaled to match the dt in the stochastic integration scheme
The stochastic schemes scale the noise by sqrt(dt) which can be found in any reference on stochastic differential equations such as Higham 2001
https://epubs.siam.org/doi/pdf/10.1137/S0036144500378302
and in the code here
https://github.com/the-virtual-brain/tvb-root/blob/master/tvb_library/tvb/simulator/noise.py#L201
> as you decrease the dt you also increase the amount of noise in the integration over all
The number of random samples used for simulation does increase when decreasing dt, but if that induces a radical change, then there is likely a convergence issue with the larger value of dt. In other words, the features of the model that are of interest,
should be invariant with respect to dt, once dt is small enough.
> For example, under the same parameter setting of Wilson-Cowan model, the PSD peak of dt=0.5 is at 7.8125 Hz, while the peak of dt=1 is at 25.87890625Hz.
Can you share the code (privately if you wish) to reproduce this please?
cheers,
Marmaduke
Sent: Tuesday, June 28, 2022 3:03:28 AM
To: TVB Users
Subject: [RESEAUX SOCIAUX] Re: [SUSPECTED SPAM] [TVB] Stimulatus applied on surface produced unrealistic result