Problems on the Spectrogram Visualization
12 views
Skip to first unread message

Martin Iñiguez
Oct 8, 2022, 6:38:45 AM10/8/22
to TVB Users
I am following the Tutorial 1.
Building Your Own Brain Network Model — TVB 2.3-16440 documentation (thevirtualbrain.org)
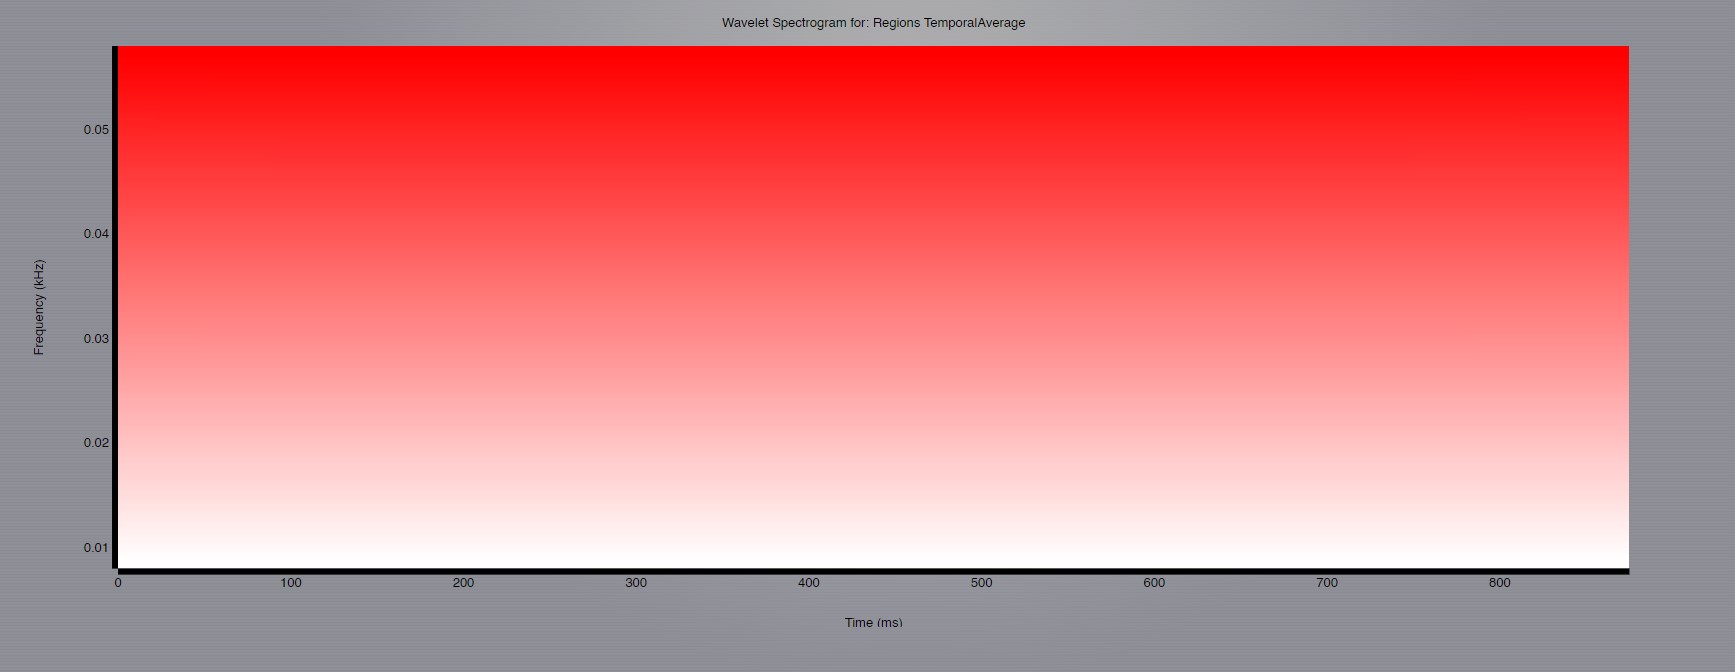
And I am having a weird plot coming out of the Spectrogram of the Simulation B (no stochasticity)
What may be going wrong?
Thanks for the help,
Martin

Lia Domide
Oct 9, 2022, 4:38:14 PM10/9/22
to TVB Users
Hi,
I confirm this is happening when you launch just the default Wavelet Transformation.
Unfortunately the tutorial says nothing about the params used when computing the Continous Wavelet Transform Analyzer.
Have you tried to launch it from under the Analyzers tab, and adjust the input parameters (e.g. make sure the "sample period" is an exact multiple of the TS period as it writes in the tooltip, and play with the other params) ?
Best,
Lia.
Lia Domide
Oct 9, 2022, 6:13:30 PM10/9/22
to TVB Users
Please ignore my previous answer.
We seem to have a bug in the latest versions of TVB related to the Wavelet calculations: https://req.thevirtualbrain.org/browse/TVB-2946
I propose a fix here: https://github.com/the-virtual-brain/tvb-root/pull/594
After this fix, I managed to reproduce the results from Tutorial 1, only with the default params on the Wavelet analyzer.
You could use this branch directly, in case you are using tvb from github, or keep an eye for future releases of TVB.
Thank you for reporting this!
Lia.
Reply all
Reply to author
Forward
0 new messages