Some confusion in BVEP paper

刘政

meysam....@gmail.com
刘政
刘政
meysam....@gmail.com
meysam....@gmail.com

WOODMAN Michael
刘政
刘政
WOODMAN Michael
On 6 May 2021, at 07:07, 刘政 <lz02...@gmail.com> wrote:
the approach of BVEP may be the Bayesian state-space model
刘政
meysam....@gmail.com
meysam....@gmail.com
WOODMAN Michael
--
You received this message because you are subscribed to the Google Groups "TVB Users" group.
To unsubscribe from this group and stop receiving emails from it, send an email to tvb-users+...@googlegroups.com.
To view this discussion on the web visit https://groups.google.com/d/msgid/tvb-users/6b859bf6-745f-4099-a2c3-2987c53212b9n%40googlegroups.com.
刘政
Thank you
meysam....@gmail.com

Viktor Sip
Forgot to reply to list previously:
What you describe is the terminology used commonly with neural
networks. In the probabilistic modeling, however, hyperparameters
typically refer to top-level parameters in hierarchical models,
that is, parameters of the distributions of other parameters.
These are part of the model and are inferred too.
Hi
So it means like if we have a Gaussian distribution, The mean of it follows a N(a, b) and the a and b are hyperparameters.
Thank you
Barry
Exactly. If you want more, search Stan documentation for hierarchical models, or I like to recommend Richard McElreath's book Statistical Rethinking which also goes into this topic.
Viktor
To view this discussion on the web visit https://groups.google.com/d/msgid/tvb-users/365bb66a-282a-4acc-b3a8-1ceddf8dc4ccn%40googlegroups.com.
--
Viktor SIP
INS - Institut de Neurosciences des Systèmes
UMR INSERM 1106, Aix-Marseille Université
vikto...@univ-amu.fr
http://ins.univ-amu.fr/
刘政
刘政
WOODMAN Michael
On 7 May 2021, at 12:26, 刘政 <lz02...@gmail.com> wrote:
5. If P_1 is bigger than P_0, then we accept θ_1, then move on; otherwise, we reject it, and set the second element of the Markov chain still θ_0. Until the next posterior is bigger than the former one.
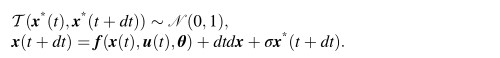
the parameter space exploration of the centered parameterization model often not efficient for it spend too much time exploring the parameters highly correlated which means the waste of time.
刘政
刘政
刘政

WOODMAN Michael
WOODMAN Michael
meysam....@gmail.com
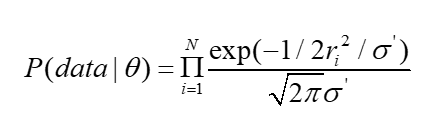
The posterior z-score quantifies how much the posterior distribution encompasses the ground-truth, while the posterior shrinkage quantifies how much the posterior distribution contracts from the initial prior distribution (see https://arxiv.org/pdf/1803.08393.pdf, page 18).
The concentration of estimation towards large shrinkages indicates that all the posteriors in the inversion are well-identified, while the concentration towards small z-scores indicates that the true values are accurately encompassed in the posteriors. Therefore, by plotting the posterior z-scores (vertical axis) against the posterior shrinkage (horizontal axis), the distribution on the bottom right of the plot implies an ideal Bayesian inversion. In this plot, bottom left indeicates poorly Identifed posterior, top left indicates a poorly-chosen prior and top left indicates overfitting.
Using minus one in shrinkage is just rescaling to get ideal fit for getting ideal Bayesian version at z-score close to zero and shrinkage close to 1.
刘政
刘政

WOODMAN Michael
I think I need to restate my question. I was reading some tutorials about centered and non-centered models.
here is the centered models ' form:u ~ N(0, 1)σ ~ N(0, 1)y ~ N(u, σ)
The non-centered form becomes:u ~ N(0, 1)σ ~ N(0, 1)y_unit ~ N(0, 1)y = u + σ * y_unit
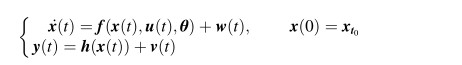
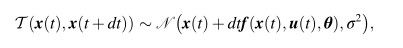
So here in BVEP, the Equ(5) is this:
<equ5.jpg>Equ(6) is like this:
--
You received this message because you are subscribed to the Google Groups "TVB Users" group.
To unsubscribe from this group and stop receiving emails from it, send an email to tvb-users+...@googlegroups.com.
To view this discussion on the web visit https://groups.google.com/d/msgid/tvb-users/4210b9aa-6516-4856-ac4a-94510832880fn%40googlegroups.com.
<Equ6.jpg><equ5.jpg>