question about Stefanescu Jirsa 3D model
41 views
Skip to first unread message

Wayne Wong
Oct 3, 2021, 5:34:58 PM10/3/21
to TVB Users
Hey everyone!


When I am reading the paper "A Low Dimensional Description of Globally Coupled Heterogeneous Neural Networks of Excitatory and Inhibitory Neurons" by Dr. Stefanescu and Dr. Jirsa in 2008, I have some difficulties understanding the contour map of the mean-field amplitude. What's the meaning of the '0.2, 0.4, 0.6, 1.2 ...' numbers in the graph? Is it the I (current)? Also, in this graph, it looks like n=0.3 (n=k12/k11) is a fixed ratio, so how to understand the double y-axis on the left (K12 and K11)? Could we say, with the increase of the mu (dispersion, the x-axis), the K11 and K12 are increasing simultaneously? Or, is the K12 should be the third dimension in this graph?
Besides, in practical TVB simulation, when we used the SJ3D model as the local model to simulate raw recording, there is an option to see if I want to choose mode 0 1 2... I am thinking if the mode is corresponding to a different n (ration of k12/k11) here. About the state variables, I understand the xi, eta, tau and alpha, beta, gamma as the dynamics of subpopulations (first three for excitatory and last three for inhibitory). And the xi and alpha are to calculate the neuron potentials and eta, tau, beta, and gamma are to calculate the transport of the ion. Am I right on this point?
I attached the paper link here: https://journals.plos.org/ploscompbiol/article?id=10.1371/journal.pcbi.1000219#pcbi-1000219-g002
Thank you so much! Please bear with me if I asked really dumb questions...

Julie Courtiol
Oct 4, 2021, 8:03:12 AM10/4/21
to tvb-...@googlegroups.com
Hi,
Please see below my reply.
---
Best regards,
Julie Courtiol

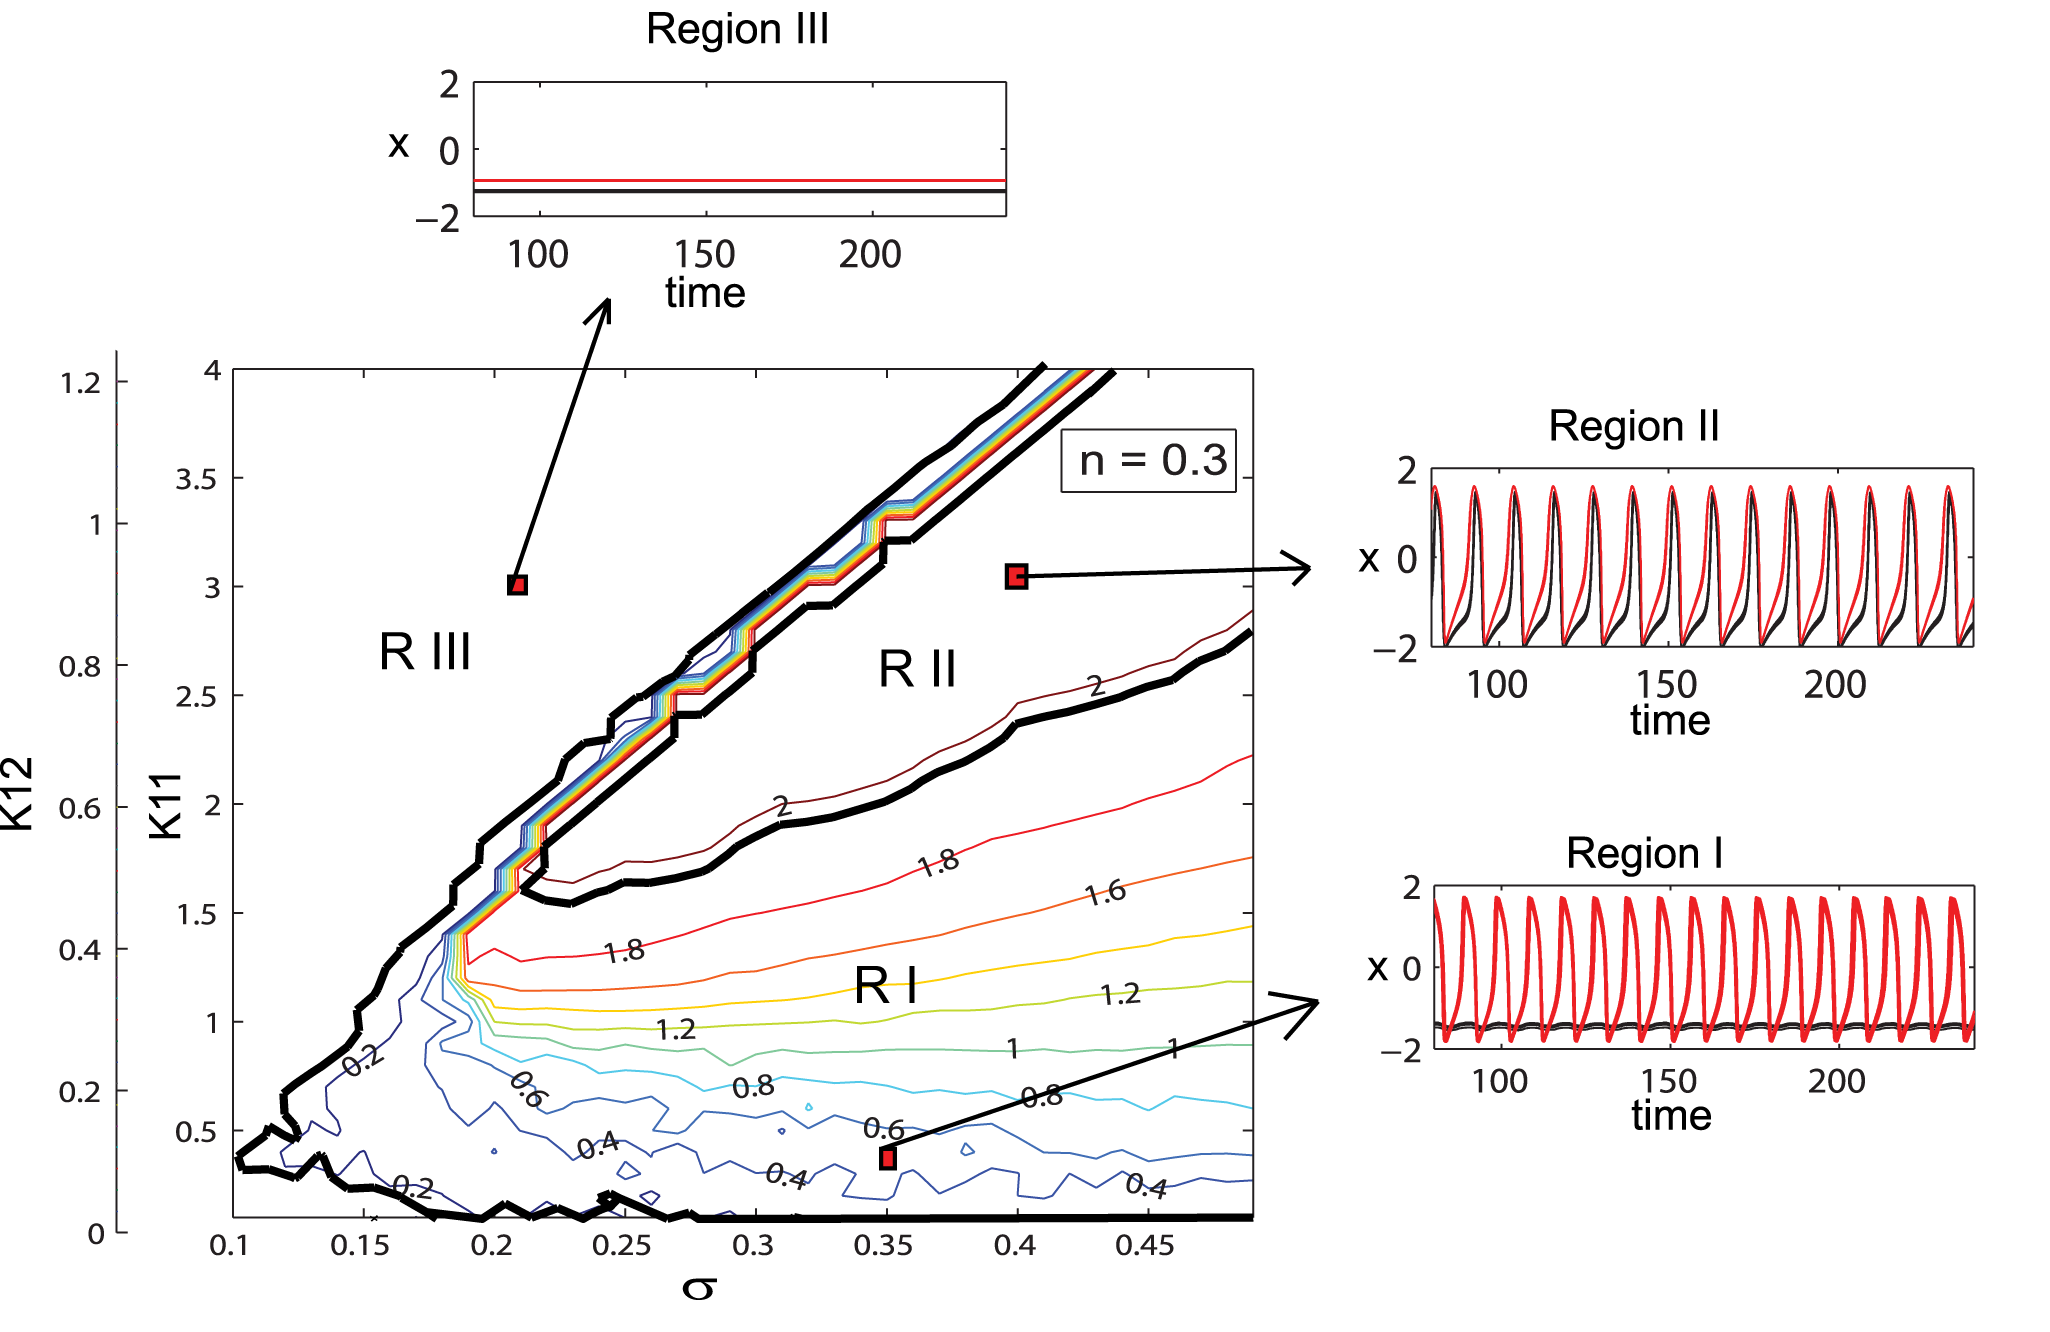
When I am reading the paper "A Low Dimensional Description of Globally Coupled Heterogeneous Neural Networks of Excitatory and Inhibitory Neurons" by Dr. Stefanescu and Dr. Jirsa in 2008, I have some difficulties understanding the contour map of the mean-field amplitude. What's the meaning of the '0.2, 0.4, 0.6, 1.2 ...' numbers in the graph? Is it the I (current)?
The membrane excitability I is fixed in this figure: ''Examples of ... the I parameter are given" (see caption).
The numbers in the graph correspond to the (minimum) mean field amplitude.
Also, in this graph, it looks like n=0.3 (n=k12/k11) is a fixed ratio, so how to understand the double y-axis on the left (K12 and K11)? Could we say, with the increase of the mu (dispersion, the x-axis), the K11 and K12 are increasing simultaneously? Or, is the K12 should be the third dimension in this graph?
This Contour map is function of connectivity strengths K11, K12 and strength of dispersion σ, so a 3D figure.
In the first paragraph of the results section, the authors explain how they are dealing with this multidimensional parametric space: "we pick a reference value K12 and manipulate the ratio n".
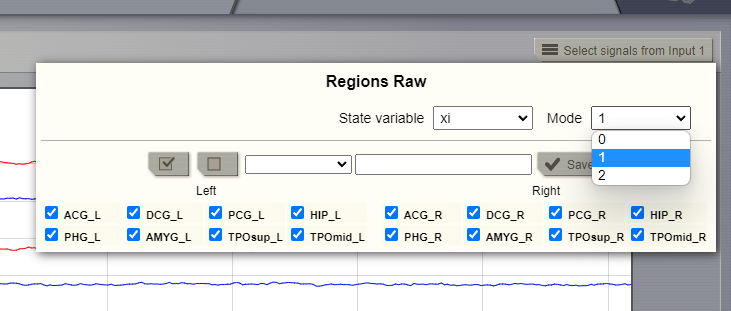
Besides, in practical TVB simulation, when we used the SJ3D model as the local model to simulate raw recording, there is an option to see if I want to choose mode 0 1 2... I am thinking if the mode is corresponding to a different n (ration of k12/k11) here.
No, the model's mode doesn't correspond to a different ration n. The mode decomposition technique is explained in detail in the paragraph MMs - The reduced system of the neural population:
"This reformulation of the network state vector in a continuous parametric space allows as to use mode decomposition techniques to find the dominant patterns of the behavior of the entire population."
"three modes per population type, in which we distinguish regimes of parameter I corresponding to small, medium and high I-values."
About the state variables, I understand the xi, eta, tau and alpha, beta, gamma as the dynamics of subpopulations (first three for excitatory and last three for inhibitory). And the xi and alpha are to calculate the neuron potentials and eta, tau, beta, and gamma are to calculate the transport of the ion. Am I right on this point?
The SJ3D is a phenomenological model. However, the first state-var of each subsystem can be used as a surrogate of membrane potential for the excitatory/inhibitory population, the second state-var is a recovery variable; while the third is an adaptation current.
Wayne Wong
Oct 5, 2021, 2:29:05 PM10/5/21
to TVB Users
Dear Julie,
Thank you for the reply! Much better now!
Best Regards,
Yile Wang
Reply all
Reply to author
Forward
0 new messages