RWWExcInh Simulations

Pedro Costa Klein
I am using the ReducedWongWangExcInh module, and in my work, we are fitting the model parameters individually to the empirical FCs by trying out several combinations of the model parameters (G, J_N, J_I, w_p, W_e and W_I) and selecting as "best-fitting parameters" the combination that yielded the simulated FC that correlates the most with the empirical FC (using Pearson's correlation). This "pipeline" is being performed in a dataset containing two distinct groups and the simulations are performed for individually generated SCs and FCs.
When analysing the distributions of the best-fitting simulated FCs vs. the distribution of the empirical FCs, we noticed that the distributions on the simulated FC distributions are always "bell-shaped and zero-centred like", and this is not true for the empirical FC distributions.

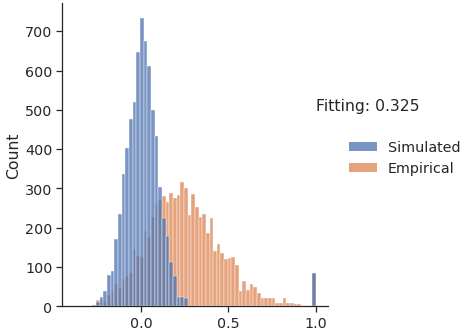

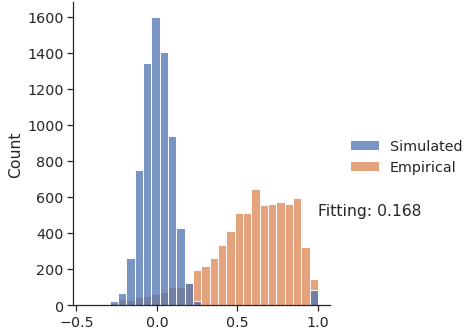
This happens no matter what is the "target FC" shaped like, so in the end, it looks like the model is only able to generate simulations that are shaped like this.
Is this behaviour somehow expected? If so, would it make sense to apply some sort of transformation on the empirical FCs before tuning the models, so that the empirical FCs would also be "bell-shaped and zero-centred like"? Should we then apply the same transformation to the resulting simulated FCs before comparing both?
Thank you very much for your help!
Kind regards,
Pedro

WOODMAN Michael
Hi Pedro,
From the plots, the simulations look primarily noise driven. I would try fewer parameters but including connectivity scaling (e.g. `coupling.Linear(a=0.1)`) as something you vary since it has a significant impact on the FC. Simply plotting mean & variance of simFC as a function of coupling should help highlight its effect.
Also just a few sanity checks: ensure you’re computing FC on the same monitors, drop the first 30s of a BOLD simulation, and so on.
Cheers,
Marmaduke
From: <tvb-...@googlegroups.com> on behalf of Pedro Costa Klein <pedro...@gmail.com>
Reply to: "tvb-...@googlegroups.com" <tvb-...@googlegroups.com>
Date: Wednesday 27 October 2021 at 13:39
To: "tvb-...@googlegroups.com" <tvb-...@googlegroups.com>
Subject: [TVB] RWWExcInh Simulations
Dear TVB Group members,
I am using the ReducedWongWangExcInh module, and in my work, we are fitting the model parameters individually to the empirical FCs by trying out several combinations of the model parameters (G, J_N, J_I, w_p, W_e and W_I) and selecting as "best-fitting parameters"
the combination that yielded the simulated FC that correlates the most with the empirical FC (using Pearson's correlation). This "pipeline" is being performed in a dataset containing two distinct groups and the simulations are performed for individually generated
SCs and FCs.
When analysing the distributions of the best-fitting simulated FCs vs. the distribution of the empirical FCs, we noticed that the distributions on the simulated FC distributions are always "bell-shaped and zero-centred like", and this is not true for the empirical
FC distributions.
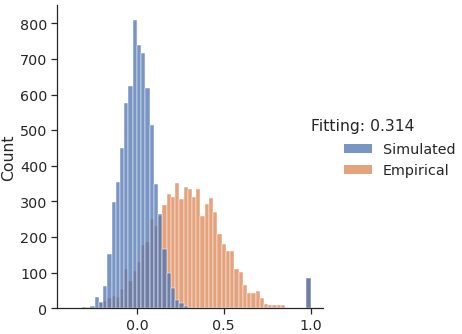

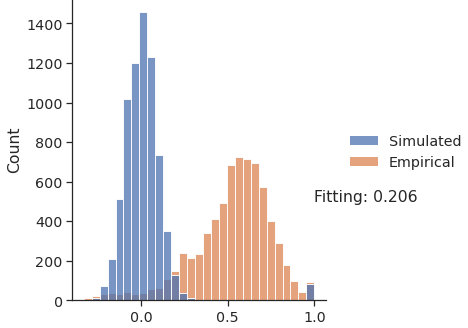

This happens no matter what is the "target FC" shaped like, so in the end, it looks like the model is only able to generate simulations that are shaped like this.
Is this behaviour somehow expected? If so, would it make sense to apply some sort of transformation on the empirical FCs before tuning the models, so that the empirical FCs would also be "bell-shaped and zero-centred like"? Should we then apply the same transformation
to the resulting simulated FCs before comparing both?
Thank you very much for your help!
Kind regards,
Pedro
--
You received this message because you are subscribed to the Google Groups "TVB Users" group.
To unsubscribe from this group and stop receiving emails from it, send an email to
tvb-users+...@googlegroups.com.
To view this discussion on the web visit
https://groups.google.com/d/msgid/tvb-users/CA%2B9XAX%3Ds0swStFwifNAMz8qDR2MAOOZwdviGjE%3D1si4ipb%2B0%2BQ%40mail.gmail.com.

Michael Schirner
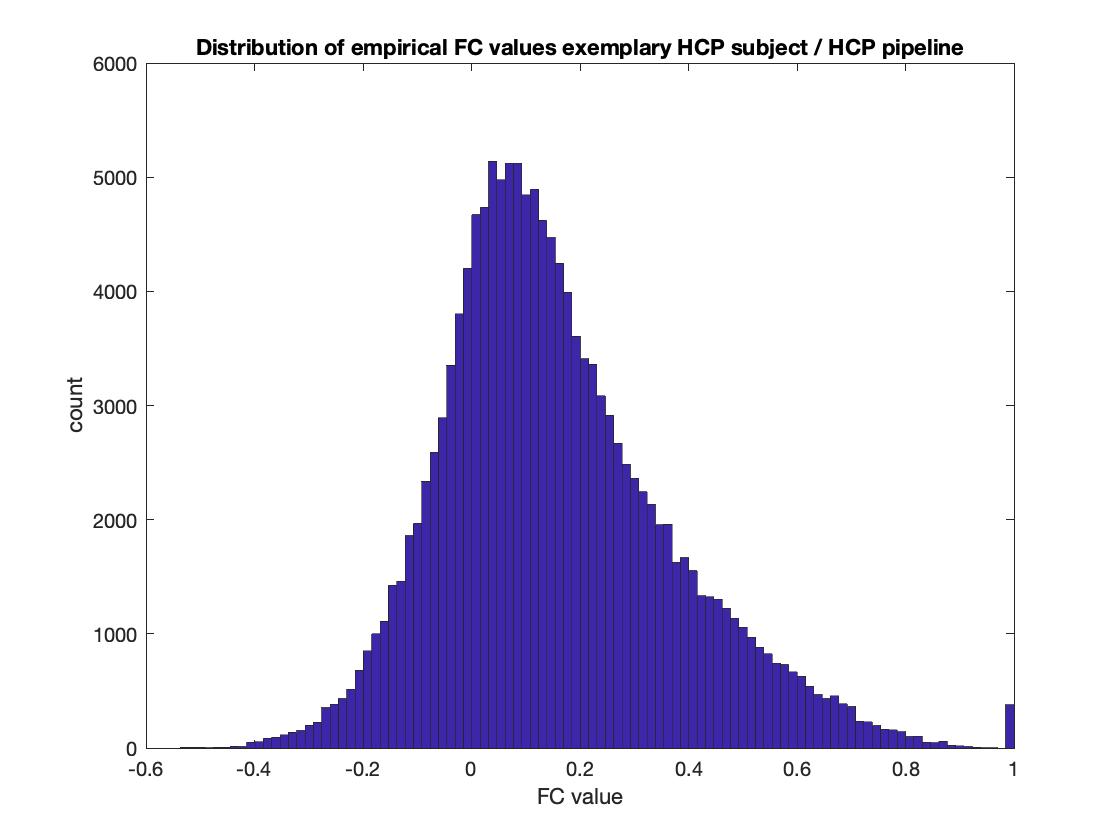
the distribution of FC values strongly depends on the preprocessing. For
example, attached is the distribution of FC values of an empirical FC from
an exemplary HCP subject that was preprocessed with the HCP pipeline. When
we looked at the HCP FCs for the first time we noticed that, in general,
the HCP FCs are more zero-centered and bell-shaped compared to the outputs
of other preprocessing pipelines. I assume this is related to the
Glasser/multimodal HCP parcellation, especially the way that the Glasser
parcellation accounts for the functional heterogeneity of brain regions,
as well as other preprocessing choices.
The high correlations in your empirical FCs indicate that there is a
strong 'global' signal present in the underlying fMRI time series. This
can result from multiple reasons. For example, related to the used
parcellation, or if additional smoothing was performed; it can also be
related to the presence of motion artifacts or the way motion correction
was performed; or, censoring.
For example, if a parcellation doesn't account for "function" (meaning:
similarity of fMRI time series) but just mixes voxels with all kinds of
activities together there is a good chance that localized heterogeneous
activity is just averaging out and we are just left with signals that are
globally present over widespread areas.
Zero-centeredness of FC makes a lot of sense when we take our
interpretation of what is a functional brain network into account:
especially if we understand functional brain networks as that what comes
out if we perform an ICA on fMRI data. Let's suppose we perform ICA on a
(group of) subject(s) in order to clean the data and really only select
the ICs that contain well-known RSNs or FNs patterns for backprojection
while discarding all other ICs. If we now compute FC matrices with a
functional network-based parcellation like the Yeo parcellation we get
zero-centered distributions, because the ICA has already--per
definition--made the individual components maximally independent (i.e.:
uncorrelated). By design, similar to the Yeo parcellation, the Glasser
parcellation already accounts for functional heterogeneity, in contrast to
other parcellation mapping algorithms that, e.g., only look for anatomical
markers.
Why am I explaining this in a long-winded manner? Doing a (group) ICA on
your data and looking at the contributions of individual components at
different brain locations, and how they will be then averaged by your
chosen parcellation, may help to understand where this strong global
signal comes from in your empirical fMRI.
Best,
Micha
> *PhD Student*
> *Universität zu Köln*
WOODMAN Michael
Hi
Since this question has come up a few times, here’s a quick demo notebook which looks at this skew/shift of FC distribution, feel free to have a look and comment
https://github.com/the-virtual-brain/tvb-root/pull/502
(full notebook at https://github.com/the-virtual-brain/tvb-root/blob/ffeba83afb775d4eeacc395767fe75b28bd69ce7/tvb_documentation/demos/skewed_fc.ipynb)
In that demo, a shifted distribution results from a simple oscillator model. A similar effect can be achieved with the ReducedWongWangExcInh since the pair of populations can generate oscillations.
As Michael mentioned, those distributions are influenced by preprocessing, and we could expect that those preprocessing techniques which center empirical FC would also center the oscillator model FC, so it should be taken into account when do these comparisons.
Cheers,
Marmaduke
To view this discussion on the web visit
https://groups.google.com/d/msgid/tvb-users/DB761D93-D2D9-4F4D-AEB9-23E9B78FFEE6%40univ-amu.fr.
Michael Schirner
RWWExcInh brain network models don't need to be centered at zero, we can
also produce FC distributions that are centered at an arbitrary positive
(or negative) value. (preprint following)
The question is: do we want that?
Because it seems like empirical FCs that are centered at a high positive
value are more due to 'leakage of global signals/averaging-out of
heterogeneous signals' rather than due to a 'genuine' synchronization of
brain regions. This effect also becomes apparent when one compares FC on a
voxel-wise level (in my experience zero-centered) versus FC from
increasingly coarse parcellations: the coarser, the more global signal in
every region's time series, and the more we shift towards a higher mean in
the FC.
Best,
Micha
> [cid:image0...@01D7CBF8.D4618DD0][cid:image0...@01D7CBF8.D4618DD0]
> This happens no matter what is the "target FC" shaped like, so in the end,
> it looks like the model is only able to generate simulations that are
> shaped like this.
>
> Is this behaviour somehow expected? If so, would it make sense to apply
> some sort of transformation on the empirical FCs before tuning the models,
> so that the empirical FCs would also be "bell-shaped and zero-centred
> like"? Should we then apply the same transformation to the resulting
> simulated FCs before comparing both?
>
> Thank you very much for your help!
>
> Kind regards,
> Pedro
>
> --
> Pedro Costa Klein (https://pedrocklein.github.io/)
> PhD Student
> Universität zu Köln
> pcos...@smail.uni-koeln.de<mailto:pcos...@smail.uni-koeln.de>
> pedro.co...@uk-koeln.de<mailto:pedro.co...@uk-koeln.de>
>
>
>
>
> --
> You received this message because you are subscribed to the Google Groups
> "TVB Users" group.
> To unsubscribe from this group and stop receiving emails from it, send an
> email to
> You received this message because you are subscribed to the Google Groups
> "TVB Users" group.
> To unsubscribe from this group and stop receiving emails from it, send an
> email to
> --
> You received this message because you are subscribed to the Google Groups
> "TVB Users" group.
> To unsubscribe from this group and stop receiving emails from it, send an
> email to tvb-users+...@googlegroups.com.
> To view this discussion on the web visit
>
WOODMAN Michael
Thanks for the interesting points,
On 28/10/2021 13:25, "tvb-...@googlegroups.com on behalf of Michael Schirner" <tvb-...@googlegroups.com on behalf of m.sch...@fu-berlin.de> wrote:
> RWWExcInh brain network models don't need to be centered at zero, we can
> also produce FC distributions that are centered at an arbitrary positive
> (or negative) value. (preprint following)
> Because it seems like empirical FCs that are centered at a high positive
> heterogeneous signals' rather than due to a 'genuine' synchronization of
Cheers,
Marmaduke
Michael Schirner
hopefully soon about that.
Regarding interpretation: it's probably not automatically a problem if a
brain network model produces mainly high correlations in simulated fMRI.
If the global signal that produced the high correlation in the *empirical*
fMRI FC
- is a genuine global neuronal activity pattern shared by widespread brain
populations
- and is not originating from an artifact (like motion) or preprocessing
problems (like problems with frame-wise registration of the fMRI volumes,
etc.)
- and is of interest for the scientific problem at hand
then it may be interesting to study a model that produces these high
correlations.
On the other hand, if we are having high FC only due to a global signal
that only appeared due to the way we averaged the fMRI time series due to
a particular parcellation (that doesn't account for functional borders),
then it stands to question whether it was really the
interesting/prominent/functionally-relevant aspect of the signal that was
modelled.
In this case regressing-out a global signal in the BOLD monitor would not
help, as it wouldn't let us undo the loss of information that happened due
to averaging over functionally-unrelated voxels in empirical data.
The logic would be reversed. In real data the global signals are subtle
and only appear if we average over functionally-unrelated voxels. On the
other hand, if we average over functionally-related voxels -- like Glasser
-- then the signal of that "function" (or functional brain area) gets
strengthened to the disadvantage of global signals and noise. In a high-FC
model these roles would now be reversed: the global signal would be the
strongest part of the simulated time series while localized functional
activity would only be modulated on top of that.
Probably we would like it better if each node in our BNM focusses on the
functional aspect of the underlying local region, rather than on global
aspects. As an extreme example, we could just parcellate the brain into
two regions -- left and right hemisphere -- and we would get a very high
correlation between the resulting empirical fMRI time series. This can
then be nicely modelled with a such a high-FC BNM: we just increase the
coupling strength between the two nodes until we arrive at the desired
level of synchrony / correlation. But how informative is this two-region
model then? We would now miss localized functional activity that may be
relevant for our scientific problem.
Best,
Micha
> You received this message because you are subscribed to the Google Groups
> "TVB Users" group.
> To unsubscribe from this group and stop receiving emails from it, send an
> email to tvb-users+...@googlegroups.com.
> To view this discussion on the web visit
>
Pedro Costa Klein
To view this discussion on the web visit https://groups.google.com/d/msgid/tvb-users/4236.82.207.239.134.1635433858.webmail%40webmail.zedat.fu-berlin.de.
Pedro Costa Klein
 ^
^


WOODMAN Michael
Hi
No, you’re not missing anything. For the single population RWW (not the two population RWWExcInh), the vast majority of parameter space is a fixed point, driven by noise, which will get you a zero centered FC histogram (the corrcoef between centered simulated FC and non-centered empirical FC can still be positive and significant). This motivated the switch to an oscillator, which exhibits sustained fluctuations, enabling the positive shift in FC. As a modeling tool, TVB allows you to explore those possiblities. However, as Michael warns, this shift may not have meaningful interpretation, and it’s the correlation between simulated and empirical FC, not their means, which is considered meaningful in the brain network modeling literature.
Cheers,
Marmaduke
From: <tvb-...@googlegroups.com> on behalf of Pedro Costa Klein <pedro...@gmail.com>
Reply to: "tvb-...@googlegroups.com" <tvb-...@googlegroups.com>
Date: Friday 29 October 2021 at 10:22
To: "tvb-...@googlegroups.com" <tvb-...@googlegroups.com>
Subject: Re: [TVB] RWWExcInh Simulations
Hi Marmaduke,
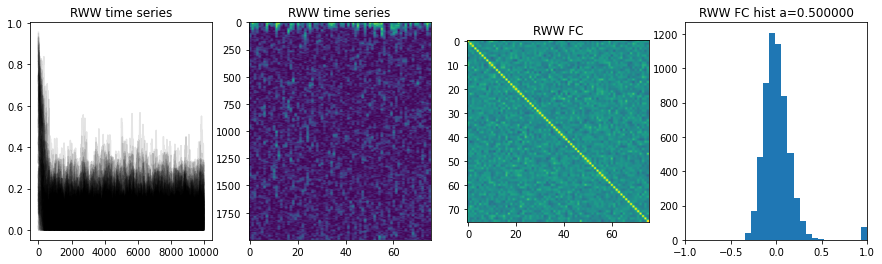
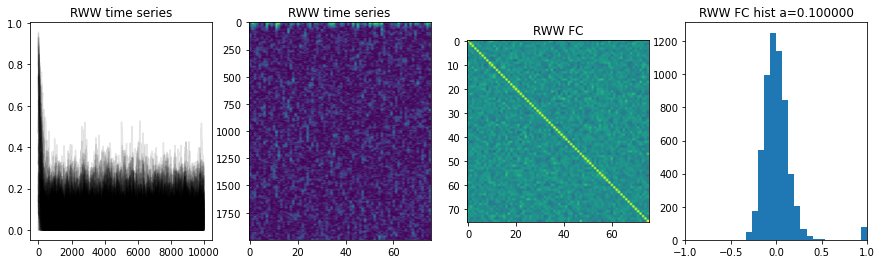
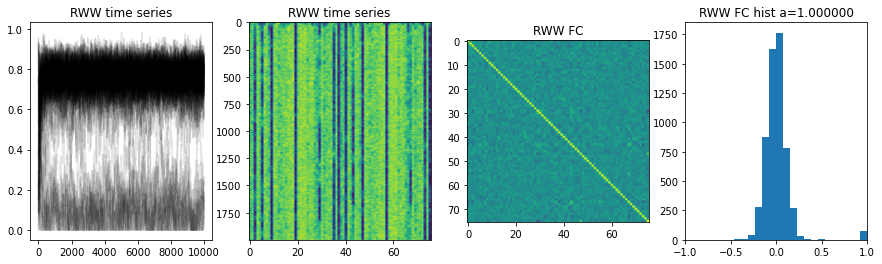
I have a follow-up question on the connectivity scaling tuning: I have downloaded the demo script that you kindly provided, but I am unable to change the shape of the RWW distribution just by altering "a" in the script (as in "t, y = run3(a = a_i, sig=0.0001, I=0.28, T=10e3)", where a_i would be a parameter that I iteratively increase in steps of 0.1, and a within a range of 0.1:3.0). Am I missing something? I am attaching some figures to illustrate.
 ^
^


To view this discussion on the web visit
https://groups.google.com/d/msgid/tvb-users/CA%2B9XAX%3DEjetwd1yn5R%3DYWRsGcDBAPh9Zc51G1eyQK6vOuTTkeQ%40mail.gmail.com.