multimodelTP - what's missing?

Isa Wallin Kihlberg
Dear Dr. Quezada-Romegialli,
I am currently trying to establish the trophic position of an invasive fish species, using your package tRophicPosition. The data is from two different areas, and for each area I have two years of data. There are two different baseline species, one suspension-filter feeder and one suspension-deposit feeder. I use your vignette and an online tutorial and everything works fine until I’m running the actual model – then nothing happens. I understand that I’m probably missing something in a previous step, but I can’t identify what’s missing.
rg_tp_list <- extractIsotopeData(rg_tp_data,
consumersColumn = "class",
b1 = "Macoma",
b2 = "Mytilus",
baselineColumn = "species",
groupsColumn = "site",
deltaC = TDF_values$deltaC,
deltaN = TDF_values$deltaN)
for (site in rg_tp_list){
plot(site)
print(summary(site))
} #everything works fine until here (as far as I can tell)
# but here nothing really happens
cluster <- parallel::makePSOCKcluster(parallel::detectCores())
system.time(rg_TPmodels <- parallel::parLapply(cluster,
rg_tp_list,
multiModelTP,
lambda = 2, #Trophic position of source
adapt = 20000,
n.iter = 20000,
burnin = 2000,
n.chains = 5,
model = "twoBaselinesFull"))
#parallel::stopCluster(cluster)
The only output I get is
user system elapsed
0.02 0.00 87.29
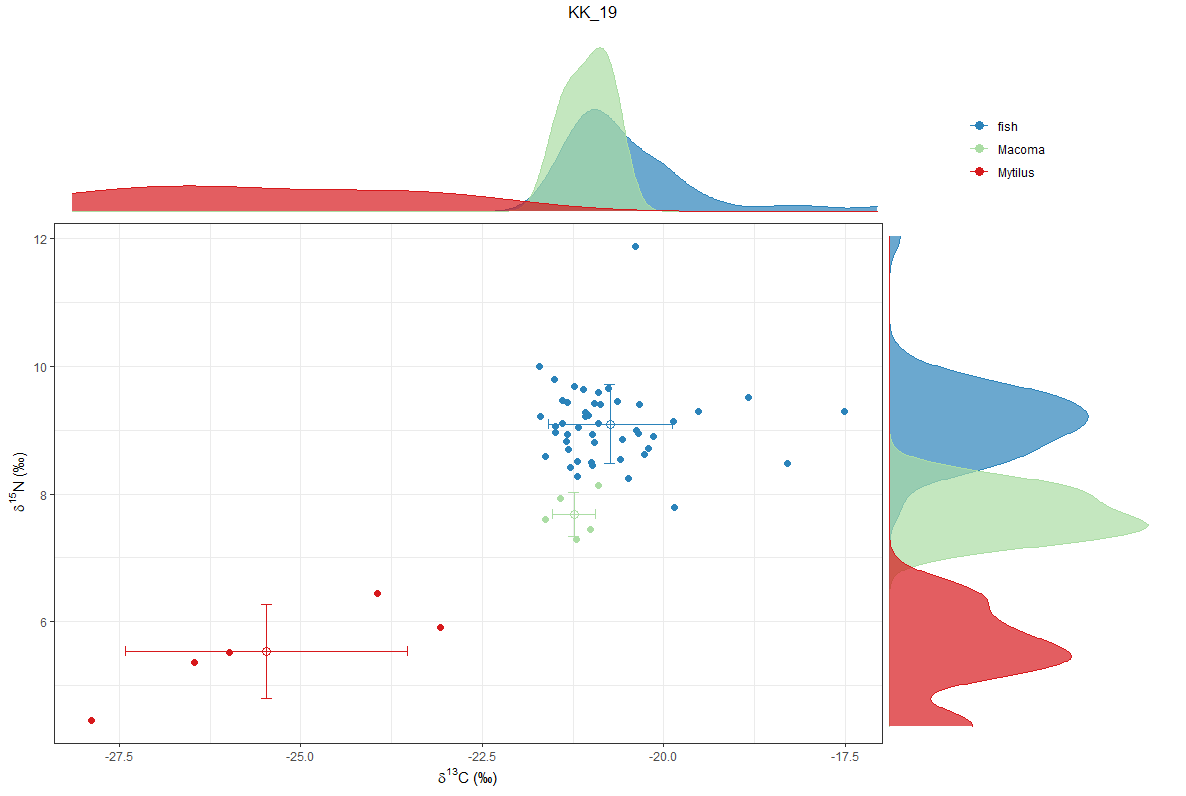
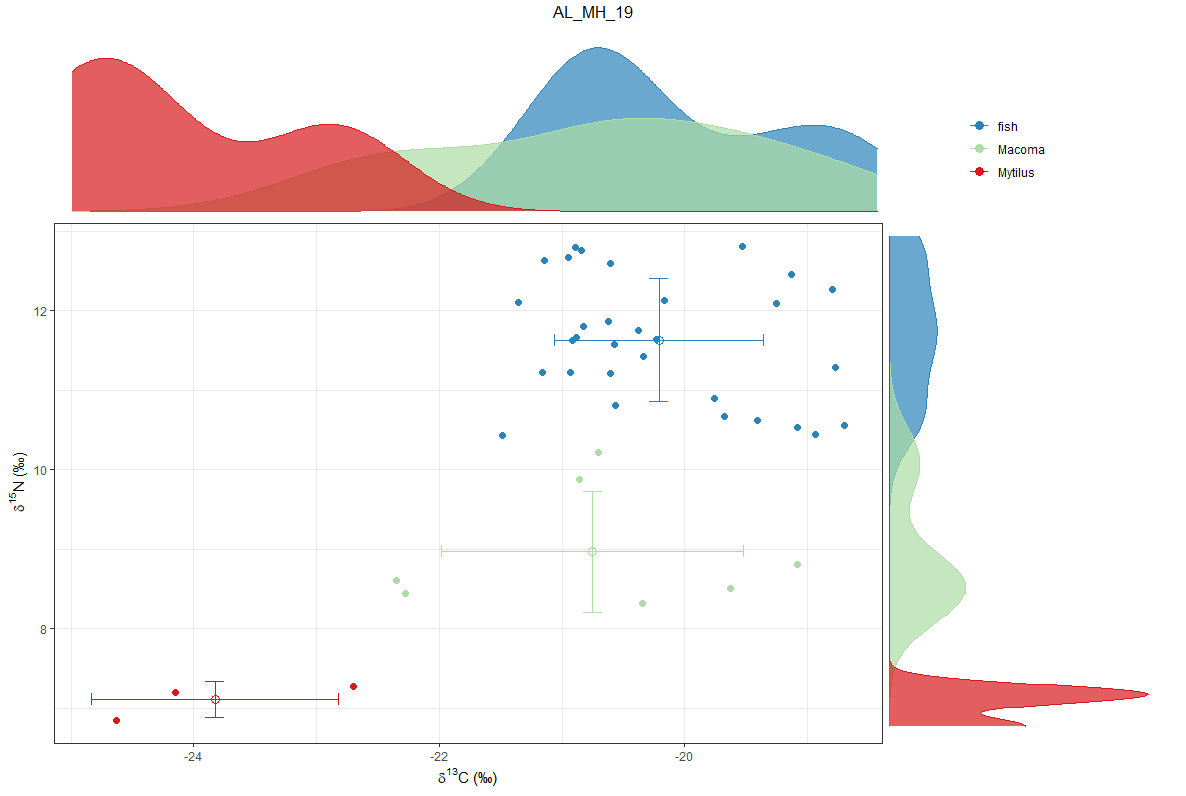
I attach two of the density plots and a few rows of my data.
Any help or guidance would be highly appreciated!
Best wishes,
Isa
Isa Wallin Kihlberg
PhD Student
Sveriges lantbruksuniversitet
Swedish University of Agricultural Sciences
Department of Aquatic Resources (SLU Aqua)
Institute of Coastal Research
Skolgatan 6, 742 42 Öregrund, Sweden
Phone: +46 (0)10 478 4162
isa.w...@slu.se,
www.slu.se/akvatiskaresurser
Our vision:
Viable fish stocks in healthy waters

Please consider the environment before printing this e-mail
---
När du skickar e-post till SLU så innebär detta att SLU behandlar dina personuppgifter. För att läsa mer om hur detta går till, klicka
här
E-mailing SLU will result in SLU processing your personal data. For more information on how this is done, click
here