Inquiry on the use of credibilityIntervals and parallel for multispeciesTP
71 views
Skip to first unread message

jason...@gmail.com
Apr 10, 2018, 1:21:37 AM4/10/18
to tRophicPosition
I use the data "Bilagay' and follow all the steps from the vignettes "tRophicPosition: calculating trophic position for multiple species".
However, when I run the following script, it returns me an error.
credibilityIntervals(Bilagay_models$df, x = "community", xlab ="Community")
credibilityIntervals(Bilagay_models$df, x = "community", xlab ="Community")
Don't know how to automatically pick scale for object of type isotopeData. Defaulting to continuous.
Error: Aesthetics must be either length 1 or the same as the data (10): ymin, ymax, x, y
Also when I try to use multiSpeciesTP in parallel for my both my own dataset and the Bilagay dataset, it comes out with another error.
Error in checkForRemoteErrors(val) :
4 nodes produced errors; first error: argument is of length zero
Timing stopped at: 0.005 0.001 0.134
It would be great if any help on the above issues is provided. Thank you.
Message has been deleted
jason...@gmail.com
Apr 10, 2018, 2:44:24 AM4/10/18
to tRophicPosition
Sorry, just encounter another difficulties when running my data.
The below error pop out when I run the function "multiSpeciesTP" for around 10min. Eventually, no model object is created.
The below error pop out when I run the function "multiSpeciesTP" for around 10min. Eventually, no model object is created.
Error in rjags::jags.model(textConnection(model.string), data = data, :
RUNTIME ERROR:
Compilation error on line 8.
Cannot evaluate range of counter j

Claudio Quezada R.
Apr 10, 2018, 3:07:31 AM4/10/18
to jason...@gmail.com, tRophicPosition
Hello
With the errors you sent, is difficult to know exactly what failed. Can you send me the exact script plus the data you used?
Are you able to plot the data? If not, then the data is not loaded correctly. In my experience, 80% of the errors are related to data entry at the very beginning of the procedure.
The dataset included into the package should work, as the vignettes were produced with those data.
Cheers,
Claudio
--
Dr. Claudio Quezada-Romegialli
Profesor Asociado
Departamento de Biología
Facultad de Ciencias Naturales y Exactas
Universidad de Playa Ancha
Móvil: +56 9 9038 0148
Teléfono: +56 32 250 0519
--
To download tRophicPosition package visit https://github.com/clquezada/tRophicPosition
---
You received this message because you are subscribed to the Google Groups "tRophicPosition" group.
To unsubscribe from this group and stop receiving emails from it, send an email to trophicposition-support+unsub...@googlegroups.com.
To post to this group, send email to trophicposition-support@googlegroups.com.
Visit this group at https://groups.google.com/group/trophicposition-support.
To view this discussion on the web, visit https://groups.google.com/d/msgid/trophicposition-support/df528926-8165-4364-9ace-ecfc215e18d3%40googlegroups.com.
For more options, visit https://groups.google.com/d/optout.
Claudio Quezada R.
Apr 10, 2018, 9:35:32 PM4/10/18
to tRophicPosition
Dear Jason
I found the plot problem: in the vignette there was an error. Thank you for pointing this out. You should use
credibilityIntervals(Bilagay_models$df, x = "group", xlab ="Community")
credibilityIntervals(Bilagay_models$df, x = "group", xlab ="Community")
instead of using x = "community"
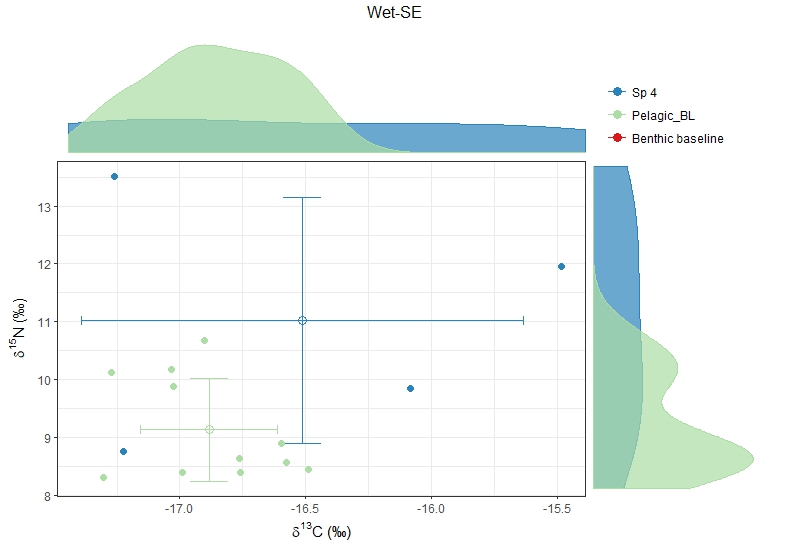
Regarding your data, I strongly suggest to check every species/consumer in every site/community/group, as you have some combinations of species/groups that don't have enough data, and the estimation of trophic position will be skewed and might not be reliable.
For example, Sp4 in Wet-SE has only 4 stable isotope values! And the baseline Pelagic_BL doesn't seem to be good too.
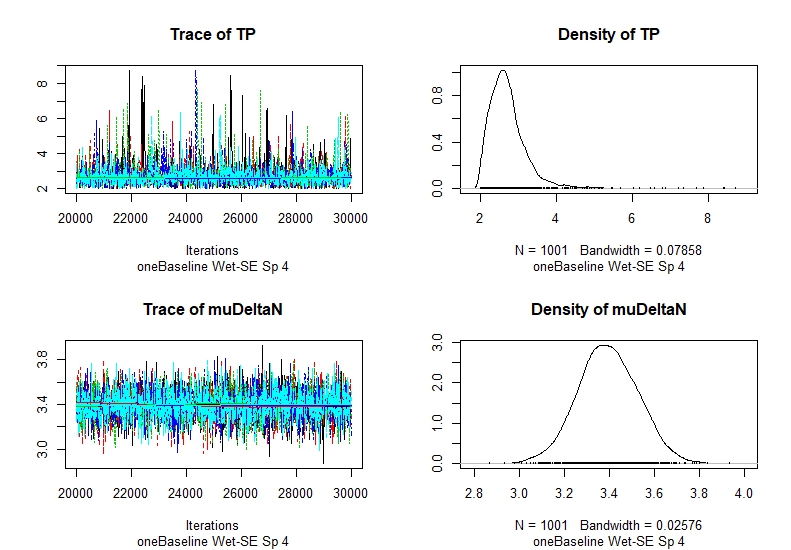
If you calculate TP, you will see that the trace of TP is clearly not smooth, which suggests that the data is poor and the model is not converging successfully. Still you will have results, but they might be skewed or probably wrong. Posterior distribution of trophic position range from 2 to 9? That is not a good sign.
Furthermore, when you perform the posterior predictive checking procedure on this data, you will see that nitrogen data is poorly predicted by the model, and this is because you don't have much data. Please check the code attached.
Still, if you want to calculate the parallel version, use this code:
#Parallel TP
cl <- parallel::makePSOCKcluster(parallel::detectCores())
#Remove [1:8] if you want to calculate all species
fishes <- parallel::parLapply(cl,
BilagayList[1:8],
multiModelTP,
adapt = 20000,
n.iter = 20000,
burnin = 20000,
n.chains = 5,
model = "oneBaseline")
parallel::stopCluster(cluster)
ggplot_df <- fromParallelTP(fishes, get = "summary")
credibilityIntervals(ggplot_df, plotAlpha = FALSE, xlab = "Species")
But I strongly suggest to check every species per separate, otherwise your results won't be reliable.
Cheers!
Claudio
--
Dr. Claudio Quezada-Romegialli
Profesor Asociado
Departamento de Biología
Facultad de Ciencias Naturales y Exactas
Universidad de Playa Ancha
Móvil: +56 9 9038 0148
Teléfono: +56 32 250 0519
2018-04-10 12:45 GMT-03:00 Jason Yau <jason...@gmail.com>:
Dear Claudio,Thank you for your prompt reply and your work on this great package.I could plot the data using the package plot function for both my dataset and the package dataset.For the test_data1, the multiSpeciesTP function had run for 30 min then an error come out.Attached with the data and the scripts I used for my data and the package data.As my real data actually contains far more species, it would be great if I can run the multi species in parallel. Thank you for your help in advance.Best Regards,Jason
To unsubscribe from this group and stop receiving emails from it, send an email to trophicposition-support+unsubscr...@googlegroups.com.
Claudio Quezada R.
May 2, 2018, 4:29:33 PM5/2/18
to Jason Yau, tRophicPosition
Dear Jason
Apologies for the delay in replying, I was out of the office. I will reply in-between lines below:
2018-04-12 5:46 GMT-03:00 Jason Yau <jason...@gmail.com>:
Dear Claudio,All the things work well with your script provided. Thanks a lot.#About minmum sample sizeMay I know the minimum sample size that you recommended for calculating TP using the package? Or does it actually depends on the variance of the isotopic signature? I asked because we have too many species to process and isotope analysis of each sample is quite expensive so we decide to have as few samples as possible to minimise the cost.
The minimum sample size recommended is 15. As usual, having less observations will raise the variance (as you may have sub-structure), so there is a trade-of between less samples per species or more sites. Sadly, stable isotope analysis is quite expensive.
#About baselineRegarding to the baseline, I actually group all the bivalvia species and the filter feeding gastropod as one baseline with the assumption that all of the bivalvia species are filter feeding species. I do this because I don’t actually have much information on the bivalve feeding ecology and also none of the bivalve species occurred in all site and season. Do you think this grouping is reasonable when using the package? Or is there any better way for setting the baseline?
That is a good a priori reasoning. But, looking at some plots, it might not be the best strategy, as some values are somewhat different (high variance), suggesting that actually they change over the season or because they are different species. Again, as SIA is expensive, having a few samples will increase your error but keeping the budget in a reasonable amount.
#About check the quality of the estimateLast question is about how to check the accuracy of the estimate. In your recently published paper, it mentioned to look at the plot generated from the CODA package. There are 4 panels from the plot, I assume the density plot is to check the normality of the TP and muDeltaN where trace plot is to check for convergence. If the trace plot didn’t look flat but contain multipeaks then it would be regarded as not converging [Attached Figure]? Besides increase the sample size, what else can we do to obtain a reliable estimate based on the data we have? For the muDeltaN, as long as I am using the TDF either from McCutchan or Post assumption, it will be okay?
The trace plot is for checking convergence. As the word suggest, once you run enough simulations, the a posteriori
distribution of the parameter you are modelling should converge to a value, having a variance. The variance will depend on the data of the consumer itself, plus the data of the baseline(s) and the TDF. The more accurate and the more samples you have, the less variance you will get. The right plot is the posterior distribution of the parameters inferred. It is basically the same information, showed in a different way. As we are modelling the parameter as having a mean and a variance with normal distribution as assumption, then the distribution should match that assumption.
The attached figure is one example of not getting convergence, but besides the quality checking using the plot, I suggest to use other diagnostics (see https://stats.stackexchange.com/questions/507/what-is-the-best-method-for-checking-convergence-in-mcmc?utm_medium=organic&utm_source=google_rich_qa&utm_campaign=google_rich_qa for example).
When you use the Post or McCutchan's TDF assumption, you are using a X number of actual observations that coincides with the distribution indicated by Post or McCutchan. So you will have 56 values for N and 56 values for C (in case of Post), an enough number of observation to get a reliable muDeltaN posterior distribution. In case of McCutchan, you will have less observations, so you will propagate the uncertainty through the modelling with those values.
I am sorry for asking so many questions as I am really new to bayesian statistics.Best Regards,Jason
No worries for asking many questins, but try to send it to the googlegroups as well.
Cheers
Cheers
Claudio
On 11 Apr 2018, at 9:34 AM, Claudio Quezada R. <clqu...@ug.uchile.cl> wrote:
Dear JasonI found the plot problem: in the vignette there was an error. Thank you for pointing this out. You should use
credibilityIntervals(Bilagay_models$df, x = "group", xlab ="Community")instead of using x = "community"Regarding your data, I strongly suggest to check every species/consumer in every site/community/group, as you have some combinations of species/groups that don't have enough data, and the estimation of trophic position will be skewed and might not be reliable.
For example, Sp4 in Wet-SE has only 4 stable isotope values! And the baseline Pelagic_BL doesn't seem to be good too.
<Sp4 Wet-SE.jpeg>
If you calculate TP, you will see that the trace of TP is clearly not smooth, which suggests that the data is poor and the model is not converging successfully. Still you will have results, but they might be skewed or probably wrong. Posterior distribution of trophic position range from 2 to 9? That is not a good sign.
<trace Sp4 Wet-SE.jpeg>
To unsubscribe from this group and stop receiving emails from it, send an email to trophicposition-support+unsub...@googlegroups.com.
To post to this group, send email to trophicposition-support@googlegroups.com.
Visit this group at https://groups.google.com/group/trophicposition-support.
To view this discussion on the web, visit https://groups.google.com/d/msgid/trophicposition-support/df528926-8165-4364-9ace-ecfc215e18d3%40googlegroups.com.
For more options, visit https://groups.google.com/d/optout.
You received this message because you are subscribed to a topic in the Google Groups "tRophicPosition" group.
To unsubscribe from this topic, visit https://groups.google.com/d/topic/trophicposition-support/6JSsGC_eCag/unsubscribe.
To unsubscribe from this group and all its topics, send an email to trophicposition-support+unsub...@googlegroups.com.
To post to this group, send email to trophicposition-support@googlegroups.com.
Visit this group at https://groups.google.com/group/trophicposition-support.
To view this discussion on the web, visit https://groups.google.com/d/msgid/trophicposition-support/CAOCuJnSyTPgT-TFA1XAiT3A0fTQ-aKo0XiMHGxxjKq%2BDuFgjFQ%40mail.gmail.com.
<test_script.R>
Reply all
Reply to author
Forward
0 new messages