How to read a liveness dot dump
89 views
Skip to first unread message

hwa...@gmail.com
Apr 26, 2022, 9:26:14 PM4/26/22
to tlaplus
When you run TLC from the command line with the flag option
-dump dot outfile and you check a temporal property, then TLC makes two files,
`outfile`
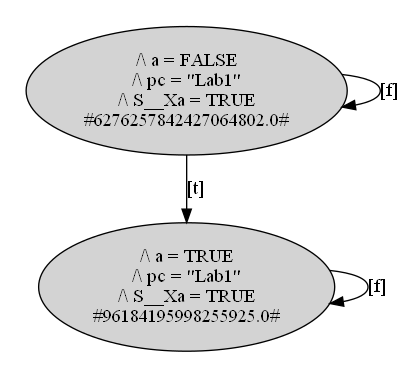
and `outfile_liveness`. The graphviz for `outfile` is self-descriptive, but I'm having a hard time understanding the `outfile_liveness` graph. First image is a regular state space, second is the liveness dotfile.
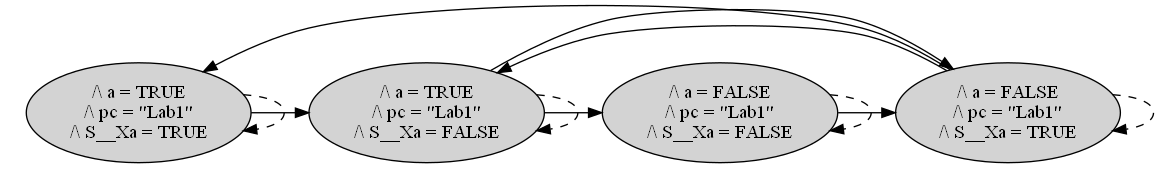
1. Why don't all four states appear in the liveness graph?
2. What do the [t] and [f] labels on the edges mean?
3. Does the #number.0# mean anything?
Thanks!
H

Markus Kuppe
Apr 27, 2022, 8:57:07 PM4/27/22
to tla...@googlegroups.com
Hi Hillel,
in a nutshell, you're seeing TLC's internal representation of what "Temporal Verification of Reactive Systems: Safety" [1] and “How to verify temporal formulas in TLA” [2] call the "behavior graph" (cross product of the state graph and the tableaux). Unless others have found this graph useful outside of debugging TLC, I suggest we change TLC not to dump `outfile_liveness` by default (with the Toolbox nobody ever noticed because the file is well hidden).
Markus
[1] https://link.springer.com/book/10.1007/978-1-4612-4222-2
[2] http://www.wischik.com/lu/research/verify-tla-report.html
> On Apr 26, 2022, at 6:26 PM, hwa...@gmail.com <hwa...@gmail.com> wrote:
>
> When you run TLC from the command line with the flag option -dump dot outfile and you check a temporal property, then TLC makes two files, `outfile` and `outfile_liveness`. The graphviz for `outfile` is self-descriptive, but I'm having a hard time understanding the `outfile_liveness` graph. First image is a regular state space, second is the liveness dotfile.
>
> <Xa_image-KYR.png>
in a nutshell, you're seeing TLC's internal representation of what "Temporal Verification of Reactive Systems: Safety" [1] and “How to verify temporal formulas in TLA” [2] call the "behavior graph" (cross product of the state graph and the tableaux). Unless others have found this graph useful outside of debugging TLC, I suggest we change TLC not to dump `outfile_liveness` by default (with the Toolbox nobody ever noticed because the file is well hidden).
Markus
[1] https://link.springer.com/book/10.1007/978-1-4612-4222-2
[2] http://www.wischik.com/lu/research/verify-tla-report.html
> On Apr 26, 2022, at 6:26 PM, hwa...@gmail.com <hwa...@gmail.com> wrote:
>
> When you run TLC from the command line with the flag option -dump dot outfile and you check a temporal property, then TLC makes two files, `outfile` and `outfile_liveness`. The graphviz for `outfile` is self-descriptive, but I'm having a hard time understanding the `outfile_liveness` graph. First image is a regular state space, second is the liveness dotfile.
>
Reply all
Reply to author
Forward
0 new messages