Python better colors and a color browser

John Hanna
Great IDEA from the TI genius bar:
I have this cool module called colortable, which is how I get colorful graphics.
Place colortable.tns in the PyLib folder. Directions in the file with a demo.
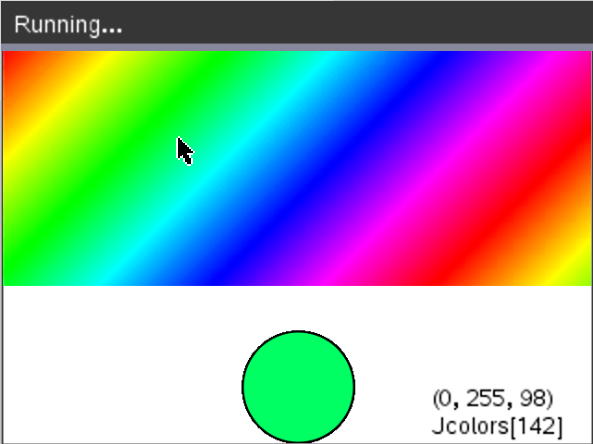
The file also includes a colorpicker( ) which gives you the three r, g, b values and the one red[], green[], blue[] and Jcolors[] index value just by hovering with the mouse. (You don’t actually ‘pick’ the color. Just note the values.)
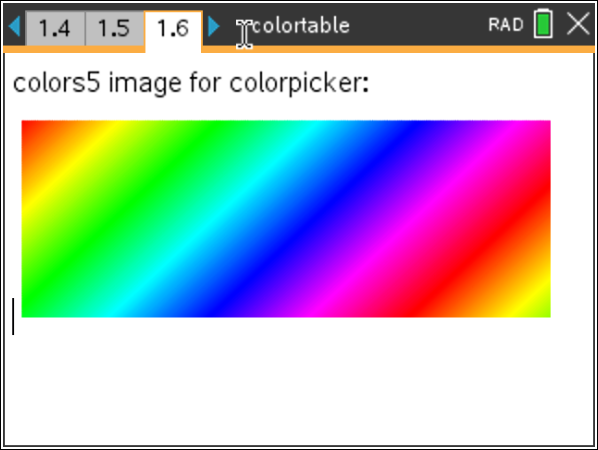
But… to get the colorpicker( ) to work it needs the image* (name: color5) so… (Here’s where the genius helped!)
Place the file color5.tns to your MyWidgets folder, then in a doc where you want to use the colorpicker…
Add the color5.tns widget (it’s just a Notes app with the image in it and it retains the image name color5):
In a blank Python program add from colorpicker import * and press ctrl-R to run:
Some ‘set color’ functions accept either a tuple, (r, g, b) in parens, or three int args r, g, b. Others only allow the just the three separate args, so you can use the index value either way: set_color(red[45], green[45], blue[45]) or set_color(Jcolors[45]) from ti_draw both work, but there are also color functions in PlotLib, Turtle, Hub, & Rover modules.
Way better palette than randint(0,255)… colors: Jcolors[randint(0, 359)]
* the ti_image module contains a get_color(x, y) function but it only works on an image, not on the entire screen… yet.
Be kind,
John