Ran a count(*) aggregate query on a 500 million rows table, it failed
225 views
Skip to first unread message

Wilfred Chau
May 29, 2018, 10:11:17 PM5/29/18
to TiDB user group
Hi
We used the docker compose file to setup our TiDB environment with approx 500GB of Ram and 36 CPU cores.
I ran a count(*) on a table which has 500 million rows in it. After 11 mins, it failed with Error code: 9003. TiKV server is busy. [try again later]
On a standalone, single instance MySQL server, the same query finished in 7 mins.
Are there any settings/configuration I need to tweak in order to make it work?
Thanks

tl
May 29, 2018, 10:57:40 PM5/29/18
to TiDB user group
Do you do any other operations like insert/update at the same time?
在 2018年5月30日星期三 UTC+8上午10:11:17,Wilfred Chau写道:
Can you show me the logs of TiDB/TiKV or the metrics of TiKV Error at that time?
在 2018年5月30日星期三 UTC+8上午10:11:17,Wilfred Chau写道:
Wilfred Chau
May 30, 2018, 9:38:53 PM5/30/18
to TiDB user group
No insert nor update while I ran the select statement, I was done importing via the loader application.
Attached please find the logs for TiDB/TiKV
I also have 11x MySQL instances running. Will that impact the performance of either the TiDB or TiKV servers?
Attached please find the logs for TiDB/TiKV
I ran 5 select in a session in sequence. 2 out of 5 ran successfully, the remaining 3 failed with a gc error
Error Code: 9006
GC life time is shorter than transaction duration

Execution Time : 0 sec
Transfer Time  : 0 sec
Total Time     : 16 min 33 sec
-----------------------------------------------------------
Now, with pd error
Error Code: 9001PD server timeout[try again later]
Execution Time : 0 secTransfer Time  : 0 secTotal Time     : 10.495 sec
Also notice, 1 of the TiKV services died.
CONTAINER ID IMAGE COMMAND CREATED STATUS PORTS NAMESc1ea30c50f41 pingcap/tidb:latest "/tidb-server --st..." 21 hours ago Up 21 hours 0.0.0.0:4000->4000/tcp, 0.0.0.0:10080->10080/tcp tidbdockercompose_tidb_123e5fc7144bb pingcap/tikv:latest "/tikv-server --ad..." 21 hours ago Restarting (1) 37 minutes ago tidbdockercompose_tikv7_19a0f69fb3272 pingcap/tikv:latest "/tikv-server --ad..." 21 hours ago Up 21 hours 20160/tcp tidbdockercompose_tikv1_1473cf7def7dc pingcap/tikv:latest "/tikv-server --ad..." 21 hours ago Up 21 hours 20160/tcp tidbdockercompose_tikv2_1eab641fe1e9c pingcap/tikv:latest "/tikv-server --ad..." 21 hours ago Up 21 hours 20160/tcp tidbdockercompose_tikv6_13b0ad2e0bdca pingcap/tikv:latest "/tikv-server --ad..." 21 hours ago Up 21 hours 20160/tcp tidbdockercompose_tikv4_11406da392869 pingcap/tikv:latest "/tikv-server --ad..." 21 hours ago Up 21 hours 20160/tcp tidbdockercompose_tikv5_118e61ffa1d16 pingcap/tikv:latest "/tikv-server --ad..." 21 hours ago Up 21 hours 20160/tcp tidbdockercompose_tikv0_13b73d69459a1 pingcap/tikv:latest "/tikv-server --ad..." 21 hours ago Up 21 hours 20160/tcp tidbdockercompose_tikv3_12937aeac2dac prom/prometheus:v2.0.0 "/bin/prometheus -..." 21 hours ago Up 21 hours 0.0.0.0:9090->9090/tcp tidbdockercompose_prometheus_1c31d23ed1005 pingcap/pd:latest "/pd-server --name..." 21 hours ago Up 21 hours 2380/tcp, 0.0.0.0:32798->2379/tcp tidbdockercompose_pd6_1f4db9b818119 prom/pushgateway:v0.3.1 "/bin/pushgateway" 21 hours ago Up 21 hours 9091/tcp tidbdockercompose_pushgateway_19e606fd0faa4 pingcap/pd:latest "/pd-server --name..." 21 hours ago Up 21 hours 2380/tcp, 0.0.0.0:32797->2379/tcp tidbdockercompose_pd2_1324cadf7157d pingcap/tidb-vision:latest "npm start" 21 hours ago Up 21 hours 0.0.0.0:8010->8010/tcp tidbdockercompose_tidb-vision_140f6f455f9e8 pingcap/pd:latest "/pd-server --name..." 21 hours ago Up 21 hours 2380/tcp, 0.0.0.0:32796->2379/tcp tidbdockercompose_pd5_16816bc7b2b3e grafana/grafana:4.6.3 "/run.sh" 21 hours ago Up 21 hours 0.0.0.0:3000->3000/tcp tidbdockercompose_grafana_16cc72c28cec3 pingcap/pd:latest "/pd-server --name..." 21 hours ago Up 21 hours 2380/tcp, 0.0.0.0:32794->2379/tcp tidbdockercompose_pd1_143fc3cb44c11 pingcap/pd:latest "/pd-server --name..." 21 hours ago Up 21 hours 2380/tcp, 0.0.0.0:32793->2379/tcp tidbdockercompose_pd0_146dbda1d26a2 pingcap/pd:latest "/pd-server --name..." 21 hours ago Up 21 hours 2380/tcp, 0.0.0.0:32792->2379/tcp tidbdockercompose_pd3_15c8851118013 pingcap/pd:latest "/pd-server --name..." 21 hours ago Up 21 hours 2380/tcp, 0.0.0.0:32791->2379/tcp tidbdockercompose_pd7_1I also have 11x MySQL instances running. Will that impact the performance of either the TiDB or TiKV servers?
tl
May 30, 2018, 10:04:14 PM5/30/18
to TiDB user group
Hi Wilfred
在 2018年5月31日星期四 UTC+8上午9:38:53,Wilfred Chau写道:
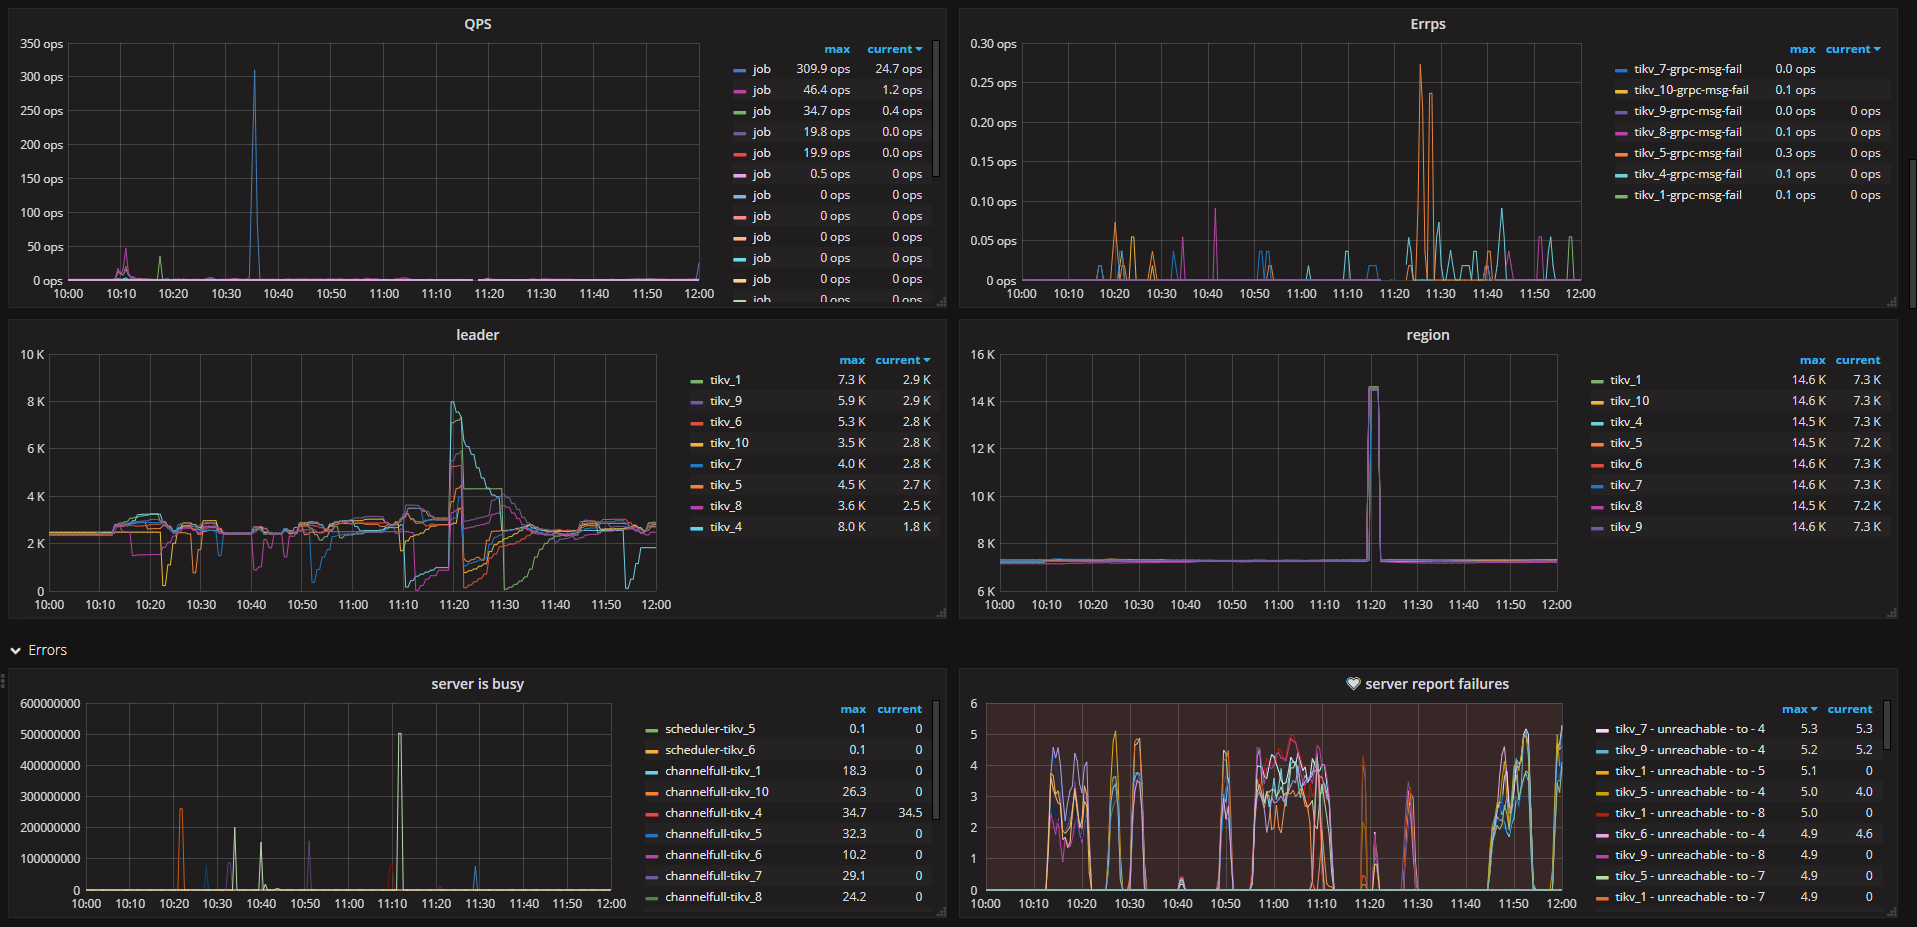
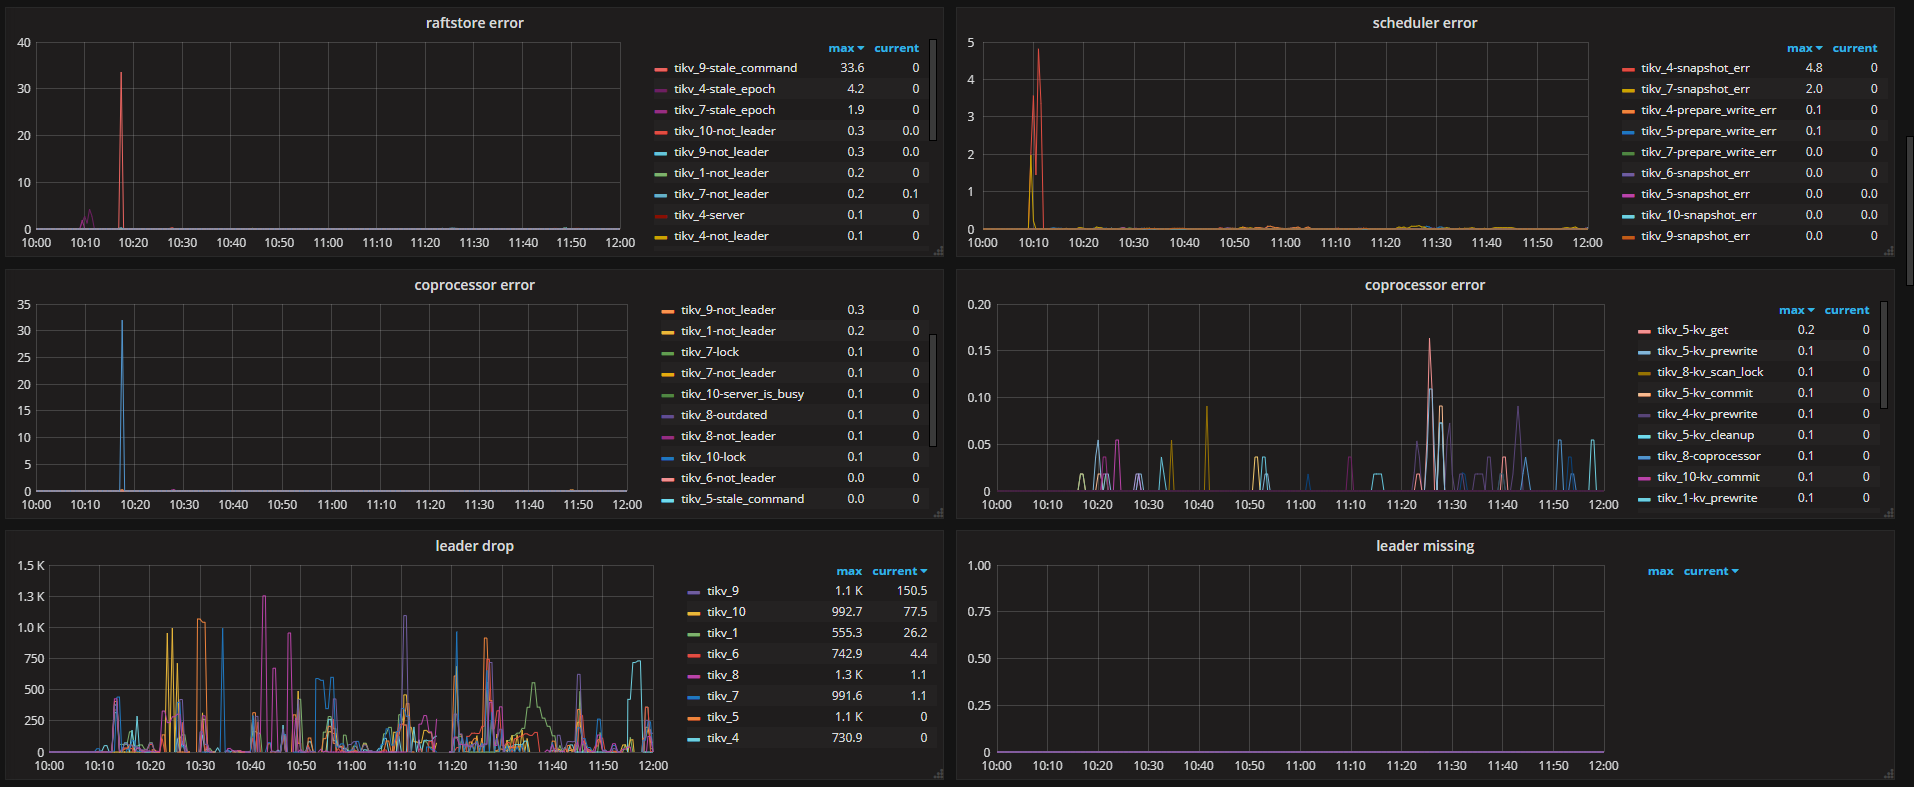
Your I/O is very busy. You can see the apply/append log durations which show that your I/O takes seconds even one minute.
Do you have a heavy write? can you show me your I/O statistics?
在 2018年5月31日星期四 UTC+8上午9:38:53,Wilfred Chau写道:
Wilfred Chau
Jun 1, 2018, 3:56:34 PM6/1/18
to TiDB user group
Hi tl
No heavy write. I have finished loading and try to compare query time against our single MySQL instance.
Here is the IO stats from tidbdockercompose_tikv0_1
Device:            tps   Blk_read/s   Blk_wrtn/s   Blk_read   Blk_wrtn
nvme0n1           0.00         0.04         0.00       6376          0
nvme1n1           0.00         0.04         0.00       6376          0
sda               5.49        47.33        84.44    7645802   13642048
sdb             995.66    131969.21    195750.25 21319748234 31623634432
sdb1 995.66 131969.18 195750.25 21319743930 31623634432Wilfred Chau
Jun 1, 2018, 4:41:49 PM6/1/18
to TiDB user group
Hi tl
Here I have some sar data from the host server for you. The entire docker-compose instance resides on a single device, i.e. /dev/sdb. Not sure the underlying raid level of the device though.
When the entire cluster is idle, disk %util stayed at 100%. Is it normal for TiDB? is IO the cause of our performance issue?
09:15:01 AM       DEV       tps     rkB/s     wkB/s   areq-sz    aqu-sz     await     svctm     %util
09:25:01 AM   nvme0n1      0.00      0.00      0.00      0.00      0.00      0.00      0.00      0.00
09:25:01 AM   nvme1n1      0.00      0.00      0.00      0.00      0.00      0.00      0.00      0.00
09:25:01 AM       sda      1.33      2.79      8.23      8.29      0.00      0.22      0.10      0.01
09:25:01 AM       sdb    607.33  20908.29  70593.18    150.66      5.63      9.27      1.60     97.02
09:35:01 AM   nvme0n1      0.00      0.00      0.00      0.00      0.00      0.00      0.00      0.00
09:35:01 AM   nvme1n1      0.00      0.00      0.00      0.00      0.00      0.00      0.00      0.00
09:35:01 AM       sda      1.49      1.25     21.45     15.26      0.00      0.07      0.07      0.01
09:35:01 AM       sdb    559.23  20957.42  69948.55    162.56      5.93     10.60      1.75     97.73
09:45:01 AM   nvme0n1      0.00      0.00      0.00      0.00      0.00      0.00      0.00      0.00
09:45:01 AM   nvme1n1      0.00      0.00      0.00      0.00      0.00      0.00      0.00      0.00
09:45:01 AM       sda      1.05      2.21      7.82      9.58      0.00      0.34      0.13      0.01
09:45:01 AM       sdb    560.21  19753.65  53069.84    129.99      4.88      8.72      1.76     98.45
09:55:01 AM   nvme0n1      0.00      0.00      0.00      0.00      0.00      0.00      0.00      0.00
09:55:01 AM   nvme1n1      0.00      0.00      0.00      0.00      0.00      0.00      0.00      0.00
09:55:01 AM       sda      1.44      2.15     26.34     19.74      0.00      0.08      0.07      0.01
09:55:01 AM       sdb    587.52   8730.17  58802.11    114.94      4.46      7.59      1.65     97.20
10:05:01 AM   nvme0n1      0.00      0.00      0.00      0.00      0.00      0.00      0.00      0.00
10:05:01 AM   nvme1n1      0.00      0.00      0.00      0.00      0.00      0.00      0.00      0.00
10:05:01 AM       sda      1.30      1.69     17.56     14.75      0.00      0.46      0.10      0.01
10:05:01 AM       sdb    554.94   8660.94  59493.93    122.81      4.29      7.74      1.75     97.28
10:15:01 AM   nvme0n1      0.00      0.00      0.00      0.00      0.00      0.00      0.00      0.00
10:15:01 AM   nvme1n1      0.00      0.00      0.00      0.00      0.00      0.00      0.00      0.00
10:15:01 AM       sda      1.35      4.66     11.99     12.35      0.00      0.17      0.08      0.01
10:15:01 AM       sdb    543.69   2402.36  52921.09    101.76      4.13      7.59      1.78     96.64
10:25:01 AM   nvme0n1      0.00      0.00      0.00      0.00      0.00      0.00      0.00      0.00
10:25:01 AM   nvme1n1      0.00      0.00      0.00      0.00      0.00      0.00      0.00      0.00
10:25:01 AM       sda      1.57      2.89     19.49     14.27      0.00      0.20      0.10      0.02
10:25:01 AM       sdb    539.69   5080.05  53002.54    107.62      4.15      7.70      1.79     96.87

10:25:01 AM       DEV       tps     rkB/s     wkB/s   areq-sz    aqu-sz     await     svctm     %util
10:35:01 AM   nvme0n1      0.00      0.00      0.00      0.00      0.00      0.00      0.00      0.00
10:35:01 AM   nvme1n1      0.00      0.00      0.00      0.00      0.00      0.00      0.00      0.00
10:35:01 AM       sda      1.14      2.07      9.63     10.29      0.00      0.17      0.08      0.01
10:35:01 AM       sdb    592.47  12123.26  61988.29    125.09      4.61      7.78      1.65     97.60
10:45:01 AM   nvme0n1      0.00      0.00      0.00      0.00      0.00      0.00      0.00      0.00
10:45:01 AM   nvme1n1      0.00      0.00      0.00      0.00      0.00      0.00      0.00      0.00
10:45:01 AM       sda      1.05      0.98      8.35      8.92      0.00      0.08      0.05      0.01
10:45:01 AM       sdb    526.41   4605.05  49706.94    103.17      4.12      7.83      1.83     96.31
10:55:01 AM   nvme0n1      0.00      0.00      0.00      0.00      0.00      0.00      0.00      0.00
10:55:01 AM   nvme1n1      0.00      0.00      0.00      0.00      0.00      0.00      0.00      0.00
10:55:01 AM       sda      1.48      1.96     19.47     14.46      0.00      0.15      0.11      0.02
10:55:01 AM       sdb    651.15  25394.93  75978.44    155.68      5.47      8.40      1.51     98.24
11:05:01 AM   nvme0n1      0.00      0.00      0.00      0.00      0.00      0.00      0.00      0.00
11:05:01 AM   nvme1n1      0.00      0.00      0.00      0.00      0.00      0.00      0.00      0.00
11:05:01 AM       sda      1.66      1.61     25.71     16.48      0.00      0.18      0.08      0.01
11:05:01 AM       sdb    590.44  32838.34  59714.54    156.75      4.55      7.71      1.66     98.24
11:15:02 AM   nvme0n1      0.00      0.00      0.00      0.00      0.00      0.00      0.00      0.00
11:15:02 AM   nvme1n1      0.00      0.00      0.00      0.00      0.00      0.00      0.00      0.00
11:15:02 AM       sda    704.50  16710.40   4097.72     29.54     32.37     45.86      0.31     22.06
11:15:02 AM       sdb   1173.25  27199.39  15116.44     36.07     14.56     12.41      0.72     84.82
11:25:01 AM   nvme0n1      0.00      0.00      0.00      0.00      0.00      0.00      0.00      0.00
11:25:01 AM   nvme1n1      0.00      0.00      0.00      0.00      0.00      0.00      0.00      0.00
11:25:01 AM       sda   1034.37  21293.69   1301.09     21.84     37.55     36.31      0.30     30.89
11:25:01 AM       sdb   1954.54  59335.46  29143.94     45.27      9.06      4.63      0.27     53.34
11:35:01 AM   nvme0n1      0.00      0.00      0.00      0.00      0.00      0.00      0.00      0.00
11:35:01 AM   nvme1n1      0.00      0.00      0.00      0.00      0.00      0.00      0.00      0.00
11:35:01 AM       sda     12.48    358.92     77.82     34.98      0.03      2.34      0.58      0.72
11:35:01 AM sdb 1242.32 58703.86 92151.65 121.43 29.82 24.00 0.80 100.00Wilfred Chau
Jun 1, 2018, 5:05:17 PM6/1/18
to TiDB user group
Hi tl
Ran an aggregate query against a table with 800 millions rows.
Failed with: ERROR 9001 (HY000): PD server timeout[try again later]
5 of 8 PD docker instances crashed.
Here is the disk IO, the instance is on /dev/sdb
12:45:01 PM       DEV       tps     rkB/s     wkB/s   areq-sz    aqu-sz     await     svctm     %util
12:55:01 PM   nvme0n1      0.00      0.00      0.00      0.00      0.00      0.00      0.00      0.00
12:55:01 PM   nvme1n1      0.00      0.00      0.00      0.00      0.00      0.00      0.00      0.00
12:55:01 PM       sda      6.23     22.90     46.81     11.19      0.00      0.33      0.14      0.09
12:55:01 PM       sdb   1345.00  61857.30  79253.37    104.91     27.14     20.18      0.74    100.00
01:05:01 PM   nvme0n1      0.00      0.00      0.00      0.00      0.00      0.00      0.00      0.00
01:05:01 PM   nvme1n1      0.00      0.00      0.00      0.00      0.00      0.00      0.00      0.00
01:05:01 PM       sda      7.96     54.06     48.22     12.85      0.00      0.46      0.19      0.15
01:05:01 PM       sdb   1321.42  56403.45  80030.99    103.25     24.55     18.57      0.76    100.00
01:15:01 PM   nvme0n1      0.00      0.00      0.00      0.00      0.00      0.00      0.00      0.00
01:15:01 PM   nvme1n1      0.00      0.00      0.00      0.00      0.00      0.00      0.00      0.00
01:15:01 PM       sda     42.00    146.75     78.32      5.36      0.03      0.63      0.22      0.92
01:15:01 PM       sdb   1299.73  49859.41  48992.58     76.06     35.70     27.45      0.77    100.00
01:25:01 PM   nvme0n1      0.00      0.00      0.00      0.00      0.00      0.00      0.00      0.00
01:25:01 PM   nvme1n1      0.00      0.00      0.00      0.00      0.00      0.00      0.00      0.00
01:25:01 PM       sda     30.52     82.72    154.41      7.77      0.01      0.43      0.13      0.39
01:25:01 PM       sdb   1163.95  51647.40  49182.69     86.63     40.93     35.15      0.86    100.00
01:35:01 PM   nvme0n1      0.00      0.00      0.00      0.00      0.00      0.00      0.00      0.00
01:35:01 PM   nvme1n1      0.00      0.00      0.00      0.00      0.00      0.00      0.00      0.00
01:35:01 PM       sda     74.04    214.57    397.39      8.27      0.07      0.95      0.14      1.03
01:35:01 PM       sdb   1238.41  56799.31  45824.03     82.87     42.46     34.31      0.81    100.00
01:45:01 PM   nvme0n1      0.00      0.00      0.00      0.00      0.00      0.00      0.00      0.00
01:45:01 PM   nvme1n1      0.00      0.00      0.00      0.00      0.00      0.00      0.00      0.00
01:45:01 PM       sda    115.97    456.65    580.71      8.94      0.27      2.36      0.20      2.26
01:45:01 PM       sdb   1372.61  64205.78  55543.91     87.24     40.30     29.37      0.73    100.00
01:55:01 PM   nvme0n1      0.00      0.00      0.00      0.00      0.00      0.00      0.00      0.00
01:55:01 PM   nvme1n1      0.00      0.00      0.00      0.00      0.00      0.00      0.00      0.00
01:55:01 PM       sda    479.37  10124.63    353.07     21.86     39.59     82.28      0.27     12.80
01:55:01 PM       sdb   1318.99  63266.65  48026.99     84.38     35.77     27.12      0.72     95.18

Average:          DEV       tps     rkB/s     wkB/s   areq-sz    aqu-sz     await     svctm     %util
Average:      nvme0n1      0.00      0.00      0.00      0.00      0.00      0.00      0.00      0.00
Average:      nvme1n1      0.00      0.00      0.00      0.00      0.00      0.00      0.00      0.00
Average:          sda     14.34    157.13     54.99     14.79      0.48     33.44      0.20      0.29
Average: sdb 1020.30 66752.16 93245.94 156.82 36.44 35.72 0.98 99.94Wilfred Chau
Jun 1, 2018, 6:38:49 PM6/1/18
to TiDB user group
Fyi tl.
I move PDs and KVs to different storage devices, see if I can minimize IO contention.
Didn't help at all. Running same aggregation query, failed with either:
ERROR 9003 (HY000): TiKV server is busy[try again later]
ERROR 9005 (HY000): Region is unavailable[try again later]
The first error returned from querying tables with 400million and 1.7billion rows of data.
The second error returned from querying a table with 2.2 billion rows of data.
Is it too much data for TiDB?
IOs output, PDs on nvme0n1 and KVs on nvme1n1
03:05:01 PM       DEV       tps     rkB/s     wkB/s   areq-sz    aqu-sz     await     svctm     %util
03:15:01 PM   nvme0n1     87.32    847.88    400.16     14.29      0.00      0.03      0.02      0.16
03:15:01 PM   nvme1n1  14393.87 258825.29 719143.02     67.94     15.43      1.07      0.05     77.94
03:15:01 PM       sda     46.78    557.12    225.45     16.73      0.47      9.96      0.55      2.59
03:15:01 PM       sdb    467.51 107402.18   1500.14    232.94      0.42      0.91      0.29     13.40
03:25:01 PM   nvme0n1     60.89      0.01    318.49      5.23      0.00      0.01      0.01      0.05
03:25:01 PM   nvme1n1  20404.76 489240.84 619499.93     54.34      9.89      0.48      0.05     98.64
03:25:01 PM       sda     80.76     76.48   1160.57     15.32      0.05      0.58      0.07      0.58
03:25:01 PM       sdb     23.82     17.80   1500.68     63.74      0.04      1.54      0.56      1.34
03:35:01 PM   nvme0n1     69.77    753.98    298.84     15.09      0.00      0.04      0.02      0.16
03:35:01 PM   nvme1n1  16592.75 515758.30 496730.99     61.02      9.75      0.59      0.05     77.45
03:35:01 PM       sda    691.96  25584.16    546.71     37.76     58.87     84.99      0.37     25.83
03:35:01 PM       sdb     59.93    951.44   1352.59     38.44      0.19      3.19      0.36      2.17
Average:      nvme0n1      2.72     17.18     59.03     28.01      0.00      1.23      0.02      0.01
Average:      nvme1n1    690.25  13512.04  37282.26     73.59      1.58      2.29      0.05      3.52
Average:          sda     29.55    556.37     87.93     21.80      1.46     49.44      0.26      0.77
Average: sdb 1033.13 81988.04 86310.03 162.90 33.63 32.55 0.93 95.94tl
Jun 2, 2018, 1:10:54 AM6/2/18
to TiDB user group
Hi Wilfred
I find that your cluster runs on SDB, is it a SATA disk? Why not using Nvme disk?
Your IO stats show that the disk util is nearly 100%, this may be the problem.
在 2018年6月2日星期六 UTC+8上午6:38:49,Wilfred Chau写道:
在 2018年6月2日星期六 UTC+8上午6:38:49,Wilfred Chau写道:

Nolouch Chen
Jun 2, 2018, 9:50:04 AM6/2/18
to TiDB user group
Hi Wilfred:
I see some errors like `fatal error: runtime: cannot allocate memory` in the PD log. Could you show me more details? The GO version, docker compose config, PD version, the dmsg and heap details in pprof API. and pay attention to the memory usage when you reproduce it.
在 2018年6月2日星期六 UTC+8上午5:28:25,Wilfred Chau写道:Hi tl
Wilfred Chau
Jun 4, 2018, 7:02:36 PM6/4/18
to TiDB user group
Hi
Here you go:
2018/06/04 20:21:08.258 printer.go:43: [info] GoVersion: go version go1.10 linux/amd64
PD version:
/ # ./pd-server -VRelease Version: v2.0.0-rc.4Git Commit Hash: e221ffb59f7b3433ee2e0a617f616dc92b02d007Git Branch: release-2.0UTC Build Time: 2018-03-31 06:49:39I rebooted the HW today and rerun the queries.
Had 2 observations:
1) when running an aggregate query on a table with 1.7 billion rows, it error out with
Error Code: 9003
TiKV server is busy[try again later]
Error Code: 9005
Region is unavailable[try again later]
after running it a few times, it eventually returned the correct results
2) when running the aggregate query against a table with 2.2 billion rows, it also error out with Error code 9003 and 9005, but it also crashed the entire cluster.
Error Code: 2003
Can't connect to MySQL server on 'x.x.x.x' (0)
There are 21 docker instances which share the 500GB of ram, why will it use up all memory? The requirement is 16GB per instance, is it right?
Attached are all the log files, kernel log and docker-compose file
Thanks!!
Wilfred Chau
Jun 4, 2018, 7:36:06 PM6/4/18
to TiDB user group
Just joined a 350millions rows of table with a table with 43 rows with and without limiting no of rows return.
TiDB crashed.
{"log":"goroutine 49691 [select]:\n","stream":"stderr","time":"2018-06-04T23:28:43.876156321Z"}{"log":"context.propagateCancel.func1(0x7f40ab17c100, 0xc95216c000, 0x132cf40, 0xc95216c060)\n","stream":"stderr","time":"2018-06-04T23:28:43.876158364Z"}{"log":"\u0009/usr/local/go/src/context/context.go:260 +0xff\n","stream":"stderr","time":"2018-06-04T23:28:43.876160465Z"}{"log":"created by context.propagateCancel\n","stream":"stderr","time":"2018-06-04T23:28:43.876162518Z"}{"log":"\u0009/usr/local/go/src/context/context.go:259 +0x1a7\n","stream":"stderr","time":"2018-06-04T23:28:43.876164553Z"}{"log":"2018/06/04 23:28:47.489 printer.go:38: [info] Welcome to TiDB.\n","stream":"stderr","time":"2018-06-04T23:28:47.491194177Z"}{"log":"2018/06/04 23:28:47.490 printer.go:39: [info] Release Version: v2.0.0-rc.4-31-gbfb6ec2\n","stream":"stderr","time":"2018-06-04T23:28:47.500227431Z"}{"log":"2018/06/04 23:28:47.490 printer.go:40: [info] Git Commit Hash: bfb6ec2ae8e77c8a884af9e1a31436daa887ab40\n","stream":"stderr","time":"2018-06-04T23:28:47.500232849Z"}{"log":"2018/06/04 23:28:47.490 printer.go:41: [info] Git Branch: master\n","stream":"stderr","time":"2018-06-04T23:28:47.500236818Z"}Wilfred Chau
Jun 26, 2018, 3:53:08 PM6/26/18
to TiDB user group
Hi Everyone,
Does anyone of you use the docker-compose to build your environment? Do you have any query like ours? i.e. joining a large table with a relatively smaller one? Sometime it ran successfully (not slow when comparing with a single node innoDB server) but other times, multiple tikv or pd would crash. And Tikv just keep restarting. Other times, tikv will be killed by OOM killer.
Will it improve performance to copy the small tables to all PDs?
We would like to distribute the data and at the same time maintain the query time to sub-second.
Or is TiDB not a designed for this type of query? If not, any suggestion?
Thanks

Morgan Tocker (PingCAP)
Jan 28, 2019, 2:02:10 AM1/28/19
to TiDB user group
Hi Wilfred,
> I ran 5 select in a session in sequence. 2 out of 5 ran successfully, the remaining 3 failed with a gc error
TiDB defaults to garbage collecting every 10 minutes, cleaning up to within 10 minutes of old rows. Documentation on how to increase retention is here:
Does anyone of you use the docker-compose to build your environment? Do you have any query like ours? i.e. joining a large table with a relatively smaller one? Sometime it ran successfully (not slow when comparing with a single node innoDB server) but other times, multiple tikv or pd would crash. And Tikv just keep restarting. Other times, tikv will be killed by OOM killer.
Docker-compose is good for testing TiDB, but for production the officially recommended method is ansible. Kubernetes is also supported, but not yet officially GA.
Will it improve performance to copy the small tables to all PDs?
PD should already be rebalancing the data as there are hotspots or regions need to be split.
We would like to distribute the data and at the same time maintain the query time to sub-second.Or is TiDB not a designed for this type of query? If not, any suggestion?
I would say that this query is well suited for TiDB. Most of the execution for SELECT COUNT(*) should be pushed down to the coprocessor for execution, which is very efficient.
I noticed that you were using an RC of 2.0. If you don't mind upgrading to 2.1 GA, I'd be happy to walk you through and debug the issue.
- Morgan
Reply all
Reply to author
Forward
0 new messages